30
THI
NTERNATIONALC
OSMICR
AYC
ONFERENCEDiscovery of Very High Energy Gamma-Rays from the Distant Flat Spectrum Radio Quasar 3C 279 with the MAGIC Telescope
M ASAHIRO T ESHIMA ,
1E LISA P RANDINI ,
2R UDOLF B OCK ,
1,2M ANEL E RRANDO ,
3D ANIEL
K RANICH ,
4P RATIK M AJUMDAR ,
1D ANIEL M AZIN ,
3E LINA L INDFORS ,
5E CKART L ORENZ ,
4,1M OS E ` M ARIOTTI ,
2V ILLI S CALZOTTO ,
2AND R OBERT W AGNER
1FOR THE MAGIC C OLLABORATION
1Max-Planck-Institut f¨ur Physik, D-80805 M¨unchen, Germany
2
Universit`a di Padova and INFN, I-35131 Padova, Italy
3
Institut de F´ısica d’Altes Energies, E-08193 Barcelona, Spain
4
ETH Zurich, CH-8093 Zurich, Switzerland
5
Tuorla Observatory, Turku University, FI-21500 Piikki¨o, Finland elisa.prandini@pd.infn.it & robert.wagner@mppmu.mpg.de
Abstract: The quasar 3C 279 is one of the best-studied flat spectrum radio quasars. It is located at a comparatively large redshift of z = 0.536: E > 100 GeV observations of such distant sources were until recently impossible both due to the expected steep energy spectrum and the expected attenuation of the γ-rays by the extragalactic background light. Here we present results on the observation of 3C 279 with the MAGIC telescope in early 2006. We report the detection of a significant very high energy γ-ray signal in the MAGIC energy range on the observation night of 2006 February 23.
Introduction
3C 279 (RA=12
h56
h11.1
s, Dec=−5
◦47
m22
s) was the first blazar discovered in γ-rays with the Comp- ton Gamma-Ray Observatory [1]. It is an excep- tionally bright and variable source at various en- ergy bands. In the optical, typical variations of 2
mhave been observed, while during flares, up to 8
mwere reached [2]. Variations were observed on day-scale [3], are mostly coherent at all frequen- cies, and the spectral energy distribution (SED) hardens when the source brightens [4]. Typical flux variations by factors of ∼ 20 in the GeV and
∼ 5−10 in the IR-to-UV have been found [5]. The strongest variability occurs on timescales of a few weeks to ∼ 6 months.
Blazars are thought to be supermassive black holes in the centers of galaxies accreting matter.
They possess strongly collimated, ultra-relativistic plasma outflows (jets), aligned closely to the ob- server’s line of sight. Thus, their SEDs are al- most entirely dominated by the jet emission. In νF
νrepresentations, they are characterized by two distinct nonthermal components. The lower en-
ergy bump is commonly ascribed to synchrotron radiation emitted by relativistic electrons. There is less agreement about the origin of the high- energy bump. In leptonic acceleration models, inverse Compton (IC) scattering of synchrotron (self-synchrotron Compton, SSC, models) or am- bient photons (external-inverse Compton, EIC, models) on high energy electrons explain the MeV- to-TeV radiation. While BL Lac objects can often successfully be described by SSC models, the more luminous Flat Spectrum Radio Quasars (FSRQ) usually are modeled requiring external compo- nents, particularly in the E > 100 keV regime [6], although the existence of EIC components is ques- tioned e.g. by [7, 8, 9].
Since its discovery in γ-rays, 3C 279 was exten- sively studied, in particular also during various multi-wavelength campaigns [3, 4, 6, 10, 11, 12].
The broadband SED extends from radio frequen- cies to the γ regime and is, with a comparatively low synchrotron peak, fairly typical of FSRQs.
Correlations between the two peaks, which are ex-
pected in leptonic models, were partially observed
[6], although no consistent patterns were found.
D
ISCOVERY OFVHE G
AMMA-R
AYS FROM3C 279
The SED of this source is rather complicated, and in spite of detailed observations, still poorly under- stood. Observations of the high-energy part of the spectrum are complicated by the fact that terres- trial and satellite-borne instruments together can, at present, not fully cover the frequency range of the high-energy bump. Additionally, the very high energy (VHE, defined by E > 100 GeV) spectrum is in part suppressed from interactions with the ex- tragalactic background light (EBL). This modifica- tion is, of course, strongly dependent on the source distance. Thus, distant VHE γ-ray sources repre- sent an excellent tool for determining the 0.3 to 30 µm EBL (e.g., [13]), which at redshift z = 0 was observed by various satellite experiments, al- though direct measurements suffer from huge fore- ground contaminations by light contributions from the solar system and our galaxy. As of now, sev- eral different EBL models have been proposed [13, 14, 15]. A precise measurement of the en- ergy spectrum of 3C 279 is crucial for two reasons:
With a state-of-the-art EBL model, emission mod- els for 3C 279 can be tested in detail. By using con- servative arguments on particle acceleration mech- anisms, the γ-ray emission of 3C 279 also permits to formulate stringent constraints on the EBL level.
All extragalactic VHE γ-ray sources detected so far are of the BL Lac type. These objects are the low-luminosity counterparts of the FSRQ class of AGNs [16], with their synchrotron peaks shifted to higher energies [17]. BL Lac objects have been detected aplenty recently in the VHE range:
17 BL Lacs have been found so far,
1reaching to redshifts of z = 0.212 [18], plus M87, as- sumed to be a misaligned BL Lac. The sam- ple includes also blazars as PG 1553+113 [19]
with its extremely soft energy spectrum and re- cently discovered BL Lacertae itself [20], which is the first “low-peaked BL Lac object” (ν
synchr<
10
14Hz). Both observations were largely made possible from the exceptionally low energy thresh- old of the MAGIC telescope.
In January 2006, 3C 279 was found in a high op- tical state, brightening to 14
m5 in the R-band.
2A WEBT campaign in early 2006 [12, 21] and multi-wavelength campaigns during both periods [11] were performed in order to get further infor- mation on the temporal and spectral properties of 3C 279.
Up to recently, a VHE γ-ray detection of 3C 279 was prevented by its high redshift of z = 0.536.
The resulting cutoff due to EBL attenuation is ex- pected at around E ≈ 200 GeV. The MAGIC (Ma- jor Atmospheric Gamma-ray Imaging Cerenkov) telescope [22] is currently the largest single-dish (17 m diameter) Imaging Atmospheric Cerenkov Telescope, located on the Canary Island of La Palma. With its low trigger threshold (50−60 GeV at low zenith angles) is best suited for observing the lower part of the VHE range of distant AGN spectra. At the geographical latitude of MAGIC (28
◦45
0N), 3C 279 can be observed under medium zenith angles (above 34
◦), with an accordingly in- creased observation threshold.
Observations and Analysis
3C 279 was observed from late January to April 2006 and in January 2007. Simultaneous optical R-band observations were carried out using the 1.03 m telescope at the Tuorla Observatory, Fin- land, and the 35 cm KVA telescope on La Palma.
Here we report results from the 2006 observations.
The VHE γ-ray observations were performed in the ON-OFF mode. ON data were collected while pointing directly to the source, while OFF data, necessary for the background estimation, were recorded by pointing to a nearby region of the sky.
The OFF region, in which no γ-ray source is ex- pected, was chosen to have a comparable zenith angle distribution and night sky conditions. From 2006 January 29 to 2006 April 4, 3C 279 was ob- served for 14.9 hours. In addition, 3.9 hours of OFF data were recorded. Data taken during non- optimal weather conditions or affected by hard- ware problems were excluded from the analysis.
This concerned 5.2 hours worth of ON data. The remaining events were calibrated [23] and ana- lyzed using the standard MAGIC analysis chain [24, 25]. Briefly, the analysis proceeds by reduc- ing the image to a single light cluster by removing noise, calculating image parameters [26], and us- ing a multi-variate method to discriminate γ-like 1. See http://www.mppmu.mpg.de/∼rwagner/sources/
for an up-to-date list
2. Long-term optical monitoring data are available at
http://users.utu.fi/kani/1m/
30
THI
NTERNATIONALC
OSMICR
AYC
ONFERENCEevents from the dominant hadronic background.
For the latter step, we use the Random Forest (RF) method [27], which combines the image parame- ters into a single test statistic, called hadronness, based on training samples of both Monte Carlo generated γ [28, 29] and real background events.
The excess events were identified using the classi- cal ALPHA approach by subtracting suitably nor- malized OFF data from the ON events. The sig- nificance of any excess was calculated according to Eq. 17 in [30]. The energy estimation for each event was performed using a RF method, too, lead- ing to a reasonably constant energy resolution of
≈23% above 150 GeV.
Results
The data were subjected to three independent anal- ysis chains, which obtain compatible results w.r.t.
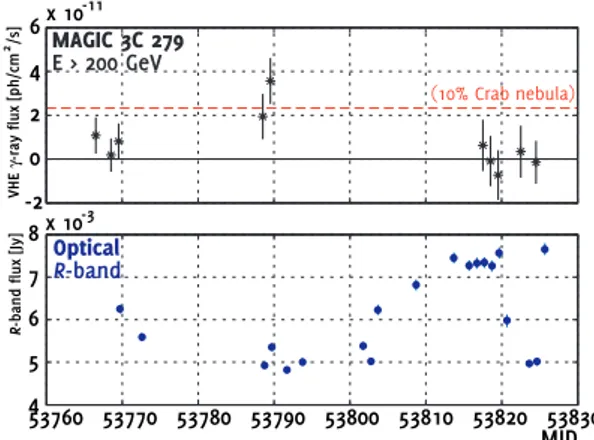
each other. A standard analysis with an energy threshold of ≈ 200 GeV was used to infer the E > 200 GeV light curve given in Figure 1.
Also shown is a R-band optical light curve for ten MAGIC observation nights from 2006 January 31 to 2006 March 31. The typical observation time per night is around one hour. While in most of the nights γ-ray fluxes compatible with zero were ob- served, during the 2006 February 22 observations a marginal signal was seen. In the night of 2006 February 23 we found a clear γ-ray signal with an integrated photon flux F (E > 200 GeV) = (3.5 ± 0.8) × 10
−11cm
−2s
−1. The source was observed for 62 minutes (MJD 53789.1633−53789.2064) at zenith angles between 35
◦and 38
◦. The stable event rate during this observation allows classify- ing it as “dark night” rate, although minimal moon- shine was present.
A low-energy analysis, exploiting the timing prop- erties of the air shower images with a lower analy- sis threshold, ≈ 110 GeV, was used to calculate the significance of the found excess. Threshold is defined as the maximum of the energy distribu- tion of the accepted events, viz. showers with en- ergies down to ≈ 80 GeV are included in the sam- ple. Both analyses show consistent results from E ≥ 200 GeV on. After subjecting the ON data to an ALPHA cut inferred from training on an (inde- pendent) Crab nebula data sample recorded at sim- ilar zenith angles, and subtracting a properly nor-
-2 0 2 4 6 x 10
-11
VHE γ-ray flux [ph/cm2/s]
53760 53770 53780 53790 53800 53810 53820 53830 4
5 6 7 8
MJD
R-band flux [Jy]
Optical R-band MAGIC 3C 279 E > 200 GeV
x 10
-3(10% Crab nebula)
Figure 1: MAGIC E > 200 GeV γ-ray (top) and optical R-band (bottom) light curves obtained for 3C 279 in early 2006.
malized OFF distribution in the signal region, 624 and 93 excess events remain between 80 and 220 GeV and between 220 and 600 GeV, respectively (Fig. 2). The data were separated into these two independent samples because of the very different γ/hadron separation powers in the two energy re- gions: Adding the highly-enriched, low statistics high-energy γ sample to the large statistics low- energy sample would spoil the overall significance calculation. The resulting significances are 6.1σ in the low energy region and 5.1σ in the high energy region; the excess is compatible with a point-like source and its position is consistent, within statis- tical uncertainties, with the 3C 279 position. The signal at low energies exceeds the intensity of the Crab nebula, while for E > 200 GeV it is ≈15%
of the Crab nebula flux. The spectral analysis of the data is ongoing. Our γ-ray detection was not accompanied by an optical flare or by particularly high flux levels or outbursts in X-rays [31, 32].
Conclusions
In observations triggered by a high optical state of
the flat spectrum radio quasar 3C 279, MAGIC was
able to detect a highly significant VHE γ-ray sig-
nal from this source, well-known and much studied
at lower energies. This discovery is a crucial step
forward for VHE γ-ray astronomy in various con-
texts:
D
ISCOVERY OFVHE G
AMMA-R
AYS FROM3C 279
1020304050607080
0 90
|ALPHA|
Evetns2200
1800 1600 2000
80 GeV < E < 220 GeV 624 excess events Significance: 6.13 σ
MAGIC 3C 279
2006 February 23 On time: 62 min
1020304050607080
0 90
|ALPHA|
220 GeV < E < 600 GeV 93 excess events Significance: 5.07 σ
MAGIC 3C 279
2006 February 23 On time: 62 min
Events
0 20 40 60 80 100 120 140