Observations of AGNs with the MAGIC Telescope
Daniel Mazin
∗and for the MAGIC collaboration
†∗Max-Planck-Institut für Physik, Föhringer Ring 6, D-80805 München
†updated author list can be found athttp://wwwmagic.mppmu.mpg.de/collaboration/members
Abstract. MAGIC is the currently world’s largest single dish ground based imaging atmospheric Cherenkov telescope.
During its first year of operation, very high energyγ-ray emission from several active galactic nuclei has been detected.
Here we present highlights of the data, including brief discussion about spectral and temporal properties of the emission.
Keywords: Gamma-Ray Astrophysics, AGN, HBL, EBL PACS: 95.85.Pw, 98.54.Cm, 98.70.Vc
INTRODUCTION
The search for very high energy (VHE, defined asE≥100 GeV)γ-ray emission from Active Galactic Nuclei (AGNs) is one of the major goals for ground-basedγ-ray astronomy. New detections open up a possibility of phenomenological studies of the physics inside the relativistic jets in AGNs, in particular of understanding both the origin of the VHE γ-rays as well as the relations between photons of different energy (from radio to VHE). The number of AGNs reported to be VHEγ-ray emitters (although increasing) is currently just 16 (January 2007).
In the first year of operation, the Major Atmospheric Gamma-ray Imaging Cherenkov (MAGIC) telescope observed two bright, well established TeV blazars Markarian 421 (Mkn 421) and Markarian 501 (Mkn 501). The goal of this observation was to measure their energy spectra down to 100 GeV and to probe variability scales in TeV energy domain down to a 2 minute time scale. While looking for new TeVγ-ray emitters, a sample of X-ray bright (F1 keV>2µJy) northern HBLs at moderate redshifts (z<0.3) was observed. In addition, Target of Opportunity observations were performed whenever MAGIC was alerted about sources being in a high flux state in the optical and/or X-ray band.
Here we highlight results of the observed established blazars Mkn 421 (z=0.030) and Mkn 501 (z=0.034) as well the discovery of Mkn 180 (z=0.045), 1ES 1218+304 (z=0.182), and PG 1553+113 (unknown redshift, z>0.09). The results from galactic observations are presented elsewhere in these proceedings [2].
OBSERVATIONS OF ESTABLISHED AGNS
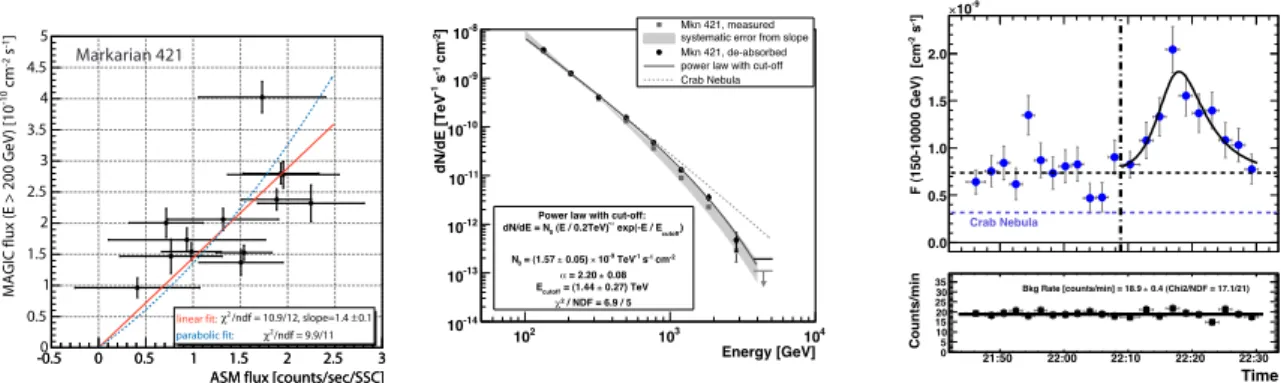
Markarian 421: Mkn 421 [3] was observed with the MAGIC between November 2004 and April 2005. During the entire observation period Mkn 421 was found to be in a medium flux state ranging from 0.5 to 2 Crab units above 200 GeV. Significant variations of up to a factor of four overall and up to a factor two in between successive nights were measured but no fast variation on a time scale of minutes was detected. Fig. 1 left plot shows a clear correlation between X-ray (taken from the All-Sky-Monitor on-board the RXTE satellite) and VHEγ-ray data confirming findings by previous experiments for Mkn 421. The measured spectrum and the reconstructed de-absorbed (i.e. corrected for the effect of extragalactic absorption) spectrum are shown in Fig.??, middle plot. The de-absorbed spectrum of Mkn 421 is clearly curved. It is a clear evidence that the curvature has an intrinsic origin rather than being caused by the absorption of the VHEγ-rays by the EBL photons. The de-absorbed spectrum indicates a flattening towards 100 GeV.
For details of the analysis and results see [4].
Markarian 501: Mkn 501 [5] was observed in June and July 2005 with the MAGIC telescope. The source was found to be in a rather low flux state during most of the observations. The flux level above 200 GeV was 30%-50%
of the Crab Nebula flux with a strong indication of an IC peak. On five nights, the source was found in a flaring state with the flux reaching up to 4 Crab units. Moreover, a rapid flare with a doubling time as short as 2 minutes rising time was detected on the night of 09 July 2005 (right plot in Fig. 1). The rapid increase in the flux level was accompanied by a hardening of the differential spectrum. This is the first time that spectral hardening was detected on time scales of some 10 minutes. Details on the analysis and results on the observation of Mkn 501 can be found in [6, 7].
ASM flux [counts/sec/SSC]
-0.5 0 0.5 1 1.5 2 2.5 3
ASM flux [counts/sec/SSC]
-0.5 0 0.5 1 1.5 2 2.5 3
MAGIC flux (E > 200 GeV) [10-10 cm-2 s-1]
0 0.5 1 1.5 2 2.5 3 3.5 4 4.5 5
0.1
± /ndf = 10.9/12, slope=1.4 χ2
linear fit:
/ndf = 9.9/11 χ2 parabolic fit:
Markarian 421
Energy [GeV]
102 103 104
]-2 cm-1 s-1dN/dE [TeV
10-14
10-13
10-12
10-11
10-10
10-9
10-8 Mkn 421, measured
systematic error from slope Mkn 421, de-absorbed power law with cut-off Crab Nebula
Power law with cut-off:
cutoff) exp(-E / E -α (E / 0.2TeV) dN/dE = N0
cm-2 s-1 TeV-1 10-9
× 0.05)
± = (1.57 N0
0.08
± = 2.20 α
0.27) TeV
± = (1.44 cutoff E
/ NDF = 6.9 / 5 χ2
]-1 s-2F (150-10000 GeV) [cm
0.0 0.5 1.0 1.5 2.0
10-9
×
Crab Nebula
Time 21:50 22:00 22:10 22:20 22:30 Counts/min 0510
15 20 25 30
35 Bkg Rate [counts/min] = 18.9 ± 0.4 (Chi2/NDF = 17.1/21)
FIGURE 1. Left plot: Correlation plot between VHEγ-ray flux above 200 GeV and X-ray counts for 11 nights of Mkn 421 data.
Middle plot: The energy spectrum of Mkn 421 as measured by MAGIC. Right plot: Light curve above 150 GeV for Mkn 501 on the night of 2005 July, 9th.
DISCOVERY OF NEW SOURCES
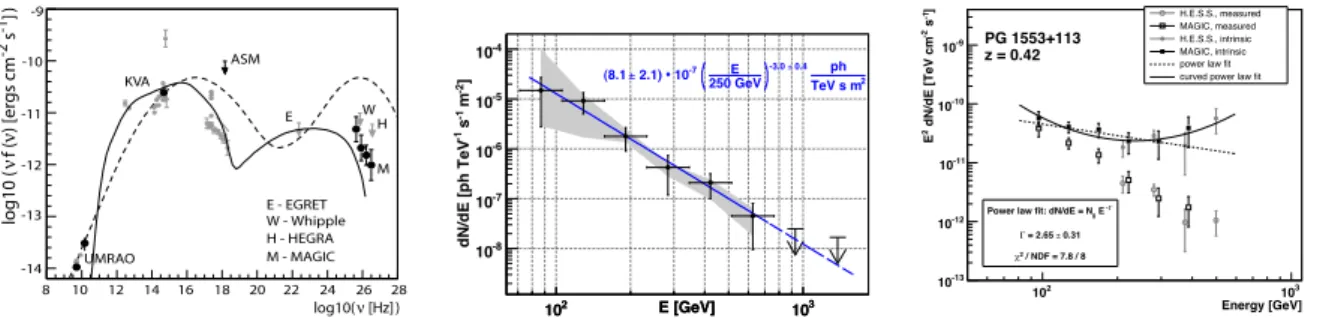
Markarian 180: The AGN Mkn 180 (1ES 1133+704) is a well-known HBL at a redshift ofz=0.045. Previous attempts to detect VHEγ-rays only resulted in upper limits. The observation of Mkn 180 was triggered by a brightening of the source in the optical on March 23, 2006, detected by the KVA telescope. Mkn 180 was observed by the MAGIC telescope in 2006 during 8 nights. The signal of 165 excess events was found with a significance of 5.5σ. No evidence for flux variability between nights was found. The observed integral flux above 200 GeV is 11% of the Crab Nebula flux. The intrinsic (corrected for the EBL absorption) energy spectrum of Mkn 180 is shown in Fig. 2 together with simultaneous and historical data. The VHEγ-ray spectrum is within the predictions of different leptonic models as indicated by the dashed and solid lines in Fig. 2, right panel. For details of this analysis and results see [8]. The discovery of VHE emission from Mkn 180 during an optical outburst makes it very tempting to speculate about the connection between optical activity and increased VHE emission. Since Mkn 180 has not been observed with MAGIC prior to the outburst and the upper limits from other experiments are above the observed flux level, further observations are needed.
1ES 1218+304: The AGN 1ES 1218+304 is another well-known HBL at a redshift ofz=0.182. It was observed several times with the Whipple telescope and the HEGRA system resulting in upper limits in TeV energy range.
MAGIC observed 1ES 1218+304 in seven nights in January 2005. The observed excess of 560 events has a statistical significance of 6.4 standard deviations above 140 GeV. 1ES 1218+304 is the first source discovered by MAGIC. The nightly averagedγ-ray lightcurve did not show signs of significant variability. The energy spectrum was fitted with a pure power law with a photon indexα=3.0±0.4, and the determined flux level is below the upper limits at higher energies determined in the past. For details of the analysis and results see [9].
PG 1553+113: This source belongs to a catalog of X-ray bright objects and, based on its SED properties, was one of the most promising candidates from a list of VHEγ-ray emitting AGNs proposed by [1]. Recently the H.E.S.S.
collaboration has presented evidence for a γ-ray signal at the 4σ level (up to 5.3σ using a low energy threshold analysis) above 200 GeV corresponding to about 2% of the Crab flux [10]. PG 1553+113 was observed with the MAGIC telescope in 2005 and 2006. Combining the data from 2005 and 2006, a very clear signal was detected with a total significance of 8.8σ. Inγ-rays there was no evidence for short term variability on a time scale of days, but a significant change by a factor of three in the flux level from 2005 to 2006 was found. The combined 2005 and 2006 differential energy spectrum for PG 1553+113 is well described by a pure power law with a photon index α =4.2±0.4. Details of the analysis can be found in [11]. The signal detected by MAGIC confirms the tentative signal seen by H.E.S.S. at a higher energy threshold with data taken at about the same time as MAGIC in the 2005 period [10]. The source, therefore, can now be considered as a firmly established VHEγ-ray emitter.
An interesting aspect of the source is that attempts to determine its redshift from the optical observations failed so far. However, the VHEγ-ray spectrum of PG 1553+113 can be used to derive an upper limit on the redshift of the source. Given the observed spectrum of PG 1553+113 and the minimum possible density of the evolving EBL (lower limit in [12]) we vary the distance of the source (z) until the fit on the reconstructed intrinsic spectrum yields a photon index, which is beyond the theoretically allowed value (α<1.5). Taking into account the statistical error on the fit and
E [GeV]
1022 E [GeV] 103
10 103
]-2 m-1 s-1dN/dE [ph TeV -8
10 10-7 10-6 10-5 10-4
TeV s m2 ph 0.4
± -3.0 250 GeVE 10-7 2.1) • (8.1 ±
Energy [GeV]
102 103
]-1 s-2 dN/dE [TeV cm2E
10-13 10-12 10-11 10-10 10-9
Γ E - Power law fit: dN/dE = N0
0.31 = 2.65 ± Γ
/ NDF = 7.8 / 8 χ2
H.E.S.S., measured MAGIC, measured H.E.S.S., intrinsic MAGIC, intrinsic power law fit curved power law fit
PG 1553+113 z = 0.42
FIGURE 2. Left plot: The spectral energy distribution of Mkn 180. Simultaneous data (UMRAO, KVA, ASM, and MAGIC) are noted in black. Grey points represent historical data. The arrows denote the upper limits from ASM, EGRET, Whipple, and HEGRA.
The solid and the dashed lines are predictions from leptonic models. Middle plot: Measured energy spectrum of 1ES 1218+304.
Right plot: Measured spectrum of PG 1553+113 together with the de-absorbed spectrum assuming a redshift of z=0.42 and a minimum evolving EBL. For redshifts z>0.42, the spectrum of PG 1553+113 has an evident break to higher energies.
the systematic error on the slope (0.2) we derived an upper limit on the redshift ofz<0.74. This value is identical with the one reported in [10]. For details of the analysis and results see [11]. An even stronger upper limit on the redshift of PG1553+113 was derived by [13] by combining the H.E.S.S. and MAGIC spectra and assuming a single emission component at VHE.
CONCLUSION AND OUTLOOK
We gave an overview about outstanding findings based on MAGIC observations of extragalactic objects. The number of extragalactic VHEγ-ray sources detected by MAGIC is currently seven. Two of them, 1ES 1218+304 and Mkn 180 have been discovered by MAGIC. PG 1553+113 has been co-discovered with H.E.S.S. In general, the reconstructed de-absorbed spectra seem to be the harder the further away the sources are, which might be related to an observational bias. Leptonic models can describe the data, but there are exceptions like in case of 1ES 1959+650. For detailed modeling of the sources, extensive multiwavelength campaigns including radio through optical telescopes and X-ray satellites are inevitable. In case of PG 1553+113, we conclude that either the redshift of the source is z<0.42 or for the first time a source with a clear evidence of a second emission component in the VHEγ-ray energy range has been observed. Re-observation of the presented sources as well as the analysis of further extragalactic objects is ongoing.
Acknowledgements: The support of the German BMBF and MPG, the Italian INFN, the Spanish CICYT, ETH research grant TH 34/04 3, and the Polish MNiI grant 1P03D01028 is gratefully acknowledged.
REFERENCES
1. Costamante, L. & Ghisellini, G., A&A384, 56-71 (2002) 2. Torres, D. for the MAGIC collaboration, These Proceedings 3. Punch, M. et al., Nature358, 477-478 (1992)
4. Albert, J. et al., Accepted by ApJ, astro-ph/0603478 (2006) 5. Quinn, J. et al., ApJ456, L83 (1996)
6. Albert, J. et al., Submitted to ApJ, astro-ph/0702008 (2007) 7. Paneque, D. for the MAGIC collaboration, These Proceedings 8. Albert, J. et al., ApJ648105-109 (2006)
9. Albert, J. et al., ApJ642, L119-L122 (2006) 10. Aharonian, F. et al., A&A448, L19-L23 (2006) 11. Albert, J. et al., Subm. to ApJ, astro-ph/0606161 (2006) 12. Kneiske, T. M. et al., A&A413, 807-815 (2004) 13. Mazin, D. and Goebel, F., ApJ655, L13-L16 (2007)