28th International Cosmic Ray Conference 2615
Study of the VHE Gamma Ray Emission from the AGN 1ES1959+650 with the HEGRA Cherenkov Telescope CT1
Nadia Tonello1 and Daniel Kranich1, for the HEGRA Collaboration
(1) Max-Planck-Institute for Physics (Werner-Heisenberg-Institute), Foehringer Ring 6, Munich 80805, Germany
Abstract
The BL Lac object 1ES1959+650 has been observed by the HEGRA Col- laboration in the years 2000, 2001 and 2002. Here we report on the results ob- tained in 2002 with the standalone CT1 telescope. While the source has only shown weak TeV activity until mid-May 2002, significant TeV emission has been observed later in 2002. During 2002 the source has been monitored for about 200 hours, of which 30 hours data were taken under moonlight conditions. The signal from the ’dark’ time 2002 data set showed a significance of 11σ. Preliminary results on the light curve and the spectrum of the 2002 ’dark’ time data up to 45◦ zenith angle are presented.
1. Introduction
The galaxy 1ES1959+650 has a strong emitting jet from the nucleus, ori- ented along the line of sight. It was predicted by [8] to be a TeV γ-ray emitter candidate from scaling its X-ray observed spectrum, and from studies based on the synchrotron-self Compton model [2]. It was detected for the first time as a TeV γ-ray emitter by the Telescope Array experiment [7], that reported a signal with a significance of 3.9σ after 56.7 hours of observation in 1998.
In 2000 and 2001 the HEGRA collaboration observed 1ES1959+650 with the CT System for 94 hours. The source was at low state and an averaged signal of 5.4σ of significance level was recorded [3]. In May 2002 the VERITAS Collaboration reported a strong TeV γ-ray signal from 1ES1959+650 [11]. The detection had a significance of 13σ from observation in 2 consecutive nights. The followed observations by the HEGRA Collaboration confirmed 1ES1959+650 as a highly variable VHE γ-ray source [1,4]. The results of observations with the HEGRA CT System are reported elsewhere on this conference.
2. Observations with the HEGRA CT1 Telescope and Data Analysis
The HEGRA Cherenkov Telescopes are installed at the Roque de los Muchachos Observatory on the Canary Island of La Palma (28.75◦ N, 17.89◦ W, 2200 a.s.l.). The telescope CT1 [6] has a mirror area of 10.3 m2 and a camera pp. 2615–2618 c2003 by Universal Academy Press, Inc.
2616
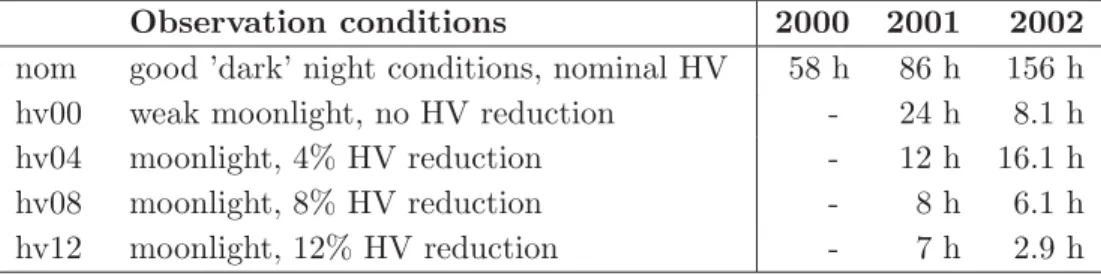
Table 1. Observation times of 1ES1959+650 with HEGRA CT1
Observation conditions 2000 2001 2002 nom good ’dark’ night conditions, nominal HV 58 h 86 h 156 h hv00 weak moonlight, no HV reduction - 24 h 8.1 h hv04 moonlight, 4% HV reduction - 12 h 16.1 h
hv08 moonlight, 8% HV reduction - 8 h 6.1 h
hv12 moonlight, 12% HV reduction - 7 h 2.9 h
of 127 pixels of 0.25◦ diameter each. The camera has a FOV of 3◦ diameter. In zenith position, the telescope has an energy threshold of 750 GeV and a typi- cal source discovery sensitivity of 3.5 σ ×√
t, with t in hours, for a Crab-like source. Table 1 summarizes the CT1 observation times of different background light conditions of 1ES1959+650. The observation angle ranged between 36.4◦ and 54.2◦ (with rather few data above 45◦). A total of 1.6 million triggers have been recorded in 2002.
Quality cuts are applied to the raw data in order to reject accidental noise triggers and nights with bad atmospheric conditions. The image parameters of the recorded events were calculated. The adopted γ/hadron separation method is described in [5]: the so-called dynamical super-cuts in the parameters DIST, WIDTH and LENGTH are applied, in order to take into account variations of the image parameters with the zenith angle, the energy of the primary particle and the impact parameter of the shower (estimated mainly from the image parameter DIST). The ALPHA parameter distribution after the dynamical super-cuts for
’dark’ nights data, taken up to a zenith angle of 45◦, is shown in Figure 1. The number of recorded γ events has been estimated by fitting this distribution with a Gaussian function in the signal region 0◦ < ALPHA < 13◦ and a smooth background (BG) has been estimated by fitting the same data sample with a polynomial of second order (without linear term) in the range 20◦ < ALPHA <
80◦, where no signal is expected. The BG was then extrapolated down to ALPHA
= 0◦. In Figure 1b the BG parametrization is verified for a pure BG sample.
3. Results
The CT1 data taken in 2000 and 2001 (not shown here) reveal that the source was in a low state. The averaged estimated γ-ray flux above 1TeV was between 5% and 6% of the Crab flux at the same energy range [9,10].
The ALPHA distribution analysis for the data taken during the year 2002 for ∼ 150 h of observation (Figure 1) shows a γ-ray signal from 1ES1959+650 with a significance of 11.1σ, with 664 ± 40 excess and 1672 ± 37 BG events for ALPHA < 13◦. The error takes the BG extrapolation uncertainty into account.
2617
ALPHA (deg) 0 10 20 30 40 50 60 70 80 90
events
300 400 500 600 700 800 900 1000 1100 1200
ALPHA plot 1ES1959+650
CT1 2002 data max.ZA: 45 deg
ALPHA (deg) 0 10 20 30 40 50 60 70 80 90
events
300 400 500 600 700 800 900 1000 1100 1200
ALPHA plot OFF-data
CT1
Fig. 1. Left: Distribution of the image pa- rameter ALPHA for the 2002 data; max- imum zenith angle: 45◦. Right: AL- PHA distribution of a normalized sample of off-data, plotted here for comparison.
Energy (TeV)
1 10
)-1 TeV-1 s-2dN/dE [cm
10-16 10-15 10-14 10-13 10-12 10-11
1ES1959+650 Differential Spectrum, CT1 2002
Fig. 2. Differential spectrum of the AGN 1ES1959+650 (HEGRA CT1 2002 data set, no moonlight, max.ZA 45◦). The line that fits the data is a power law with a fixed cut- off energy of 2.4 TeV.
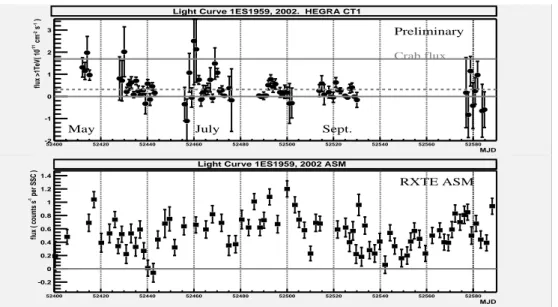
The TeV light curve of the year 2002 is shown in Figure 3 together with the 2-12 keV activity monitored by RXTE ASM [12]. Two periods of stronger activity were recorded in that year: one in May (MJD 52414), when the Crab flux was reached, and a flare in July (MJD 52460 and 52470). The first comparisons between the X-ray fluxes and the TeV fluxes show no evident correlation between the two considered energy ranges. The differential spectrum of the source is shown in Figure 2. It can be fitted with a power law function, with a spectral indexα = 3.49±0.19 (χ2/d.o.f. = 9.1 /6). On the other hand, the Extragalactic Background Light should already affect the spectrum above a few TeV. We tried also a power law approach modified by an exponential energy cutoff. Using a cutoff of Ec = 2.4 TeV [3] resulted in a somewhat better fit with α= 2.54± 0.21, χ2/d.o.f. = 7.1 /6. The data quality is too poor above a few TeV to draw decisive conclusions.
4. Discussion and Conclusions
The AGN 1ES1959+650 has been observed with the HEGRA CT1 tele- scope. In May and July 2002, a short period of high emissions in the TeV range was observed, followed by a gradual decrease. The analysis of the 150 ’dark’ hours of observations with good conditions show a signal with a significance of 11.1σ. The averaged spectrum can be described by an unbroken power law, but a cutoff around 2.4 TeV is equally likely. A simple attempt to study X-ray-TeV correlation showed no significant correlation. In particular, we note that the X-ray flux did not vary significantly around the TeV flare at MJD 52460-52470. It is expected
2618
MJD
52400 52420 52440 52460 52480 52500 52520 52540 52560 52580
)-1 s-2 cm-11flux >1TeV( 10
-2 -1 0 1 2 3
Light Curve 1ES1959, 2002. HEGRA CT1
Crab flux
MJD
52400 52420 52440 52460 52480 52500 52520 52540 52560 52580
per SSC )-1flux ( counts s
-0.2 0 0.2 0.4 0.6 0.8 1 1.2 1.4
Light Curve 1ES1959, 2002 ASM
May July Sept.
RXTE ASM Preliminary
Fig. 3. The light curve of the data taken with HEGRA CT1 in 2002 (above), in absence of moonlight. Below: data taken with RXTE ASM in the same period.
that next generation low threshold IACTs might allow detailed clarifying studies.
Acknowledgments. We would like to thank the IAC for the excellent working con- ditions on the La Palma Observatorio Roque de los Muchachos. We acknowledge the rapid availability of the RXTE ASM data. This work was supported by the German Ministry of Education and Research, BMBF, the Deutsche Forschungsgemeinschaft, DFG, and the Spanish Research Foundation, CICYT.
References
1. Aharonian F. et al. 2003, submitted to A&A Letters, astro-ph/0305275 2. Costamante L., Ghisellini G. 2002, A&A 384, 56
3. Horns D. et al. 2002, The Universe Viewed in Gamma-Rays, Kashiwa, Japan 4. Konopelko A. et al. April 2002, APS/HEAD Meeting, Albuquerque
5. Kranich D. 2001a, PhD Thesis, TUM, Munich, Germany 6. Mirzoyan R. et al. 1994, NIM A 351, 513
7. Nishiyama T. et al. 1998, Proc. 26th ICRC , OG.2.1.21
8. Stecker F.W., de Jager O.C., Salamon M.H. 1996, ApJ 473, L75-L78 9. Tonello N., Kranich D. March 2002 , DPG Tagung, Aachen, Germany 10. Tonello N. PhD Thesis in preparation, TUM, Munich, Germany 11. Weekes T. et al. 17 May 2002, IAU, Circular No.7903
12. http://heasarc.gsfc.nasa.gov/cgi-bin/xte weather/