28th International Cosmic Ray Conference 2389
Observation of VHE Gamma Rays from the Remnant of SN 1006 with HEGRA CT1
Vincenzo Vitale,1, for the HEGRA Collaboration
(1) Max Planck Institute for Physics, F¨ohringer Ring 6, Munich, Germany
1. Abstract
The HEGRA collaboration observed the shell-type remnant SN1006 with the telescope CT1 for 219 h. For the observations we pointed the telescope towards the SNR center. An excess is observed from NE part of the rim with a statistical significance of ≈ 5 σ. Only large zenith angle (ZA) observations ( >70◦) are possible from the telescope site. The energy threshold is ≈ 18 TeV. We discuss the analysis and the problems related to large ZA observations.
2. Introduction
Supernova remnants (SNRs) are considered as the most likely sources of galactic cosmic ray. The shell type remnant G327.6+14.6 is originated from the SN 1006. This remnant is nearly circular (angular diameter ≈ 0.5◦, radius of 9.5 pc, distance 2.18 ± 0.08 Kpc )[1], limb-brightened and shows the NE and SW regions significantly brighter than the rest of the shell (bipolar or barrel- shaped)[1]. The shell expands with velocity 2890±100 km/s [2] into a low density ISM. ASCA and ROSAT detected non-thermal X rays from the NE (the brighter one) and SW regions [5],[6]; while Cangaroo [7] detected TeVγ rays only from the NE part of the rim. Non-thermal X rays were explained as synchrotron emission from 10-100 TeV electrons . The possible origins of the TeV radiation are : 1) the above electron population, which can produce TeV γ rays via inverse Compton scattering on the CMBR and local IR photons ; 2) a possible contribution from accelerated hadrons (π0 ⇒γγ)[6].
3. Observations and Analysis
We observed SN 1006 for 219 hours from 1999 to 2001 with the HEGRA telescope CT1. CT1 is part of the HEGRA cosmic ray detector complex on La Palma (28.75◦ N, 17.9◦ W, 2225 m asl). SN 1006 (Ra 15:02:48.8, Dec -41:54:42) culminates at less than 20◦ elevation when observed from La Palma. Therefore only large zenith angle (ZA) observations are possible. We collected in total 346000 so-called ON-source events restricting observations to a narrow zenith range between 71-73◦ ZA as well as a small set of OFF-source data at the same pp. 2389–2392 c2003 by Universal Academy Press, Inc.
2390
ZA. We recorded also a large background sample of muons passing through the camera. Such muons leave narrow images, which might mimic γ events. The data reconstruction proceeded in the following way: At first we applied the usual filter cuts rejecting accidental noise triggers or event samples recorded during non-optimal atmospheric conditions [8,9,10]. As a next step the image parame- ters were reconstructed and various cuts applied to select γ events. Because of the large ZA observations we had to modify considerably our standard γ/h sep- aration procedure. The image dimensions shrink with the ZA (roughly ∝ cos(ZA)1 ). The shape of small images is determined with less precision than in the zenith position because the pixel diameter is constant. Therefore the γ/h separation power decreases. The change of the image parameters could be either evaluated by Monte Carlo simulations or by studying real hadron events and assuming that γ image parameters would scale in the ratio. We opted for the second procedure and studied a large sample of hadronic images covering the entire ZA range be- tween 0◦ and more than 70◦ [10]. Up to 45◦ we could verify the scaling of the γ image parameters with events from a large sample of Crab Nebula and Mkn 421 data. We assumed that the scaling is also applicable to data at 72◦ ZA. ( An error in the extrapolation should not fake a possible source but would mainly result in a less than optimal selection ofγs). The scaled image cuts in Width and Length were applied to the data. Muons are more likely to generate background at large ZA observations because muons are more likely to pass simultaneously the glass envelope of many PMs. We studied the muon rate with closed camera and found a raw rate of 5.1×10⁻³ Hz at 72◦ ZA. Efficient muon rejection cuts were developed [10] from comparing the measured muon event topology with MC simulated γ candidates. Only a fraction of 1.8×10⁻³ survived the cuts while the majority of γs passed these cuts.
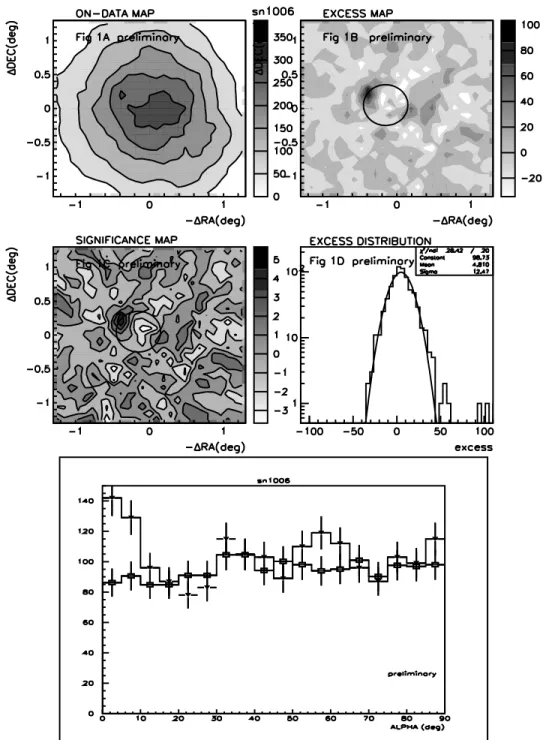
For the search of a possible excess of localizedγ emission around SN 1006 we applied the False Source Method (FSM). A grid of 0.1◦ step size was defined in the FOV and at each knot we searched for a pointlikeγsource. This method works also for slightly extended sources underestimating somewhat the γ flux. At each knot we applied the usual Distance cut and applied a 12.5◦ cut in the ALPHA distribution. The remaining sample is basically a coarse measurement of the hadron flux across the FOV (it should be noted that there is a twofold ambiguity because one is not able to distinguish the head/tail of the shower). Fig 1A shows the reconstructed hadronic background as well as a possible excess. Already at this step an excess around RA=15:04:10 and DEC =-41:40:00 is visible. In the next step we tried to subtract the background by extrapolating in each ALPHA distribution the background in the 0-12.5◦ ALPHA range. For this procedure we fitted a second degree polynomial (without the linear term) to the data between 20 and 80◦. Then we subtracted the extrapolated background into the low ALPHA regime from the actual data and determined the excess. The procedure has been
2391 extensively tested [9]. The excess map is shown in Fig 1B. A clear excess is found at the NE rim . Significance is in part influenced by the background statistics.
We improved the background precision by averaging over a ring around the center of the FOV but leaving out a section, around the position under test , which might contain γ events [10]. This method increases the background statistics by a factor ≈ 3 and reflects the true behavior at the low ALPHA range. The lower panel in Fig 1 shows the ALPHA distribution of the excess bin together with the higher statistics background distribution in the ring. An excess of 103±17 over a background of 225 events has been determined using the recommended procedure [7]. The significance of the excess is 5.6σ. The excess location is nearly coincident with the observation of the Cangaroo group. If we allow for an uncertainty 9 bins we obtain a reduced significance of 5.1σ. We verified the correct positioning of the telescope at large ZA by measuring the position of two bright stars in the FOV. The positions of κ Cen (mag=3.13) and β Lup (mag=2.68) allowed us to determine the excess position with 0.1◦precision. For a 5σexcess it is not possible to determine a spectrum. From MC simulations including all above mentioned cuts we calculated a threshold of 18 TeV and the collection area assuming an unbroken powerlaw with spectral index of -2.3 [5]. Using the experimental data and the parameters from the simulation we calculated a preliminary integral flux of Φ(>18 TeV) = (2.5± 0.5stat)×10−13cmph2s. The evaluation for other photon indices and of the systematic error (at least 35%) is still ongoing.
4. Summary and Conclusions
From the analysis of the large zenith angle observation of SN 1006 we conclude: a) that we see evidence (5.1 σ) for γ-emission at the NE rim of the shell coinciding within 0.1◦ with the Cangaroo observation at lower energies. b) The threshold of CT1 at 72◦ ZA is 18 TeV assuming an unbroken powerlaw with a spectral coefficient of -2.3 . c) A preliminary integral flux of Φ(E>18 TeV) = (2.5 ± 0.5stat)×10−13cmph2s has been determined. The systematic error is still under study but is at least 35%. d) We observe no excess at the SW rim and determined an upper limit of 1.6×10⁻¹³cmph2s (C.L. 99.5%) We conclude further that it is possible to carry out searches forγ sources at large ZA although limitations from the pixel size and the large threshold are obvious.
REFERENCES: 1. Long & al. 2003, ApJ 586 2. Ghavamian & al. 2002, ApJ 572 3. Koyama & al. 1995, Nature 378 4. Willingale & al 1996, MNRAS 278 5. Tanimori & al. 1998, ApJ 497L 6. Berezhko & al. 2002, A& A 395 7.
Li & Ma 1983, ApJ 272 8. Kestel M. PhD th. 9. Kranich D. 2001, PhD th. 10.
Vitale V. PhD th.,in prep.
2392
Fig. 1. Fig 1A is the sky map of ON-source data after γ selection but before of sub- traction of residual background; Fig 1B is the sky map of the excess (= ON-source - residual background); Fig 1C is the sky map of excess significance; Fig 1D is the distribution of the excess. Fig 1 lower panel is alpha distribution for ON-source data and background (ring method) at the NE rim position. All maps show the FOV of CT1; RA increases from right to left. The black circle in 1B and 1C shows the position of the SNR shell. The NE part of the rim is around the upper-left part of this circle.