ATLAS-CONF-2010-098 16November2010
ATLAS NOTE
ATLAS-CONF-2010-098
November 16, 2010
Observation of the B
±meson in the decay B
±→ J/ψ (µ
+µ
−) K
±in ATLAS
The ATLAS Collaboration
Abstract
The production ofB±mesons is observed in ATLAS through their decay toJ/ψ µ+µ− K±, using 3.4 pb−1of 7 TeV LHC collisions. A total of 283±22(stat.)signal decays are observed after subtracting the background, with a fitted mass of 5283.2±2.5(stat.) MeV. Within the statistical uncertainty, the fitted mass is consistent with the world average value.
1 Introduction
Charged Bmesons arising from bb¯ pairs produced in LHC collisions can be reconstructed exclusively from their decay to J/ψK± (branching fraction 0.1% [1]) using the J/ψdecay to a di-muon final state (branching fraction 6%). ATLAS can reconstruct B±mesons decaying to the J/ψ(µ+µ−)K±final state with high efficiency, provided at least one muon passes the trigger requirements.
The channelB± → J/ψ(µ+µ−)K± is a reference for a variety of high-precision B-physics measure- ments, such as the branching ratio of the rare B-decay Bs →µ+µ−. It will be used as a calibration tool for flavour tagging, needed for CP violation studies. The mass and lifetime measurements will test the performance of the inner detector (e.g. alignment, magnetic field and material).
In this note approximately 3.4 pb−1of ATLASppcollision data with √
s=7 TeV are used to recon- structB±mesons from theJ/ψ(µ+µ−)K±final state. The mass distributions of the signal and background are studied, the mean mass of the peak determined and the number of signal candidates is extracted.
2 Monte Carlo sample
A dedicated sample of 500k Monte Carlo (MC)B+→J/ψ µ+µ−
K+events is used to compare the mass position and resolution with the results obtained from the data. They are generated with P[2] using the ATLAS MC09 tuning [3]. The signal events are produced such that every generated event contains at least one instance of the signal process. Generated events are retained only if both muons from the J/ψ have transverse momenta pT >2.5 GeV. The ATLAS detector is simulated with the Geant4 package [4]
and the events are fully reconstructed with the same software that is used to process the data from the detector.
Unless stated otherwise, the reconstructed MC events are analyzed in exactly the same way as the data.
3 Data sample and trigger selections
The ATLAS detector [5] covers nearly the entire solid angle around the collision point with layers of tracking detectors, calorimeters and muon chambers. The muon and tracking systems are of particular importance in the reconstruction of theB±candidates. Only data where both were fully operational, and where the LHC beams were declared to be stable, are used here.
The data were collected in a period of rising instantaneous luminosity at the LHC, and the trigger conditions varied considerably over this time. Consequently, the trigger selections differ depending on the period of data taking. For periods with no High-Level Trigger (HLT) active, the lowestpT single and di-muon triggers at level-1 are used (without a minimum pT threshold imposed).
For data periods using HLT, events passing a variety of single and di-muon HLT triggers are accepted, with thresholds ranging from 4 to 10 GeV. For higher luminosity runs the single muon triggers with low thresholds were prescaled; events passing these triggers are accepted nevertheless.
Applying these requirements of data quality and trigger to √s = 7 TeV pp collision data taken between 24th June and 29th August 2010, provides a data sample of 3.4 pb−1. This luminosity estimate has an uncertainty of 11% [6].
4 Muon reconstruction
Muon identification and reconstruction in ATLAS extends over the pseudorapidity range|η|< 2.7, cov- ering a pT range above 1 GeV. In the muon reconstruction algorithms three categories of muons are
reconstructed:
• Muons from standalone reconstruction: The standalone muon reconstruction is entirely based on the tracks reconstructed in the Muon Spectrometer (MS). The track parameters are obtained from the MS track and are extrapolated to the interaction point, taking into account multiple scat- tering and energy loss in the traversed material. The standalone reconstruction covers|η|<2.7.
• Muons from combined reconstruction: The combined muon reconstruction relies on combining the fitted tracks from the standalone MS and Inner Detector (ID) reconstruction, selecting the tracks to be paired on the basis of tight matching criteria to create a combined muon track. Due to ID coverage, the combined reconstruction covers|η|<2.5.
• Muons from ID track tagging: A tagged muon track is formed by groups of hits in the muon de- tectors which are not associated with an MS track, but which are matched to ID tracks extrapolated to the MS. The reconstruction of tagged muons is of particular relevance for muons in thepTrange 3−8 GeV, as is the case for muons fromJ/ψdecays. Because of their lowpT, they are not always fully reconstructed in the MS as they will not reach all muon stations. Such a reconstructed muon adopts the measured parameters of the associated ID track. The muon tagging covers|η|<2.
In the current analysis, only combined and tagged muons are used; muon pairs should contain at least one combined muon.
5 B
±candidate selection
Events passing the data quality and trigger selections described in section 3 are required to pass the following additional criteria:
• Collision candidates: The event must contain at least one reconstructed primary vertex with at least 3 associated inner detector tracks in order to be considered as a collision candidate.
• Track selection: Tracks are required to have at least one hit in the pixel detector and at least six hits in the semiconductor tracker.
• Muon selection: The event must contain at least one pair of oppositely charged muon candidates as described above. The muons are not required to match the object(s) which fired the trigger.
In this analysis the muon parameters are taken from the ID measurement alone. Low pT muon measurements are dominated by the Inner Detector track reconstruction.
Muon pairs are considered to form aJ/ψ→µ+µ−candidate if:
• the pair of the muon candidate tracks fits successfully to a common vertex withχ2/d.o.f.<10;
• the highest-pT muon has apT of at least 4 GeV, and the other has apT of at least 2.5 GeV;
• their invariant mass (calculated from the track parameters refitted by the vertexing algorithm [7]
and under a muon mass hypothesis) lies within a±3σwindow of±180 MeV of their fitted mean, that is, in the mass range 2915 −3275 MeV. This cut is illustrated on Figure 1. A maximum likelihood method is used to fit the J/ψ mass. The signal is described using a Gaussian with per-candidate uncertainties and a linear background description: for details see [8].
(MeV)
µ-
µ+
m
2700 2800 2900 3000 3100 3200 3300 3400 3500
Entries / (20 MeV)
0 2000 4000 6000 8000 10000
(stat.) MeV
± 0.2 = 3095.6
ψ
mJ/
= 7 TeV s
L dt = 3.4 pb-1
∫
ATLAS Preliminary
Figure 1: J/ψ→µ+µ−candidates passing the cuts for theJ/ψselection. Those used in the the search for B±candidates are subject to a tighter mass window, as shown by the dotted vertical lines. The points are data. The solid line is the result of an unbinned maximum likelihood fit to all di-muon pairs in the mass window 2700−3500 MeV and the dashed line is the result for the background of the same fit. The signal is described using a Gaussian with per candidate uncertainties and the background is modelled with a linear description: for details see [8]. The given error on the fitted mass is statistical only.
A total of 75k J/ψcandidates fulfilling the above criteria are found in the preselected events.
Di-muon track pairs passing theJ/ψcandidate selection presented above are again fitted to a common vertex with an additional third track having pT greater than 2.5 GeV. The 3-track vertex fit is performed by constraining the muon tracks to theJ/ψworld average mass and assigning a kaon mass hypothesis to the third track. Fitted triplets are considered to be “loose”B±→J/ψK±decay candidates if:
• Theχ2/d.o.f. of the three-track vertex fit is less than 6;
• The overall pT of the three-track combination (calculated from the refitted parameters) is greater than 10 GeV.
A total of 13k candidates fulfilling the above criteria are found in a wide mass range 4000−7000 MeV.
Figure 2 shows the invariant mass distribution of these “loose” J/ψK±candidates, separated by charge.
(MeV)
ψK
mJ/
4000 4500 5000 5500 6000 6500 7000
Entries / (30 MeV)
0 20 40 60 80 100 120 140 160 180 200 220
No vertex displacement cut applied
= 7 TeV s
L dt = 3.4 pb-1
∫
)K+
µ-
µ+
ψ( J/
)K-
µ-
µ+
ψ( J/
ATLASPreliminary
Figure 2: Invariant mass distributions of reconstructed J/ψK+ (solid circles) and J/ψK− candidates (triangles) in mass range 4000−7000 MeV passing the selection criteria described in Section 5.
6 Fit to invariant mass distribution
An unbinned maximum-likelihood fit is used to extract the B±mass and the number ofB±signal candi- dates from the data. The likelihood function is defined by:
L=
N
Y
i=1
Fsignal(miJ/ψK)+Fbkg(miJ/ψK) (1)
where N is the total number of J/ψK± candidates in the invariant mass range mmin < mJ/ψK < mmax, withmmin = 5000 MeV andmmax = 5600 MeV. TheFsignal and Fbkg are probability density functions that model theB±signal and background mass shapes in this range. For the signal, the mass is modelled
with a Gaussian distribution:
Fsignal(mJ/ψK)≡ fsig
√ 1
2πSδmJ/ψK
e
−(mJ/ψK−mB±)2 2(SδmJ/ψK)2
(2) whose mean valuemB±is the hypothesisedB±mass, and its width is a productS·δmJ/ψK. The mass error δmJ/ψK is calculated for each J/ψK±candidate from the covariance matrix associated with the 3-track vertex fit and fsig represents the signal fraction. The scale factor S accounts for differences between the per-event errors on the candidate masses (calculated from tracking parameters) and the overall mass resolution. Ideally the value of this parameter is 1. For the background, the mass distribution is modelled with a linear function:
Fbkg(mJ/ψK)≡ 1− fsig
mmax−mmin
h1+b
mJ/ψK−mCi
(3) wherebis the slope of the linear background andmC ≡(mmax+mmin)/2.
On account of partially reconstructed B mesons and kinematic reflections, no attempt is made to model the background far from the B± mass region. In the mass region 5000−5600 MeV a linear approximation of the background is adequate within available statistics.
The fit has four free parameters: fsig,mB±,S andb. Their values and covariance matrix returned by the fit are used to calculate the number ofB±signal decaysNsig, the mass resolutionσmand the number of background eventsNbkgin the mass intervalmB±±3σm. The mass resolutionσmis defined as the half of width of theB±mass distribution for which the integral ofFsignalretains 68.3% ofNsigsymmetrically around the fitted massmB±. The uncertainty ofσm is calculated using the covariance matrix of the fit.
The number of background events Nbkgin the mass intervalmB±±3σmand its error is calculated from fsig,b,Nand the error matrix of the fit.
The same fit procedure is applied to the MC events assumingFbkg ≡0 in equation 1.
7 Results
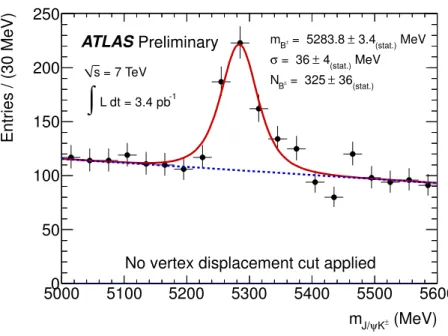
Figure 3 shows the invariant mass distribution for the loose J/ψK±candidates, in a restricted mass range from 5000 to 5600 MeV. The fit is applied as described in the previous section. TheB±mass returned by the fit is 5283.8±3.4 MeV, which is consistent with the world average of 5279.17±0.29 MeV [1]. The B±signal extracted from the fit is 325±36 and the background is 756±87. The signal mass resolution σmis 36±4 MeV; the equivalent for Monte Carlo is 39.6±0.2 MeV.
To improve the signal-to-background ratio, the displaced decay vertex of the B± is exploited by cutting on the transverse decay length of the B±, which is defined as the signed projection of the flight distance~Lof theB±on its transverse momentum direction ~pBT:
Lxy≡~L·~pTB/|~pTB|
where~Lis the vector from the primary vertex to theB±decay vertex.
Proton bunch crossings in the LHC may contain several reconstructed primary vertices corresponding to multiple ppcollisions. If the event contains two or more such primary vertices, one must be picked for theLxymeasurement:
• If both of the tracks from the J/ψcandidate decay were used (amongst others) to reconstruct the sameprimary vertex, then this primary vertex is used for theLxymeasurement.
• If neither of the tracks participated in the reconstruction of a primary vertex, then the primary P 2
(MeV)
K±
ψ
mJ/
5000 5100 5200 5300 5400 5500 5600
Entries / (30 MeV)
0 50 100 150 200 250
(stat.) MeV
± 3.4 = 5283.8
B±
m
(stat.) MeV
± 4 = 36 σ
(stat.)
± 36 = 325
B±
= 7 TeV N s
L dt = 3.4 pb-1
∫
No vertex displacement cut applied ATLASPreliminary
Figure 3: J/ψK± candidates in a narrow mass window (no distinction made between charges of the combinations). The solid line is the projection of the result of the unbinned maximum likelihood fit to all J/ψK±candidates in the mass range 5000−5600 MeV. The dashed line is the projection for the background component of the same fit.
• If one track participated in the reconstruction of a primary vertex, and the other did not, that primary vertex is used forLxy.
• If the two tracks from the J/ψcandidate decay participated in the reconstruction ofdifferentpri- mary vertices, the event is rejected, since studies have indicated that such candidates form only background and are unlikely to be trueJ/ψs. Fewer than 0.1% of the selected events have such an ambiguous J/ψcandidate.
In all cases, the primary vertex is refitted after removing the tracks of the J/ψK± system and the refitted vertex is used in the calculation ofLxy.
The condition Lxy > 300 µm is imposed on the data, reducing the background by a factor of 6.
With this requirement, about 13% of the signal is lost, in fair agreement with MC expectations for signal events. In the wide mass range 4000−7000 MeV, 3.8k candidates survive thisLxycut. Figure 4 shows the invariant mass distribution for all such candidates, with those containing a negative third track (B− candidates) plotted separately from theB+candidates.
Figure 5 shows the invariant mass distribution forB±candidates passing all the above selections in the reduced mass range 5000−5600 MeV. The result of the unbinned maximum likelihood fit is projected onto the distribution. TheB±mass returned by the fit is 5283.2±2.5 MeV, which is consistent with the world average value of 5279.17±0.29 MeV [1]. The number ofB±signal decays is 283±22 and the mass resolution of theB±signal is 39±3 MeV. The number of background candidates in the mass range mB±±3σm, is 131±13. All given errors are statistical.
In Figure 6, the invariant mass distributions are shown forB+and B−candidates separately. B+and B−candidates are fitted as described above. The numbers ofB+and B−signals and their reconstructed masses are equal within the statistical precision of current data. The mass resolution is the same forB+ and B−and agrees with the resolution expected from MC simulation.
(MeV)
ψK
mJ/
4000 4500 5000 5500 6000 6500 7000
Entries / (30 MeV)
0 20 40 60 80 100
= 7 TeV s
L dt = 3.4 pb-1
∫
µm > 300 Lxy
)K+
µ-
µ+
ψ( J/
)K-
µ-
µ+
ψ( J/
ATLAS Preliminary
Figure 4: Invariant mass distributions of reconstructed J/ψK+ (solid circles) and J/ψK− candidates (triangles) in mass range 4000− 7000 MeV passing the selection criteria described in Section 5 after requiring a displaced vertex withLxy>300µm as described in Section 7.
(MeV)
K±
ψ
mJ/
5000 5100 5200 5300 5400 5500 5600
Entries / (30 MeV)
0 20 40 60 80 100
120 ± = 5283.2 ± 2.5(stat.) MeV
mB
(stat.) MeV
± 3 = 39 σ
(stat.)
± 22 = 283
B±
= 7 TeV N s
L dt = 3.4 pb-1
∫
µm > 300 Lxy
ATLASPreliminary
Figure 5: Invariant mass distribution of reconstructed B± → J/ψ K±candidates. The points with error bars are data. The solid line is the projection of the result of the unbinned maximum likelihood fit to all J/ψK± candidates in the mass range 5000− 5600 MeV. The dashed line is the projection for the background component of the same fit.
The scale factors S for both B+and B− signals are consistent with each other as well as with the value obtained from MC events. The results of the fits to data and MC simulation are summarized in Table 1.
(MeV)
K+
ψ
mJ/
5000 5100 5200 5300 5400 5500 5600
Entries / (30 MeV)
0 10 20 30 40 50 60 70
(stat.) MeV
± 3.6 = 5282.6
B+
m
(stat.) MeV
± 4 = 40 σ
(stat.)
± 15 = 138
B+
= 7 TeV N s
L dt = 3.4 pb-1
∫
Lxy > 300 µmATLASPreliminary
(MeV)
K-
ψ
mJ/
5000 5100 5200 5300 5400 5500 5600
Entries / (30 MeV)
0 10 20 30 40 50 60 70
(stat.) MeV
± 3.3 = 5283.7
B-
m
(stat.) MeV
± 4 = 39 σ
(stat.)
± 15 = 146
B-
= 7 TeV N s
L dt = 3.4 pb-1
∫
Lxy > 300 µmATLASPreliminary
Figure 6: Invariant mass distributions of reconstructedB+→J/ψK+(top) andB−→J/ψK−candidates (bottom). The points with error bars are data. The solid line is the projection of the result of the unbinned maximum likelihood fit to all J/ψK+and J/ψK−candidates in the mass range 5000−5600 MeV. The dashed line is the projection for the background component of the same fit.
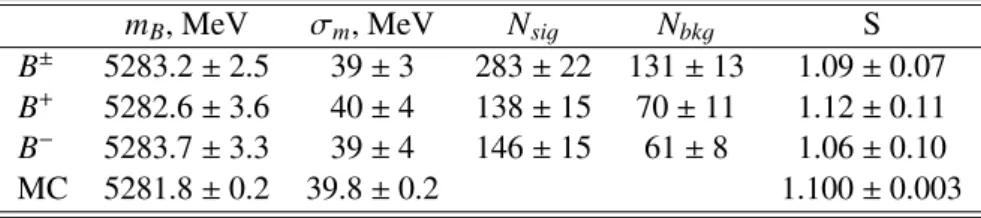
Table 1: Summary of fit results to mass distributions ofB±,B+,B−candidates. The number of background events is given in the rangemB±3σm. The same fit is applied to signal MC assumingFbkg ≡ 0 in equation 1. Errors indicated are statistical only.
mB, MeV σm, MeV Nsig Nbkg S
B± 5283.2±2.5 39±3 283±22 131±13 1.09±0.07 B+ 5282.6±3.6 40±4 138±15 70±11 1.12±0.11 B− 5283.7±3.3 39±4 146±15 61±8 1.06±0.10
MC 5281.8±0.2 39.8±0.2 1.100±0.003
8 Conclusion
The B± meson is clearly observed by ATLAS in the decay B± → J/ψ µ+µ−
K±. Using 3.4 pb−1 of ppcollision data at 7 TeV, the fit to the peak yields a central value of 5283.2±2.5(stat.) MeV, which is compatible with the world average of 5279.17 ±0.29 MeV [1]. After all cuts, the total number of observed signal events is 283±22(stat.)over a background of 131±13(stat.).
References
[1] K. Nakamura et al. J. Phys. G37(2010) 075021.
[2] T. Sjostrand, S. Mrenna, and P. Z. Skands,PYTHIA 6.4 Physics and Manual, JHEP05(2006) 026, arXiv:hep-ph/0603175.
[3] ATLAS Collaboration,ATLAS Monte Carlo tunes for MC09, ATLAS Note ATL-PHYS-PUB-2010-002(2010) .
[4] S. Agostinelli et al.,Geant4: A simulation toolkit, Nucl. Instrum. Meth. A506 no. 3(2003) 250 – 303.
[5] ATLAS Collaboration, G. Aad et al.,The ATLAS Experiment at the CERN Large Hadron Collider, JINST3(2008) S08003.
[6] ATLAS Collaboration,Luminosity determination using the ATLAS Detector, ATLAS Note ATLAS-CONF-2010-060(2010) .
[7] ATLAS Collaboration,VKalVrt - package for vertex reconstruction in ATLAS, ATLAS Note ATL-PHYS-2003-031(2003) .
[8] ATLAS Collaboration,First observation of the J/ψ→µµresonance, ATLAS Note ATLAS-CONF-2010-045(2010) .