29th International Cosmic Ray Conference Pune (2005)00, 101–106
Search for Gamma Rays from the Galactic Center with the MAGIC Telescope
H. Bartko , A. Biland, E. Bisesi, S. Commichau, P. Flix, E. Lorenz , M. Mariotti, R. Mirzoyan , V. Scalzotto, S. Stark, W. Wittek for the MAGIC collaboration
(a) Max-Planck-Institute for Physics, Munich Germany (b) ETH Zurich, Switzerland
(c) University of Udine and INFN Trieste, Italy
(d) Institut de Fisica d Altes Energies, Edifici Cn Universitat Autonoma de Barcelona, Bellaterra, Spain (e) University and INFN Padova, Italy
Presenter: H. Bartko (hbartko@mppmu.mpg.de), ger-bartko-H-abs2-og22-oral
The Galactic Center (GC) is a very interesting region for gamma ray astronomy. Various possibilities for the production of very high energy (VHE) gamma rays near the GC are discussed in the literature, like accretion flow onto the central black hole, supernova shocks in Sgr A East, proton acceleration near the event horizon of the black hole, or WIMP dark matter annihilation. At the Canary Island La Palma, the GC culminates at about 58 deg zenith angle (ZA). Between May and August it can be observed with the MAGIC telescope at up to 60 deg ZA. The large zenith angle leads to a good sensitivity for energies in the TeV range. The observation and analysis strategies are outlined and the status of the ongoing analysis is presented.
1. Introduction
The Galactic Center (GC) region contains many unusual objects which may be responsible for high-energy processes generating gamma rays [1, 2, 3]. The GC is rich in massive stellar clusters with up to 100 OB stars [4], immersed in a dense gas. There are young supernova remnants e.g. G0.570-0.018 or Sgr A East, and nonthermal radio arcs. The dynamical center of the Milky Way is associated with the compact radio source Sgr A , which is believed to be a massive black hole [4]. Within a radius of 300 pc around the Galactic Center there is a mass of about ¡ . Some data about the GC are summarized in Table 1.
(RA, dec), epoch J2000.0 Æ) heliocentric distance ¦kpc (1 deg = 140 pc)
mass of the black hole ¦¡
min. zenith angle at La Palma 58 deg Table 1.Properties of the Galactic Center.
EGRET has detected a strong source in the direction of the GC, 3 EG J1745-2852 [5], which has a broken power law spectrum extending up to at least 10 GeV, with a spectral index of 1.3 below the break at a few GeV.
Assuming a distance of 8.5 kpc, the gamma ray luminosity of this source is very large, ¡ , which is equivalent to about 10 times the gammaflux from the Crab nebula. An independent analysis of the EGRET data [6] indicates a point source whose position is different from the GC at a confidence level beyond 99.9 %.
At energies above 200 GeV, the GC has been observed by VERITAS, CANGAROO and HESS [7, 8, 9]. The spectra as measured by these experiments show substantial differences. This might be due to different inte- gration areas of the signal, a source variability at a time-scale of about one year or inter-calibration problems.
Due to the observations under large zenith angles MAGIC could extend the spectrum to higher energies. This is particularly interesting as a cut-off of the spectrum is expected in particle dark matter annihilation scenarios.
2 H. Bartko et al.
2. Observations
The Major Atmospheric Imaging Cherenkov telescope (MAGIC [13]) is the largest Imaging Air Cherenkov Telescope (IACT). Located on the Canary Island La Palma at 2200m a.s.l, the telescope has a 17m diameter high reflectivity tessellated parabolic mirror, mounted on a light weight carbonfiber frame. It is equipped with a high efficiency 576-pixel photomultiplier camera, whose analogue signals are transported via opticalfibers to the trigger electronics and the 300 MHz FADC readout. Its physics program comprises, among other topics, pulsars, supernova remnants, active galactic nuclei, micro-quasars, gamma-ray bursts and Dark Matter.
The GC culminates at about 58 deg ZA in La Palma. Below 60 deg ZA, it is visible between May and August for about 150 moon-less hours. The GC region has a quite high and non-uniform level of background light from the night sky. This together with the large ZA requires either observations in the false-source tracking (wobble) mode [17] or to take dedicated OFF data.
Within a distance of 1Æfrom the GC there are no stars brighter than mag = 8.4, and there are 16 stars with mag. At distances between 1Æand 1.75Æfrom the GC the total number of stars withmagis 26.
The brightest ones are Sgr 3 (mag = 4.5), GSC 6836-0644 (mag = 6.4) and GSC 6839-0196 (mag = 7.2).
17:55:00
17:30:00
-25:00:00
-33:00:0014
13
1211
10
9
GC W1 W2
Off-GC δ
RA
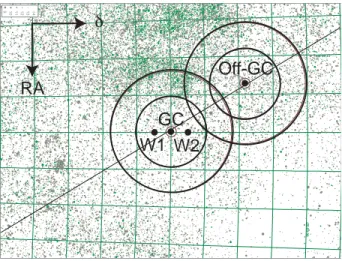
Figure 1. Starfield around the GC. Stars up to a magnitude of 14 are plotted. The 2 sets of big circles correspond to distances of 1Æand 1.75Æfrom the GC and OFF-GC, respectively. The wobble positions WGC1 and WGC2 are given by the full circles. The axis is pointing into the direction of decreasing RA, theaxis into the direction of increasing declination. The grid spacing in the declination is 1 degree.
The starfield around the GC is quite non-uniform. In the region RARAtime minthe starfield is brighter. The sky directions (WGC1, WGC2) to be tracked in the wobble mode are chosen such that in the camera the skyfield relative to the source position (GC) is similar to the skyfield relative to the mirror source position (anti-source position). For this reason the directions for the wobble mode are chosen as WGC1 = (RA, dec+0.4Æ) and WGC2 = (RA, dec-0.4Æ). During one wobble mode data taking, 50% of the data is taken at WGC1 and 50% at WGC2, switching between the 2 directions every 30 minutes.
An appropriate OFF region, with a skyfield similar to that of the ON region, is centered at the Galactic Plane and contains the bright star Sgr 3 (at (RA, dec) = Æ) ) in its outer part. The center of the OFF region has the coordinates GC= (RA, dec) = Æ. The difference in RA
Search for Gamma Rays from the Galactic Center with the MAGIC Telescope 3 between the GC and GCcorresponds to 1.5 degrees. In the same night OFF data is taken directly before or after the ON observations under the same conditions.
After initial observations in September 2004 the Galactic Center direction has been observed for a total of about 28 hours in May-June 2005. This time is split into 10 hours of wobble mode observations, and 9 hours of ON and 9 hours of OFF observations. The data are currently being analyzed.
3. Data Analysis
The observations of the Galactic Center are conducted under large ZA. This implies a higher energy threshold but also a larger effective collection area [14]. Thus the otherwise statistics limited high energy domain above 10 TeV could be accessible.
In our preliminary analysis we used the Random Forest method [12] for the gamma hadron separation. Each event is tagged with the parameter hadronness¾which is a measure for the probability to be a background event. The smaller the hadronness the higher the probability to be a gamma event and the larger the hadronnes the higher the chance to be a background event.
To train the Random Forest, high ZA (60Æ ZA) Monte Carlo (MC) gamma showers were generated with energies between 200 and 30,000 GeV. The differential spectral index of the generated spectrum is , conforming with the energy spectrum of the Crab nebula. The MC sample was divided into two sub-samples.
The Random Forest was trained with one sub-sample of the MC gammas and a sub-sample of the GC-OFF data which represents the background events. Thereafter the trained Forest was tested with the other MC sub- sample and a different sample of OFF data. As training parameters we used the Hillas parameters SIZE, DIST, WIDTH, LENGTH, CONC, and M3Long [16]. The training was done for SIZEphoto electrons.
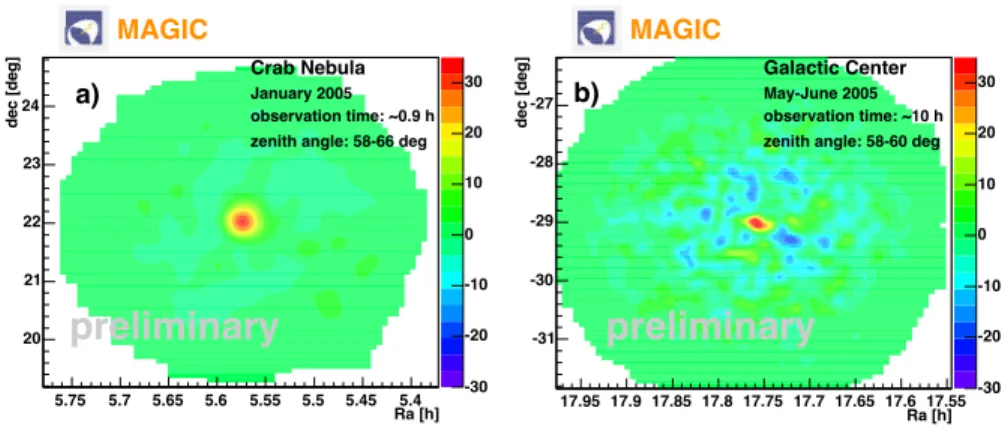
In order to develop and verify the MAGIC analysis at high zenith angles Crab data in the interesting ZA range around 60Æhave been taken in January 2005. The gamma energy spectrum of this data can be reconstructed and it is consitent with existing measurements. Figure 2a) shows a sky map of gamma ray candidate excess events from direction of the Crab nebula with a lower cut on SIZE of 600 photo electrons.
Ra [h]
dec [deg]
20 21 22 23 24
-30 -20 -10 0 10 20 30
5.4 5.45 5.5 5.55 5.6 5.65 5.7 5.75
preliminary
a)
Crab Nebula January 2005 observation time: ~0.9 h zenith angle: 58-66 deg
MAGIC
Ra [h]
dec [deg]
-31 -30 -29 -28 -27
-30 -20 -10 0 10 20 30
17.55 17.6 17.65 17.7 17.75 17.8 17.85 17.9 17.95
preliminary
b) Galactic Center
May-June 2005 observation time: ~10 h zenith angle: 58-60 deg
MAGIC
Figure 2.Sky maps of candidate gamma ray excess events in the directions of the Crab nebula (a) and the Galactic Center (b) with lower Size cuts of 600 photo electrons (corresponding to 2 TeV) and a hadronness .
Figure 2b) shows a sky map of gamma ray candidate excess events from the direction of the Galactic Center with a lower SIZE cut of 600 photo electrons and a hadronness. This size cut corresponds to an energy
4 H. Bartko et al.
threshold of about 2 TeV. Although not yet significant, the observed excess in the direction of the Galactic Center is compatible within errors with previous measurements [9, 7].
4. Discussion
The GC is an interesting target in all wavelength bands. First detections of the GC by the Veritas, Cangaroo and HESS collaborations were made. The measuredfluxes exhibit significant differences. These may be explained by calibration problems, by time variations of the source or by different integration areas due to different point spread functions. The nature of the source of the VHE gamma rays has not yet been identified.
Conventional acceleration mechanisms for the VHE gamma radiation utilize the accretion onto the black hole and the diffusive shock of supernova remnants. The GC is also expected to be the brightest source of VHE gammas from particle dark matter annihilation [10, 11, 15]. Most probably the main part of the observed gamma radiation is not due to dark matter annihilation [3]. Nevertheless it is interesting to investigate and characterize the observed gamma radiation as a contribution due to dark matter annihilation is not excluded.
Data taken by MAGIC will help to determine the nature of the source and to understand theflux discrepancies.
Due to the large zenith angles, MAGIC will have a large energy threshold but also a large collection area and good statistics at the highest energies. The measurements may also be used to inter-calibrate the different IACTs.
A. Acknowledgements
The authors thank A. Moralejo for helpful discussions about the Monte Carlo simulations. The project MAGIC is supported by MPG (Max-Planck-Society in Germany), and BMBF (Federal Ministry of Education and Re- search in Germany), INFN (Italy), IFAE (Spain) and IAC (Instituto de Astrophysica de Canarias).
References
[1] F. Aharonian and A. Neronov, ApJ619(2005) 306.
[2] A. Atoyan and C. D. Dermer, ApJ617(2004) L123.
[3] D. Horns, Phys. Lett.B607(2005) 225, astro-ph/0408192.
[4] M. Morris and E. Serabyn, ARAA34(1996) 645.
[5] H. A. Mayer-Hasselwander et al., A&A335(1998) 161.
[6] D. Hooper and B. Dingus, (2002), astro-ph/0212509.
[7] K. Kosack et al., ApJ608(2004) L97.
[8] K. Tsuchiya et al., ApJ606(2004) L115.
[9] F. Aharonian et al., A&A425(2004) L13.
[10] F. Prada et al., Phys. Rev. L.93(2004) 241301.
[11] D. Hooper et al., JCAPP9(2004) 2.
[12] R. K. Bock et al., Nucl. Instrum. Meth.A516(2004) 511.
[13] C. Baixeras et al. (MAGIC Collab.), Nucl. Instrum. Meth.A518(2004) 188.
[14] A. Konopelko et al. J. Phys.G25(1999) 1989.
[15] H. Bartko et al. (MAGIC Dark Matter Working Group), these proceedings.
[16] A. M. Hillas, inProceedings of the 19th ICRC, La Jolla, 1985.
[17] V. P. Fomin et al. Astropart. Phys.2(1994) 137.