30
THI
NTERNATIONALC
OSMICR
AYC
ONFERENCEDetection of Very High Energy Gamma-Rays from the BL Lac Object 1ES 2344+514 in a Low Emission State with the MAGIC Telescope
R
OBERTW
AGNER1ANDM
ARKUSM
EYER2FOR THEMAGIC
COLLABORATION 1Max-Planck-Institut f¨ur Physik, D-80805 M¨unchen, Germany
2
Universit¨at W¨urzburg, Am Hubland, D-97074 W¨urzburg, Germany robert.wagner@mppmu.mpg.de
Abstract: The MAGIC telescope has observed very-high energy gamma-ray emission from the AGN 1ES 2344+514. A gamma-ray signal corresponding to an 11 sigma excess and an integral flux of (2.38 ± 0.30
stat± 0.70
syst) × 10
−11cm
−2s
−1above 200 GeV has been obtained from 23.1 observing hours between August 2005 and January 2006. The observations show a relatively steep differential photon spectrum (α = −2.95±0.12
stat±0.20
syst) between 140 GeV and 5.4 TeV. No significant time variability has been observed.
Introduction
In the past, most of the very-high energy (VHE) γ-ray emitting active galactic nuclei (AGN) were discovered during phases of high activity. It still remains an open question whether these are only temporarily active and are completely inactive be- tween times of flaring, or if there exists a state of low but continuous γ-ray emission. The temporal and spectral properties of such a low emission state are still mostly elusive.
During the winter of 1995/6, the Whipple collab- oration observed a 5.8σ excess signal from the BL Lac-type AGN 1ES 2344+514. The measured flux was highly variable, with the most significant signal occurring during a single flare, while the re- maining data combined led to an only marginal ex- cess [1]. A deep 72.5h HEGRA exposure from 1997 to 2002 indicated a signal at a significance level of 4.4σ [2].
Here we present MAGIC observations of 1ES 2344+514. We infer an E > 200 GeV light curve and derive a γ-ray spectrum. We compare our measurements with with the all-time (1995-2005) VHE light curve. Further, SSC modeling is performed employing wide-range spectral energy distribution (SED) data.
Observations
The observations were performed between August 2005 and January 2006 with the MAGIC telescope [3]. Its essential parameters are a 17 m diameter mirror of parabolic shape and a ≈ 3.5
◦diame- ter field of view PMT camera. 1ES 2344+514 was observed for 32 hours in total under zenith angles from 23
◦to 38
◦. The observations were carried out in wobble mode, i.e. by alternatingly tracking two positions at 0.4
◦offset from the camera center. The KVA optical telescope conducted simultaneous R- band observations.
Data Analysis
The data analysis was carried out using the stan-
dard MAGIC analysis software [4] and is described
in detail elsewhere [5]. After data quality cuts, 23.1
h worth of data remained, for which image param-
eters were calculated [6]. These were subjected to
a γ/hadron separation based on the Random For-
est (RF) method [7]. The arrival directions of the
showers in equatorial coordinates were calculated
using the DISP method [8]. The energy of the pri-
mary γ-rays was reconstructed from the image pa-
rameters again using a RF method and taking into
account the full instrumental energy resolution.
D
ETECTION OFVHE G
AMMA-R
AYS FROM1ES2344+514
]°Dec [
50.8 51 51.2 51.4 51.6 51.8 52 52.2 52.4 52.6
-100 0 100 200 300 400 500 600
RA [h] 23.75 23.7 23.8
23.85
PSF
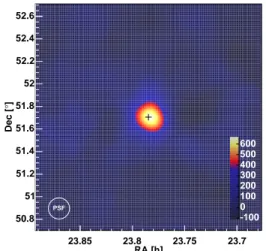
Figure 1: Smoothed excess event map for E
γ>
180 GeV. The number of excess events is given in units of 10
−5sr
−1. Black cross: expected source position.
Figure 2: θ
2plot for E
γ> 180 GeV. Heavy crosses: On-events, small crosses: Off-source background.
Fig. 1 shows a sky map around the 1ES 2344+514 position. A clear point-like γ-ray excess is visible in the data, the maximum of which is within errors coincident with the location of 1ES 2344+514. To calculate the significance of the observed excess, the squared angular distance θ
2between the recon- structed shower direction and the object position as shown in Fig. 2 is used. The observed excess signal of 528 events below θ
2< 0.04 deg
2corre- sponds to a significance of 11σ according to eq. 17 in [9].
E [GeV]
200 300 400 500 1000 2000 3000
]-1 s-2 cm-1dN/dE [TeV
10-17 10-16 10-15 10-14 10-13 10-12 10-11 10-10 10-9 10-8
1ES 2344+514
±0.20
±0.12 -2.95
500 GeV E
2 s TeV cm
10-11
×
±0.5)
±0.1 = (1.2 dE dN
0.14 0.10 0.08 0.06 0.05 0.04 0.03 0.03
MAGIC 2005 Whipple 1995/12/20 Crab nebula
Figure 4: Differential photon spectrum for 1ES 2344+514. The gray band represents system- atic errors coming from varying the γ efficiency in the determination of the spectrum.
The ≥ 200 GeV light curve (Fig. 3) shows small changes and trends beyond those expected from statistical fluctuations. The structure observed during MJD 53580−53600 is compatible with a constant-flux ansatz (χ
2/dof= 6.1/6), while from MJD 53726.82−53726.90 a flux of 2.4σ above the average flux inferred from the surrounding days MJD 53720−53740, (1.8 ± 0.6) · 10
−11cm
−2s
−1(χ
2/dof=4.9/7), was found. The average flux F(E > 200GeV) = (2.38 ±0.30
stat±0.70
syst)×
10
−11cm
−2s
−1corresponds to (10 ± 1)% of the Crab nebula flux in the same energy range. While previous VHE observations of 1ES 2344+514 did not allow short-term studies of temporal charac- teristics, with MAGIC, this level can now be de- tected with only a few hours of observations, en- abling studies of the VHE γ-ray variability proper- ties of this object over a significant part of its dy- namical range. Thus, 1ES 2344+514 adds to the small group of blazars for which such studies are now possible on a diurnal basis—Mkn 421, Mkn 501 and PKS 2155-304.
The reconstructed spectrum after unfolding [10]
(Fig. 4) can be fitted with a simple power law be- tween 140 GeV and 5.4 TeV (χ
2ν/dof=8.56/5) as
dN
dE = (1.2 ± 0.1
stat± 0.5
syst) · 10
−11TeV cm
2s
× E
500 GeV
−2.95±0.12stat±0.2syst
.
30
THI
NTERNATIONALC
OSMICR
AYC
ONFERENCE ]-1 s-2 [cmγF0 0.1 0.2 0.3 0.4 0.5 0.6 0.7 0.8
10-10
×
Crab units
0 0.05 0.1 0.15 0.2 0.25 0.3
MJD
53580 53600 53620 53640 53660 53680 53700 53720 53740
Figure 3: E > 200 GeV light curve. Dashed line: average flux level of (2.38 ± 0.30) × 10
−11cm
−2s
−1(χ
2red= 21.2/20).
Long-term VHE Light Curve
The VHE light curve in Fig. 5 was obtaind by nor- malizing all known data to an integral flux F(E >
350 GeV). The fluxes given in the literature were extrapolated, where necessary, using the spectral index found in this paper. All reported observa- tions with significances below 2.0σ (≈95% proba- bility) were converted to 99% upper flux limits.
In 1995/6, Whipple discovered 1ES 2344+514 at a flux level of (0.11 ± 0.05) Crab units at E >
350 GeV, except for the December 1995 flare, when (0.63 ± 0.15) Crab units were obtained [16].
Follow-up observations by Whipple and HEGRA in 1996-8 yielded upper limits of 0.08 Crab units and 0.12 Crab units, respectively. In 1998 and 2002, the object was observed for almost 60 h by HEGRA resulting, when combined, in a flux of (0.042 ± 0.012) Crab units at E > 930 GeV [18], which translates to (0.053±0.015) Crab units when extrapolating to E ≥ 350 GeV. From ob- servations of 1ES 2344+514 in 2002, the Whipple group could infer a low flux level of < 0.03 Crab units with a marginal significance of 3.1σ [17] at E > 400 GeV.
While the Whipple and HEGRA measurements allowed to conclude on an emission level of
≤ 11% Crab units only after long observation times, the MAGIC observations are the first time- resolved measurements at this emission level for 1ES 2344+514. We find the flux of 1ES 2344+514 to be (0.054 ±0.006) Crab units for E > 350 GeV, which is well in line with the HEGRA 1997-2002 evidence.
Intrinsic Energy Spectrum
Having to traverse a cosmological distance (z = 0.044), the γ-rays emitted by 1ES 2344+514 inter- act with EBL photons [11]. We use the “best-fit”
EBL model of [12] to calculate the optical depth τ
γγ. With it, the intrinsic source spectrum is deter- mined. It can be described by a simple power law of the form
dN
dE
intr= (2.1 ± 1.2
stat± 0.5
syst) · 10
−11TeV cm
2s
× E
500 GeV
−2.66±0.50stat±0.20syst
between 140 GeV and 5.4 TeV (χ
2ν= 0.68/5).
The spectrum shows a tendency to flatten towards low energies. A fit with a logarithmic curvature term [13] shows a clear curvature and enables lo- cating a spectral peak at E
peak= (202±174) GeV.
Spectral Energy Distribution
The SED for 1ES 2344+514 is shown in Fig. 6 along with a homogeneous one-zone SSC model fit [14] to the Whipple flare and the MAGIC data (in- trinsic spectra are indicated by the dashed curves).
BS96 and BS98 represent two BeppoSAX data sets
taken during a quiescent state and simultaneously
with Whipple observations, respectively. Optical
KVA data and the RXTE-ASM upper limit were
taken simultaneously with the MAGIC data. The
dotted curve was fitted to the BS96/Wh96 obser-
vation. For references and model parameters see
D
ETECTION OFVHE G
AMMA-R
AYS FROM1ES2344+514
Time [MJD]
50000 50500 51000 51500 52000 52500 53000 53500
Time [MJD]
50000 50500 51000 51500 52000 52500 53000 53500
ray rate [Crab units]γ
0.02 0.04 0.06 0.08 0.1 0.12 0.14
1996 1997 1998 1999 2000 2002 2005
Crab units for F(E>350 GeV) Whipple (Catanese et al. 1998) HEGRA (Tluczykont 2003) Whipple (Badran & Weekes 2001) MAGIC (this work)

![Figure 5: Overall VHE light curve for 1ES 2344+514 [16, 17, 2]. The 1995 December 20 flare has been excluded for clarity.](https://thumb-eu.123doks.com/thumbv2/1library_info/4006880.1540928/4.892.174.602.159.262/figure-overall-light-curve-december-flare-excluded-clarity.webp)
