Recent Results from the MAGIC Telescope
Rudolf K. Bock, for the MAGIC collaboration
Max-Planck Institute fuer Physik, München
Abstract. Some recent results are shown, obtained during the commissioning period
of the MAGIC telescope. They demonstrate that the telescope is now approaching a performance level suitable for physics observations.
THE MAGIC TELESCOPE AND ITS COMMISSIONING
The MAGIC telescope has been under construction since 2001. With a mirror area of 239 m
2, MAGIC is the largest gamma ray telescope presently in existence. It is situated on the Canary island of La Palma, at 28
oN and 17
oW, at an altitude of more than 2200 m above sea level. Technical details of MAGIC and its status are given in the Design Report and in a separate contribution [1], [2].
FIGURE 1. The position of MAGIC as part of the observation site of the Roque de los Muchachos, which includes multiple optical telescopes. The inset shows a blowup of MAGIC.
Some parameters relevant for MAGIC's data taking are: field of view 3.5
o, typical trigger rate ~ 200 – 300 Hz at the current trigger threshold ~ 50 GeV, data volume ~ 2.0 GB/hour. Since late 2003, MAGIC has been in a commissioning phase, during which there was increasingly room for interspersed physics observations. Feedback from these observations and from technical runs was used for continuous hardware improvement, making necessary multiple adaptations in the analysis software. The very first signals from MAGIC were presented in February 2004 [3]. Observations were made in a very conventional style, trying to have equal times for on-source and off-source observations, as shown in table 1.
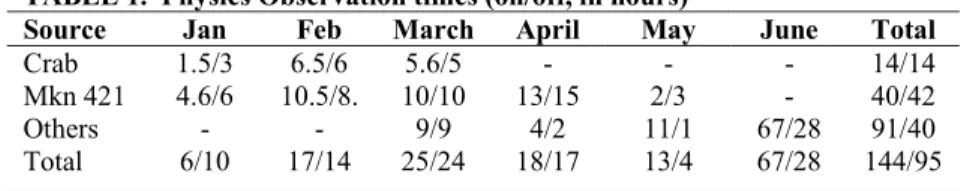
TABLE 1. Physics Observation times (on/off, in hours)
Source Jan Feb March April May June Total
Crab 1.5/3 6.5/6 5.6/5 - - - 14/14
Mkn 421 4.6/6 10.5/8. 10/10 13/15 2/3 - 40/42
Others - - 9/9 4/2 11/1 67/28 91/40
Total 6/10 17/14 25/24 18/17 13/4 67/28 144/95
SOME RECENT RESULTS
In this presentation, we show preliminary results using data from Feb-April 2004, on the sources Crab and Mkn 421. Our analysis follows the classical path, for which Whipple paved the way [4], [5]; the method obtains, for each event, a ‘cleaned’ image, discarding pixels that have no significant signal. Subsequently, the relevant
information is extracted from the image by computing few image parameters, mostly obtained by a principal component analysis. Using on-source and off-source data as input, simple optimized cuts in the image parameter space are used to enhance the difference between on-source and off-source data. Optimization is done on a training sample, and cross-checked on the remainder of the events. In all cases, we found the results for training and test samples fully equivalent. The angle parameter alpha which describes the orientation of the image with respect to the camera center is the one that best shows the difference between on- and off-source data; alpha is not used in the optimization, and this independent parameter defines the signal in the figures below.
The method is known to be robust for high-energy events. MAGIC works on multiple variants of the analysis, particularly with lower energies in mind.
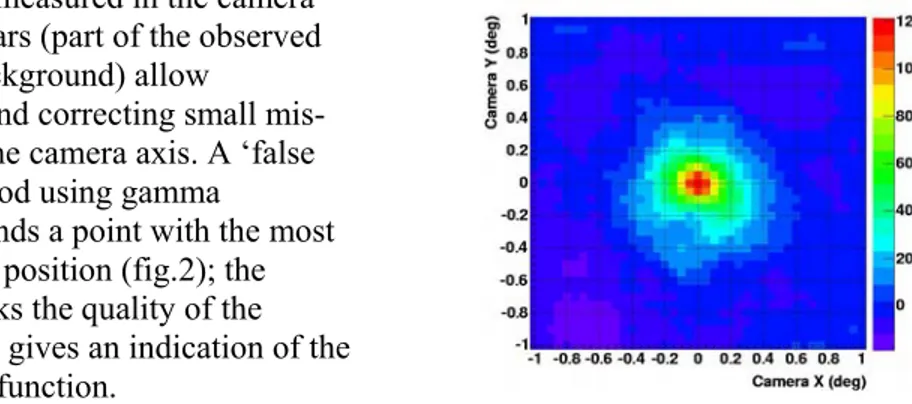
DC currents measured in the camera for known stars (part of the observed night sky background) allow
monitoring and correcting small mis- pointing of the camera axis. A ‘false source’ method using gamma
candidates finds a point with the most likely source position (fig.2); the method checks the quality of the pointing, and gives an indication of the point spread function.
FIGURE 2. Significance map for Crab observations, using the ‘false source’ method. The maximum significance and number of excesses is obtained for the camera center, within the binning precision of
~0.05o.
An alpha plot obtained in one night of Crab observation (March 2004) is shown in figure 3. The data were selected with the condition (see below) size > 2000 photons. The signal is evident, the significance per hour is 8.5σ.
FIGURE 3. Histogram of alpha for on- (black points) and off-source (red points) observations on the Crab nebula. The lines show a second-order fit for off-source (with the constraint of zero derivative at alpha = 0), and the same with a superimposed Gaussian for on-source data. The backgrounds in the domain alpha > 30o agree well between on- and off-source observations.
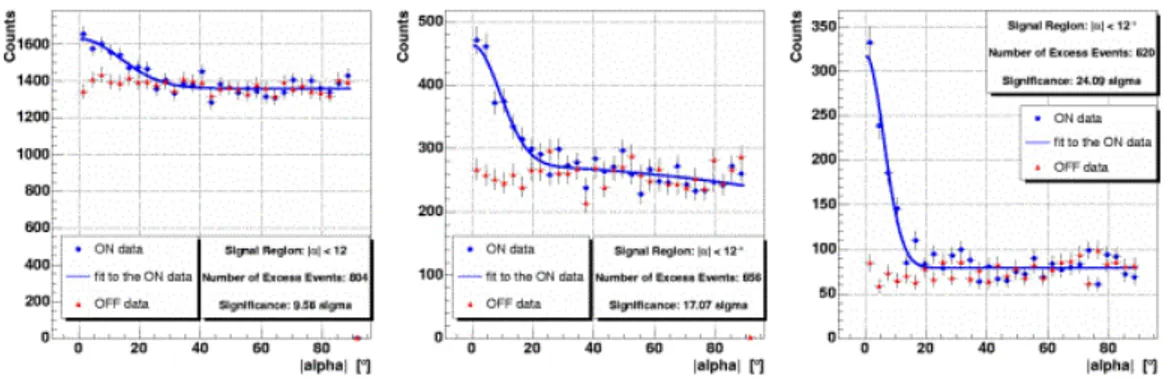
Figure 4 shows alpha plots obtained from observations of the source Mkn 421, then in a period of strong flaring. The data were subdivided into bins of the variable size, the total sum of photons in the cluster of pixels retained for analysis. Gamma energy and size are strongly correlated (see also fig.5). Three bins in the variable size were analyzed; the energy distributions of Monte Carlo data for the three bins (treated with the same program as the data) peak at 75, 102, and 160 GeV, respectively. One notes that at lower energies, the signal-to-background ratio decreases and the width of the
alpha distribution increases.FIGURE 4. Histogram of alpha for on- and off-source observations, in three bins of total photon count (parameter size): 800 – 1200 (left), 1200 – 2000 (middle) and 2000 - 4000 photons (right). Data are from 155 minutes on 22 April 2004, taken at zenith angles from 10 to 43 deg.
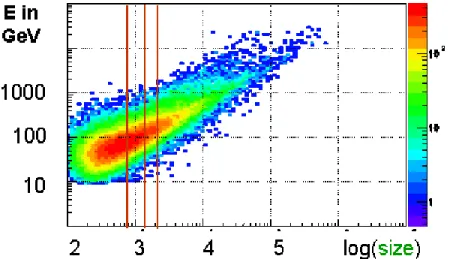
The parameter size (the total sum of photons in the cluster of pixels retained for
analysis) and the gamma energy are related statistically. The relation can be obtained
from analyzing Monte Carlo data. Figure 5 shows this relation, for the operating
conditions in April 2004. Note that an improved focusing (achieved already at time of
writing) will result in more events recorded at lower energy, and noticeably lower energy values and improved background rejection for the lower energy bins in size.
FIGURE 5. The statistical relation between the variable size (in photons) and gamma energy, as obtained from Monte Carlo events. The bin limits used in size for figure 4 are shown. Events with size
< 800 photons were not analyzed for the moment.
Toward Lower Energies
As is apparent from figure 4 above, extracting the gamma signal becomes ostensibly more difficult as one goes down in energy. The reasons are not difficult to understand:
low-energy showers are made of fewer and more dispersed particles than showers at higher energies (see fig.6). The geomagnetic field will aggravate the difficulties, depending on the incident direction. Conventional wisdom for the analysis may well not be good enough for extracting the best information for events below ~100 GeV.
FIGURE 6. The pool of Cherenkov photons created by simulated gammas (at telescope level), for showers of vertical incidence. Two left images: showers of 5 GeV. Rightmost: a shower of 100 GeV.
The area shown is 400 m x 400 m.
The MAGIC collaboration has several activities targeting specifically the sector of low-energy shower analysis. They explore the effect of using
- the signal arrival time in the analysis
- additional new parameters, e.g. describing dispersion (‘lumpiness’)
- more enhanced statistical methods in n-parameter space, e.g. Random Forest or artificial neural networks
- non-parametric methods
Some improvements have presently been obtained from this work. Arrival times can be extracted, and at least one method (Random Forest) of using the image parameter space in a more robust way than simple low/high cuts with energy dependence (‘supercuts’) has been in use successfully. We are confident that the low-energy capabilities of MAGIC will bear fruit on a medium-to-long time scale.
CONCLUSIONS
•
Several sources have been observed, preliminary results for the Crab nebula and for the AGN Mkn 421 (flaring) have been shown. More results are in the pipeline.
•
MAGIC has been in an operating and commissioning state since late 2003. The results shown demonstrate that the telescope can extract significant signals, and is now close to allow extracting physics.
•
The possibilities of MAGIC at low energy are becoming apparent; the analysis of low-energy events will be challenging and possibly require long-term work;
this is new territory for the community.
ACKNOWLEDGMENTS
The author is grateful to the many members of the MAGIC collaboration who have built up the analysis and provided the results.
REFERENCES
1. The MAGIC Telescope, Design Report, MPI-PhE/98-5 (March 1998)
2. Lorenz, E., “The MAGIC Telescope, Status and Future Plans”, these proceedings.
3. Schweizer T., et al., “Status report of the MAGIC telescope”, Contribution DPG Spring meeting (German Physical Society), Mainz (March 2004)
4. Hillas, A.M., Proc. 19th Int. Cosmic Ray Conf., La Jolla (1985) 5. Fegan, D.J., J.Phys.G: Nucl.Part.Phys. 23 (1997) 1013