29th International Cosmic Ray Conference Pune (2005) 00, 101–106
Monte Carlo simulation for the MAGIC telescope
P. Majumdar
a, A. Moralejo
b, C. Bigongiari
b, O. Blanch
, D. Sobczynska
don behalf of the MAGIC collaboration
(a) Max Planck Institut f¨ur Physik, Munich (Germany)
(b) Department of Physics and INFN, University of Padua (Italy) (c) Institut de F´ısica d’altes energies, Barcelona (Spain)
(d) Division of Experimental Physics, University of Lodz (Poland)
Presenter: P. Majumdar (pratik@mppmu.mpg.de), ger-majumdar-P-abs1-og27-oral
The operation of ground based Imaging Cherenkov telescopes requires a detailed Monte Carlo (MC) simulation of ray and hadron initiated air showers, as well as of the detector response to them. An overview of the MAGIC telescope MC simulation is presented, showing comparisons between the features of the simulated showers and those of real data taken during the first year of operation.
1. Introduction
The Monte Carlo simulation for the MAGIC telescope is divided into three stages. The development ofand hadron-initiated air showers is simulated with CORSIKA 6.019 [1], using VENUS for hadronic interactions and the US standard atmosphere. Cherenkov photons arriving around the telescope location are stored in binary files containing all the relevant parameters (including wavelength). The second stage of the simulation, the so called Reflector program, accounts for the Cherenkov light absorption and scattering in the atmosphere (using the US standard atmosphere to compute the Rayleigh scattering plus the Elterman model [2, 3] for the distribution of aerosols and ozone), and then performs the reflection of the surviving photons on the mirror dish (composed of 964 tiles) to obtain their location and arrival time on the camera plane. Finally, the camera program simulates the behaviour of the MAGIC photomultiplier camera, trigger system and data acquisition electronics. Realistic pulse shapes, noise levels and gain fluctuations obtained from the real MAGIC data have been implemented in the simulation. The overall light collection efficiency of the telescope has been tuned at the camera simulation level, using data from the comparison of the intensity of observed and simulated ring images from single muons at low impact parameters [4], resulting in an effective aperture of around 26 m2. For the present study a total of 2.6107protons and 1.3107Helium nuclei between 30 GeV and 30 TeV, have been produced, as well as 7.8106gammas between 10 GeV and 30 TeV. The energy distribution of primaryrays is a pure power law with index -2.6, whereas charged primaries follow the known cosmic ray spectra [5, 6]. The telescope pointing directions range from 0 to'30Æin zenith angle(flatly distributed in
os), with the directions of protons and Helium nuclei scattered isotropically within a5Æsemiaperture cone around the telescope axis. Gammas were simulated as coming from a point source0:4Æoff the center of the camera, in order to compare them to a special sample of real data taken in similar conditions. Maximum impact parameters of 300 and 400 m have been simulated for gammas and nuclei respectively.
2. Comparison of Monte Carlo events and real MAGIC data
The calibration and image reconstruction of both the Monte Carlo events and data have been done following standard procedures of MARS (Magic Analysis and Reconstruction Software [7]). Signal intensity in each pixel is obtained by interpolating the pulse in the FADC with a cubic spline which is then integrated in a range of 3.3 ns around the peak. Tail cuts select pixels with a signal of at least 7 photoelectrons above the pedestal (core pixels), and those with 5 or more photoelectrons which are neighbours to any of the former (this applies
2 P. Majumdar et al.
to the fine pixels within' 1Æ of the center of the camera; for the larger outer pixels, tail cuts were scaled up such that they correspond to the same light density as those for inner pixels). A classical (Hillas) image parametrization is then performed, including the moments up to third order of the photoelectron distribution on the camera.
Width (deg) 0.05 0.1 0.15 0.2 0.25 0.3
Rate (Hz)
1 2 3 4 5 6 7
Crosses: MC p+He, Solid Histogram: Off data
MAGIC Size 200 - 500 phe
Length (deg) 0.1 0.2 0.3 0.4 0.5 0.6 0.7 0.8
Rate (Hz)
0.5 1 1.5 2 2.5 3 3.5 4
Crosses: MC p+He, Solid Histogram: Off data
MAGIC Size 200 - 500 phe
Width (deg) 0 0.05 0.1 0.15 0.2 0.25 0.3 0.35 0.4 0.45 0.5
Rate (Hz)
0.2 0.4 0.6 0.8 1 1.2 1.4 1.6 1.8
Crosses: MC p+He, Solid Histogram: Off data
MAGIC Size > 500 phe
Length (deg) 0 0.1 0.2 0.3 0.4 0.5 0.6 0.7 0.8 0.9 1
Rate (Hz)
0.2 0.4 0.6 0.8 1 1.2 1.4 1.6 1.8
Crosses: MC p+He Solid Histogram: Off data
MAGIC Size > 500 phe
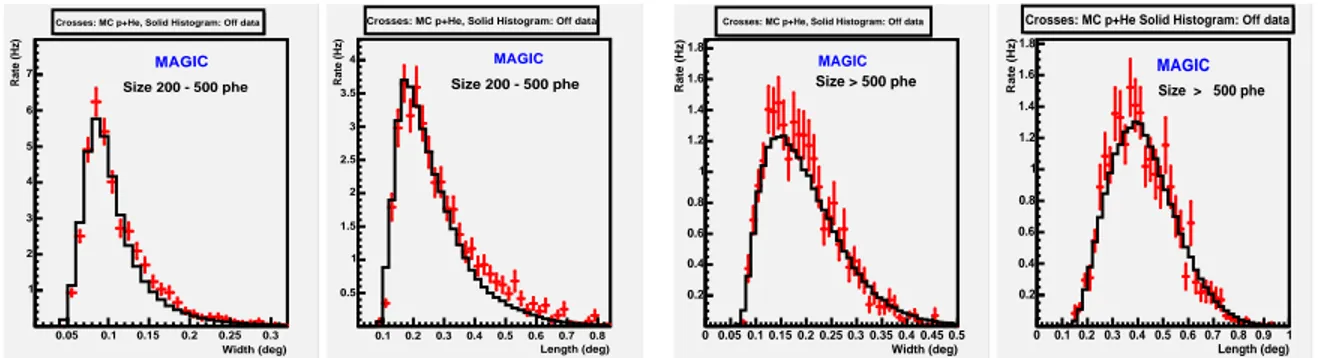
Figure 1. Distribution of Width and Length parameters for Monte Carlo hadrons (crosses) and real OFF data (solid line) for size bins 200 500 photoelectrons and>500 photoelectrons respectively.
°) LENGTH ( 0.1 0.2 0.3 0.4 0.5 0.6 0.7 0.8
Rate (Hz)
0 0.005 0.01 0.015 0.02
°) WIDTH (
0.05 0.1 0.15 0.2 0.25 0.3
Rate (Hz)
0 0.005 0.01 0.015 0.02 0.025
0.03 SIZE = 200 - 500 phe- MAGIC
gamma MC vs Crab gammas
°) WIDTH (
0 0.1 0.2 0.3 0.4 0.5
Rate (Hz)
0 0.005 0.01 0.015 0.02
MAGIC
SIZE > 500 phe- gamma MC vs Crab gammas
°) LENGTH (
0 0.2 0.4 0.6 0.8 1
Rate (Hz)
0 0.005 0.01 0.015
Figure 2. Distribution of the WIDTH and LENGTH parameters of shower images for Monte Carlo gammas (shaded histograms) and real Crab gammas (crosses). Left: SIZE between 200 and 500 phe (corresponding to a gamma peak energy of 140 GeV); right: SIZE>500phe (peak energy 270 GeV).
The real data used for comparing with MC samples were taken in January 2005. They consist of 156 minutes of observations of an OFF sky region (containing no knownray source), and 309 minutes of observations of the Crab Nebula in good weather conditions. The Crab data were taken off-axis, with the center of the Nebula located0:4Æoff the camera center, by tracking two different sky locations alternatively (wobble mode). Tight quality cuts were applied to the events surviving the image cleaning, namely: >5 core pixels, size>200 photoelectrons and less than 10% of the image light contained in the outermost ring of pixels. As much as74%
of the events are rejected by these cuts, which raise the typical energy of the remaining events well above the trigger threshold of the telescope (which we estimate to be currently between 50 and 60 GeV). The remaining sample of MC gammas has an energy peak of 140 GeV (assuming a -2.6 differential energy spectrum). The tight cuts were dictated by the need of having a good angular resolution (see below) and a significant excess of gamma events from Crab Nebula even before applying strong hadron discrimination cuts. The total background trigger rates after imposing these cuts for MC and data are about 65 Hz and 60 Hz respectively. Figure 1 shows the comparison of the WIDTH and LENGTH distributions for Monte Carlo and real hadrons (from the OFF runs) in two different size bins: 200 500 photelectrons and>500 photoelectrons. The SIZE spectrum of
Monte Carlo simulation for the MAGIC telescope 3 hadrons is displayed on the right pad of Fig 3. The observed distributions agree well with expectations (it must be noted that the applied cuts and the limited trigger region of the MAGIC camera result in a negligible contribution from hadrons beyond the maximum simulated impact parameter of 400 m).
SIZE (phe-) log10
2 2.5 3 3.5 4 4.5 5 5.5
Rate (Hz)
10-4
10-3
10-2
MAGIC Gamma MC vs Crab gammas
Size (photoelectrons) log10
2 2.5 3 3.5 4 4.5 5 5.5
Rate (Hz)
10-3
10-2
10-1
1
Crosses: MC p+He, Solid Histogram: Off data
MAGIC
Size > 200 phe
Figure 3. Left: distribution of the SIZE parameter for Monte Carlo gamma (shaded histogram) and real excess events from the Crab Nebula. Right: SIZE for Monte Carlo hadrons (crosses) vs. real OFF data.
For the comparison of simulated and real gamma-initiated showers, only the Crab wobble runs were used (with no additional OFF runs needed). With a simple DISP method [9] the incident direction of each event is esti- mated using the ratio of WIDTH and LENGTH as a measure of the distance between the center of gravity of the phe distribution and the gamma-ray source position on the camera. The third moment along the major image axis is used to resolve the head-tail ambiguity. On the resulting event map a circular ON region of0:25Æradius is defined around the nominal position of the Crab Nebula, together with three identical non-overlapping OFF
Energy (GeV)
10 102 103 104
Energy (GeV)
10 102 103 104
)-1 s-2 (cm>EΦMinimum integral flux,
10-14 10-13 10-12 10-11 10-10 10-9
° = 0 to 30 θ point-like source, E-2.6
∝ Integral flux sensitivity for dN/dE
GLAST (1 year)
in 50 h σ 5
MAGIC
HESS VERITAS
Crab Nebula
Figure 4. Integral point-source flux sensitivity of MAGIC as obtained from the MC simulation. The curve does extend beyond 1 TeV, but values have not been com- puted due to low hadron MC statistics.
regions at the same distance from the camera center. By plotting the distribution of any image parameter both for the events in the ON and the OFF regions, and subtract- ing the latter from the former (after suitable normaliza- tion), one obtains the distribution of the parameter for the excess events, which are gamma rays from the Crab Neb- ula. With the source just 0.4 degree away from the cen- ter, tight cuts were necessary in order to achieve a good enough angular resolution such that OFF regions were not significantly contaminated by gamma rays. Apart from the quality cuts, an extremely loose hadron su- pression cut (rejecting just2% of gammas while halv- ing the background) has also been applied to reduce the number of background events in the subtracted his- tograms and hence the fluctuations in the resulting distri- butions. This cut, based only on “shape” parameters (no source-dependent parameter was used), and performed with the Random Forest classification method [10], has to be loose to avoid biasing the image parameter distri- butions of gammas. The MC gamma sample undergoes the same treatment. In filling the histograms, the Monte
4 P. Majumdar et al.
Carlo gammas have been weighted to account for the deviation of the Crab spectrum from a pure power law towards low energies [11].
The distributions of WIDTH and LENGTH for MC gammas are shown in figure 2, and the SIZE spectrum in Fig. 3, compared to those of real Crab Nebula data. The real data are found to be in good agreement with Monte Carlo expectations. No arbitrary normalization factors have been applied: the observed total rate of gammas from Crab for this sample (the integral of the shown histograms) is of 9.9 events per minute, in reasonable agreement with the MC prediction of 9.5 (taking into account that the assumed Crab spectrum [11] is just a parametrization from data taken at higher energies). These are the rates of events reconstructed in the defined
0:25
Æradius region around Crab. From MC we can estimate that the rate of Crab gammas reconstructed outside this circle is of about 6 per minute, mostly close to the low energy end of the sample. Hence the degradation of the angular resolution (for the particular DISP method here used) is the reason for the flattening of the SIZE spectrum of gammas below103phe (Fig. 3, left). The SIZE distribution of hadrons in the same figure does not show such a feature, since no selection on shower direction was applied for them.
3. Conclusions
The Monte Carlo simulation of the MAGIC telescope has been shown to reproduce the experimental data, both for hadron and gamma primaries. The method used for the validation of the gamma MC could be applied only to a sample well above the trigger energy threshold of the experiment, which was nevertheless enough to confirm the validity of some of the main performance parameters of the telescope used in the simulation, like the overall light collection efficiency. The on-axis sensitivity of MAGIC for point sources obtained from MC is shown in Figure 4, and has likewise been confirmed in observations of Crab down to 100 GeV. Below 100 GeV, background discrimination becomes more difficult: WIDTH and LENGTH for hadrons and gammas become more and more similar for decreasing SIZE (left pads of Figs. 1 and 2), and a better tuning of the simulation will be needed to reach the optimal performance of the telescope as shown in Figure 4 (both in terms of analysis energy threshold and flux sensitivity). The performance of MAGIC from the point of view of energy resolution, as obtained from the same MC simulation, is discussed elsewhere in these proceedings [8].
Acknowledgement : The authors gratefully acknowledge the support of MPG and BMBF (Germany), the INFN (Italy), the CICYT (Spain) and the IAC for this work.
References
[1] D. Heck et al., Report FZKA 6019 (1998)
http://www-ik.fzk.de/˜heck/corsika/physics_description/corsika_phys.html [2] L. Elterman, Applied Optics Vol. 3, No. 6 (1964)
[3] L. Elterman et al., Handbook of geophysics and space environments, Mc Graw-Hill, N.Y. (1965) [4] F. Goebel et al., Proceedings of the 29thICRC, Pune, (2005)
[5] AMS Collaboration, Physics Letters B, 490 (2000) [6] AMS Collaboration, Physics Letters B, 494 (2000)
[7] T. Bretz et al., Proceedings of the 28thICRC, Tsukuba (2003) [8] R. Wagner et al., Proceedings of the 29thICRC, Pune (2005) [9] R. W. Lessard et al., Astroparticle Physics 15 (2001)
[10] L. Breiman,http://oz.berkely.edu/users/breiman [11] F. Lucarelli et al., Astroparticle Physics 19, 339 (2003)