Robert Marcus Wagner
Measurement of
Very High Energy Gamma-Ray Emission from Four Blazars Using the MAGIC Telescope
and a Comparative Blazar Study
Dissertation an der Fakultät für Physik der Technischen Universität München
angefertigt am Max-Planck-Institut für Physik
MPP-2006-245
November 2006
Robert Marcus Wagner
—————————————
Measurement of
Very High Energy Gamma–Ray Emission from Four Blazars Using the MAGIC Telescope
and a Comparative Blazar Study
Measurement of Very High Energy Gamma–Ray Emission from Four
Blazars Using the MAGIC Telescope and a Comparative Blazar Study
Robert Marcus Wagner
November 2006
Robert Wagner
Max-Planck-Institut f¨ur Physik F¨ohringer Ring 6, D-80805 M¨unchen
Vollst¨andiger Abdruck der von der Fakult¨at f¨ur Physik der Technischen Univer- sit¨at M¨unchen zur Erlangung des akademischen Grades eines Doktors der Naturwis- senschaften genehmigten Dissertation.
Die Dissertation wurde am 14. November 2006 bei der Technischen Universit¨at M¨unchen eingereicht und durch die Fakult¨at f¨ur Physik am 19. Dezember 2006 angenommen.
Vorsitzender der Pr¨ufungskommission: Univ.-Prof. Dr. A. J. Buras
Pr¨ufer der Dissertation: Hon.-Prof. Dr. S. Bethke, Univ.-Prof. Dr. F. von Feilitzsch
Bibliografische Information Der Deutschen Bibliothek
Die Deutsche Bibliothek verzeichnet diese Publikation in der Deutschen Nationalbiblio- grafie; detaillierte bibliographische Daten sind im Internet ¨uber http://dnb.ddb.de/
abrufbar.
Frontispiece: On a rare foggy night, mysterious laser beams seem to play across the MAGIC telescope at the Roque de los Muchachos on the Ca- nary Island of La Palma. The lasers are actually part of a system de- signed to automatically adjust the focusing of the innovative, seventeen meter wide, multi-mirrored instrument. The MAGIC (Major Atmospheric Gamma Imaging Cherenkov) telescope itself is intended to detect gamma rays—photons with over 100 billion times the energy of visible light. As the gamma rays impact the upper atmosphere they produce air showers of high-energy particles. The MAGIC camera records in detail the brief flashes of optical light, called Cherenkov light, created by the air shower particles that ultimately correspond to cosmic sources of extreme gamma- rays. The dramatic picture shows the telescope in May 2004.
iv
Summary
The thesis reports on the measurement of very high energy (VHE) gamma–rays from four Active Galactic Nuclei (AGN) with the Major Atmospheric Gamma–ray Imaging Cherenkov telescope (MAGIC).
The AGN Mkn 501 was observed with the MAGIC telescope during six weeks in 2005. A baseline flux of about 25% of the Crab nebula flux as well as high flux states of up to four times the Crab nebula flux were found. Different flux states are defined and energy spectra for these states are determined in the energy range between 100 GeV and 4 TeV. The spectra show a clear spectral hardening with increasing flux level, ranging from baseline spectra of
dF
dE = (0.56 ± 0.04) × 10
−9µ E 250 GeV
−2.39±0.06TeV
−1cm
−2s
−1to high flux-level spectra that can be described by
dF
dE = (4.11 ± 0.16) × 10
−9µ E 250 GeV
−2.14±0.03TeV
−1cm
−2s
−1.
When taking into account -ray absorption by the extragalactic background light (EBL), a hint for an inverse Compton peak is found with the peak energy moving from (0.3 ± 0.1) TeV to (1.4 ± 0.7) TeV with increasing flux level. This evidence is strengthened by the observation of a moving structure also in the measured spectra, which are free of uncertainties of the EBL model used.
Unprecedented rapid flux variability with doubling times of ≤ 5 minutes was found during some of the observation nights. These fast flares are used to infer significant limits on the size of the acceleration region of R · δ
−1≤ 10
12cm for homogeneous one–zone Self–
Synchrotron Compton models. Significant spectral hardening of ∆ α = 0.4 within less than 20 minutes could be observed. The well-defined fast flares were also used to infer a lower limit on the quantum gravity energy scale of 1.5 × 10
17GeV.
For the BL Lac object 1ES 2344+514 for the first time a differential energy spectrum
during a state of low -ray activity is inferred, which between 140 GeV and 5 TeV can be
described by a power law of the form dF
dE = (1.18 ± 0.13) × 10
−11µ E 500 GeV
−2.95±0.12TeV
−1cm
−2s
−1The study of the 24-day VHE -ray light curve of 1ES 2344+514 yields a low flux level of 0.04 ≤ F
E>350 GeV≤ 0.11 times the Crab nebula flux. In combination with the all-time (1995–2005) light curve a low emission level of about ≈4% of the Crab nebula flux is found.
Within the thesis, predictions for the detectability of BL Lac candidate objects in VHE -rays with the MAGIC telescope are presented. These predictions led to the discovery of two new objects in this energy domain, PG 1553+113 and BL Lacertae. PG 1553+113 was detected at a high significance level of 8.8 σ . The softest gamma ray spectrum observed so far in VHE -rays was found for this source. It can be described by a pure power law between 95 GeV and 500 GeV:
dF
dE = (0.18 ± 0.03) × 10
−9µ E 200 GeV
−4.21±0.25TeV
−1cm
−2s
−1.
The spectrum is used to infer an upper limit of z < 0.78 on the yet undetermined redshift of PG 1553+113 by imposing a maximum hardness of the intrinsic spectrum. While the light curve does not show apparent short–term variability, simultaneously recorded optical data feature a substantial flare, which leaves room for interpretation of the non-existing correlations.
BL Lacertae, the prototype of the BL Lac objects, was detected at a significance level of 5.6 σ . This object is the first low–frequency peaked BL Lac object seen in VHE -rays.
A preliminary spectrum hints at a steep slope of ≈ −3.7 between 100 GeV and 1 TeV.
For the first time a synoptic study of all high–frequency peaked BL Lac-type objects de- tected as VHE gamma-ray emitters is performed. The intrinsic properties of the observed emission are compared and correlated among each other and with the individual estimated black hole masses. Key findings are (1) that all currently known VHE -ray blazars host supermassive black holes with masses exceeding 10
8solar masses, (2) that in the current VHE blazar sample no obvious correlations of the VHE emission properties with the black hole masses of the blazars are found, (3) that a weak correlation of the intrinsic spectral hardness and the source distance is likely due to an EBL overprediction by the current EBL models, and (4) that there is a general trend of an increase of the VHE luminosity with the hardness of the intrinsic source spectra. The latter behavior is also found for sources that were observed in different emission states. Furthermore, the found luminosity distribution of the VHE blazar sample is used to constrain the distance of PG 1553+113. Depending on the strength of the assumptions taken, the limit varies be- tween z ≤ 0.43 and z ≤ 0.68.
vi
The technical part of the thesis deals with the implementation of a telescope drive system that permits the fast follow–up of gamma-ray bursts. For measuring the tracking accuracy of the telescope, a starfield monitoring system has been commissioned. Further, the im- plementation of the flux and light curve calculation within the framework of the MAGIC Analysis and Reconstruction Software is discussed. The application of the analysis chain is exemplified on the first large data sample taken on the Crab nebula with the MAGIC telescope. The observations were performed in 2004/5 to understand and calibrate the telescope. We find a light curve that is compatible with a constant -ray emission of F
E>200 GeV= (2.16 ± 0.07) × 10
−10cm
−2s
−1and a differential -ray spectrum that can be described by a curved power law
dF
dE =(7.8 ± 0.4) × 10
−10µ E 250 GeV
(−2.35±0.09)−(0.09±0.07)log10(
250 GeVE)
TeV
−1cm
−2s
−1in the energy range of 95 GeV − 6.5 TeV. The results are well compatible with that of
other experiments and with model predictions.
Zusammenfassung
In dieser Arbeit wird ¨uber Messungen von hochenergetischer Gammastrahlung von vier Aktiven Galaktischen Kernen (AGN) mit dem ,,Major Atmospheric Gamma–ray Imaging Cherenkov“–Teleskop (MAGIC) berichtet.
Mkn 501 war der zweite AGN ¨uberhaupt, von welchem hochenergetische Gammastrah- len nachgewiesen werden konnten. Diese Quelle wurde im Jahr 2005 mit MAGIC ¨uber sechs Wochen hinweg beobachtet. Neben einem Grundzustandsfluß von etwa 25% des Krebsnebelflusses traten Fl¨usse bis hin zum Vierfachen des Krebsnebelflusses auf. Es werden zun¨achst verschiedene Flußniveaus definiert, f¨ur welche dann differentielle En- ergiespektren zwischen 100 GeV und 4 TeV erstellt werden. Mit ansteigendem Fluß wird beobachtet, daß die Spektren h¨arter werden. Das Grundzustandsspektrum wurde zu
dF
dE = (0.56 ± 0.04) × 10
−9µ E 250 GeV
−2.39±0.06TeV
−1cm
−2s
−1bestimmt, das Spektrum f¨ur die h¨ochsten beobachteten Fl¨usse hingegen zu
dF
dE = (4.11 ± 0.16) × 10
−9µ E 250 GeV
−2.14±0.03TeV
−1cm
−2s
−1.
Unter Ber¨ucksichtigung der Effekte der Gammastrahlungs-Absorption am extragalak- tischen Hintergrundlicht (EHL) ergibt sich ein Hinweis auf ein Maximum in der En- ergiedichteverteilung der gemessenen Strahlung. Dieses wird im Rahmen von Mod- ellen erwartet, die die Erzeugung der Gammaquanten durch leptonische Beschleunigung erkl¨aren. Mit ansteigendem Flußniveau bewegt sich dieses Maximum von (0.3 ±0.1) TeV nach (1.4 ± 0.7) TeV. Diese Beobachtung wird unterst¨utzt durch die Tatsache, daß auch ohne Ber¨ucksichtigung der EHL–Absorption und entsprechender Unsicherheiten eine mit dem Flußver¨anderliche Struktur in den Gammastrahlungsspektren gefunden werden kann.
W¨ahrend einiger der Beobachtungsn¨achte wurde zum ersten Mal f¨ur hochenergetische
Gammastrahlung ein sich auf Zeitskalen von ≤ 5 Minuten verdoppelnder oder hal-
bierender Fluß gefunden. Unter Anwendung von Synchrotron-Self-Compton–Modellen
erm¨oglichen diese Gammastrahlungsausbr¨uche eine starke Einschr¨ankung der Gr¨oße
der Beschleunigungsregion auf R · δ
−1≤ 10
12cm. Eine signifikante Ver¨anderung des
spektralen Index von ∆ α = 0.4 konnte in weniger als 20 Minuten beobachtet werden.
Klar identifizierbare Strukturen der Lichtkurven der Gammastrahlungsausbr¨uche in ver- schiedenen Energiebereichen wurden verwendet, um die Energieskala f¨ur Quanteneffekte der Gravitation auf E
qg≥ 1.5 × 10
17GeV einzuschr¨anken.
F¨ur das BL Lac-Objekt 1ES 2344+514 wurde erstmalig ein differentielle Energiespek- trum in einem Zustand niedriger Gammastrahlungsemission hergeleitet, welches zwi- schen 140 GeV und 5 TeV durch ein Potenzgesetz der Form
dF
dE = (1.18 ± 0.13) × 10
−11µ E 500 GeV
−2.95±0.12TeV
−1cm
−2s
−1beschrieben werden kann. Die gefundene, sich ¨uber 24 Beobachtungsn¨achte erstrek- kende Lichtkurve f¨ur hochenergetische Gammastrahlung zeigt eine Fluß zwischen 0.04 ≤
F
E>350 GeV≤ 0.11 des Krebsnebel-Flusses. Unter Hinzunahme der Beobachtungen an-
derer Instrumente zwischen 1995 und 2005 wird gezeigt, daß 1ES 2344+514 im Jahr 2005 in einem niedrigen Emissionszustand vorgefunden wurde.
Diese Arbeit macht Vorhersagen ¨uber die Beobachtbarkeit von BL Lac-Objekten im Licht hochenergetischer Gammastrahlung, welche zur Entdeckung von zwei bisher nicht nachgewiesenen Objekten in diesem Energiebereich f¨uhrten, PG 1553+113 und BL La- certae. PG 1553+113 wurde auf einem Signifikanzniveau von 8.8 σ entdeckt. Dieses Objekt weist das bisher weichste Energiespektrum zwischen 95 GeV und 500 GeV auf:
dF
dE = (0.18 ± 0.03) × 10
−9µ E 200 GeV
−4.21±0.25TeV
−1cm
−2s
−1Mit Hilfe dieses Spektrums kann die bisher unbekannte Rotverschiebung von PG 1553+113 auf z < 0.78 eingeschr¨ankt werden, wenn man Annahmen ¨uber die maxi- male intrinsische H¨arte des Quellspektrums trifft. Die Lichtkurve f¨ur PG 1553+113 zeigt keine Hinweise auf kurzfristige Flußver¨anderungen, obschon gleichzeitig ein klarer Aus- bruch im sichtbaren Licht festgestellt wurde.
BL Lacertae, der Prototyp der BL Lac-Objekte, wurde auf einem Signifikanzniveau von 5.6 σ als Quelle hochenergetischer Gammastrahlung nachgewiesen. Dieses Objekt ist die erste in hochenergetischer Gammastrahlung beobachtete Quelle, deren Synchrotron- Energieverteilung im optischen/ultravioletten Bereich des Spektrums ihr Maximum hat.
Ein vorl¨aufiges Spektrum der vermessenen Gammastrahlungs-Emission weist zwischen 100 GeV und 1 TeV einen Spektralindex von ≈ −3.7 auf.
Erstmalig wurde eine zusammenfassende Untersuchung aller sogenannter high–frequency
peaked BL Lac-Objekte durchgef¨uhrt, von denen hochenergetische Gammastrahlungs-
emission bekannt ist. Die Eigenschaften der beobachteten Strahlung werden unter-
einander sowie mit den abgesch¨atzten Massen der zentralen schwarzen L¨ocher verglichen
und korreliert. Die wichtigsten Ergebnisse dieser Studie sind (1) alle derzeit bekannten
x
BL Lac-Quellen f¨ur hochenergetische Gammastrahlung beherbergen schwarze L¨ocher mit Massen gr¨oßer der 10
8-fachen Sonnenmasse, (2) derzeit existieren keine offen- sichtlichen Korrelationen zwischen den Eigenschaften der hochenergetischen Gamma- strahlung und den Massen der schwarzen L¨ocher, (3) die schwache Korrelation zwischen der H¨arte der quellintrinsischen Spektren und der Entfernung der Quellen ist vermutlich bedingt durch eine ¨ Ubersch¨atzung des extragalaktischen Hintergrundlichts (EHL) durch die derzeitigen EHL-Modelle, sowie (4) es existiert eine Korrelation zwischen der Lu- minosit¨at der hochenergetischen Gammastrahlung und der H¨arte des Energiespektrums der jeweiligen Quelle. Diese Beobachtung trifft insbesondere auch auf die Quellen zu, von denen verschiedene Flußzust¨ande bekannt sind. Weiterhin k¨onnen die typischerweise beobachteten Luminosit¨aten benutzt werden, um eine Annahme ¨uber die maximale Lumi- nosit¨at der Quelle PG 1553+113 zu treffen. Je nach der St¨arke der getroffenen Annahme l¨aßt sich damit die maximale Entfernung dieses Objektes zu z ≤ 0.43 bis z ≤ 0.68 ab- sch¨atzen.
Der Beitrag zur experimentellen Technik des Teleskops behandelt die Inbetriebnahme des Antriebssystem des Teleskops, welches ein schnelles Repositionieren erm¨oglicht, wie es zur Gammablitz–Beobachtung ben¨otigt wird. Um die Nachf¨uhrgenauigkeit des Systems zu ¨uberwachen, wurde eine Positionsbestimmung unter Zuhilfenahme des im sichtbaren Licht beobachteten, die Quelle umgebenden Sternenfeldes implementiert. Weiterhin wird der Teil der MAGIC-Analysekette besprochen, welcher der Erstellung von differentiellen Energiespektren und Lichtkurven dient. Die Anwendung der Analysekette wird anhand eines 2004 und 2005 genommenen Datensatz von Krebsnebel-Beobachtungen dargestellt, der eine Beobachtungszeit von 15 Stunden umfaßt. Diese Analyse diente dem Verst¨andnis und der Kalibrierung des Teleskops. Die ermittelte Lichtkurve ist vertr¨aglich mit einem konstanten Gammastrahlungsfluß von F
E>200 GeV= (2.16 ± 0.07) × 10
−10cm
−2s
−1und einem differentiellen Energiespektrum, welches durch ein Potenzgesetz (mit logarithmi- schem Abfall) der Form
dF
dE =(7.8 ± 0.4) × 10
−10µ E 250 GeV
(−2.35±0.09)−(0.09±0.07)log10(
250 GeVE)
TeV
−1cm
−2s
−1im Energiebereich zwischen 95 GeV und 6.5 TeV beschrieben werden kann. Die gefun-
denen Ergebnisse stimmen im ¨ Uberlappbereich mit denen anderer Experimente sowie mit
Modellen der Krebsnebel-Emission gut ¨uberein.
Contents
Introduction 1
1 Very High Energy Gamma Ray Astrophysics 5
1.1 Cosmic rays . . . . 5
1.2 Gamma rays . . . . 8
1.2.1 Elementary production mechanisms of -rays . . . . 8
1.2.2 Intergalactic absorption of VHE -rays . . . . 10
1.3 Astrophysical sources of -rays . . . . 13
1.3.1 Extragalactic sources . . . . 15
1.3.2 Galactic sources . . . . 16
1.3.3 Unidentified EGRET sources . . . . 18
1.3.4 The connection to particle physics . . . . 18
2 Active Galactic Nuclei 21 2.1 VHE -ray production mechanisms . . . . 26
2.1.1 Leptonic models . . . . 26
2.1.2 Hadronic models . . . . 28
2.1.3 More on SSC models: Parameters and observables . . . . 30
2.2 Flux variability . . . . 33
2.3 Current sample of VHE-emitting AGNs . . . . 36
2.4 Search for new VHE-emitting BL Lac objects . . . . 37
2.4.1 SSC model predictions . . . . 37
2.4.2 Target selection for MAGIC telescope observations . . . . 38
3 Imaging Air Cherenkov Telescopes 43 3.1 Extended air showers . . . . 44
3.1.1 Electromagnetic showers . . . . 44
3.1.2 Hadronic showers . . . . 46
3.1.3 Differences between -ray-initiated and hadronic showers . . . . 47
3.2 Cherenkov light . . . . 49
3.2.1 Cherenkov light production . . . . 49
CONTENTS
3.2.2 Production and attenuation of Cherenkov light in the atmosphere . 50
3.3 The imaging technique . . . . 53
3.4 Large zenith angle observations . . . . 55
4 The MAGIC Telescope 57 4.1 The mechanical structure, the reflector and the mirror control system . . . 59
4.2 The imaging photomultiplier tube camera . . . . 59
4.3 The readout chain . . . . 60
4.4 Calibration system . . . . 62
4.5 The drive system . . . . 62
4.5.1 Mechanical setup and hardware components . . . . 62
4.5.2 The control loop . . . . 64
4.5.3 The positioning & tracking algorithm . . . . 67
4.5.4 Pointing model . . . . 69
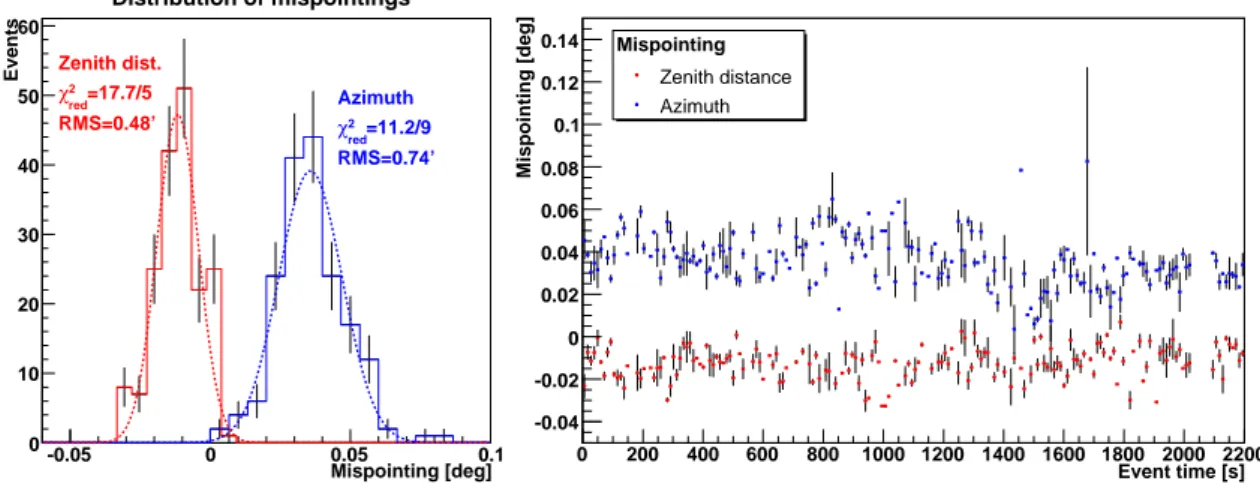
4.5.5 Tracking accuracy . . . . 71
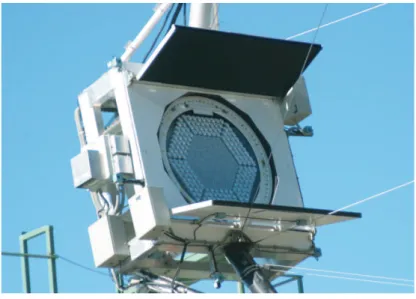
4.5.6 The starfield monitor . . . . 71
4.6 Monte Carlo simulations of air showers . . . . 81
4.7 Observation modes and file types . . . . 84
4.8 Optical support observations . . . . 86
5 The Analysis Chain for the MAGIC Telescope 87 5.1 Data selection and quality checks . . . . 88
5.2 Charge and arrival time reconstruction . . . . 88
5.3 Calibration . . . . 90
5.4 Event reconstruction and background rejection . . . . 91
5.4.1 Image cleaning and reconstruction . . . . 92
5.4.2 Image parameters . . . . 93
5.4.3 Rejection of the hadronic background . . . . 95
5.4.4 Energy reconstruction . . . . 99
5.4.5 Arrival direction reconstruction . . . . 100
5.5 Signal extraction . . . . 103
5.6 Spectrum and light curve determination . . . . 105
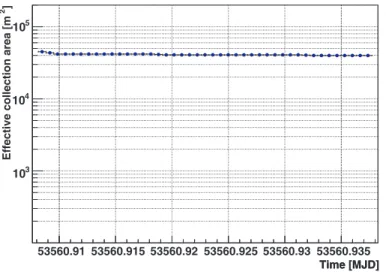
5.6.1 Effective collection area . . . . 106
5.6.2 Effective observation time . . . . 106
5.6.3 Flux and light curve determination . . . . 107
5.6.4 Monte Carlo tests . . . . 111
5.6.5 Light curves . . . . 111
5.6.6 Unfolding of the differential energy spectra . . . . 113
5.7 Wrap–up: The analysis chain . . . . 115
5.8 Systematic errors . . . . 116
xiv
CONTENTS
6 Analysis of Crab nebula data 119
6.1 The Crab nebula . . . . 119
6.2 Data sample and run selection . . . . 121
6.3 Signal extraction and excess determination . . . . 123
6.4 Flux stability and differential energy spectrum . . . . 123
6.5 Conclusions . . . . 126
7 Long–term observations of the AGN Markarian 501 131 7.1 Introduction . . . . 131
7.2 Aims of the observation . . . . 132
7.3 Lorentz invariance . . . . 136
7.4 Data sample . . . . 138
7.5 Event reconstruction and excess determination . . . . 139
7.6 Studies of the overall light curve . . . . 142
7.7 Spectrum determination . . . . 150
7.7.1 Flux–level dependent spectra . . . . 150
7.7.2 Correlation between spectral hardness and flux level . . . . 152
7.7.3 Inverse Compton peak . . . . 154
7.7.4 Intrinsic energy spectra . . . . 156
7.8 Flare analysis . . . . 157
7.8.1 Spectral changes during high flux levels . . . . 162
7.8.2 Rise and fall times . . . . 163
7.8.3 Lorentz invariance tests . . . . 167
7.8.4 Flare modeling . . . . 171
7.8.5 Variability timescales . . . . 174
7.8.6 Model constraints for Mkn 501 . . . . 177
7.9 SSC modeling . . . . 181
7.10 Interpretation and conclusions . . . . 183
8 The BL Lac object 1ES 2344+514 during a low emission phase 187 8.1 Observations with the MAGIC telescope . . . . 189
8.2 Event reconstruction and excess determination . . . . 191
8.3 Light curve studies . . . . 191
8.4 Spectrum determination . . . . 198
8.5 Spectral energy distribution of 1ES 2344+514 . . . . 201
8.6 Interpretation and conclusions . . . . 202
9 First observations of VHE -ray emission from the blazar PG 1553+113 205 9.1 Introduction . . . . 205
9.2 Observations . . . . 207
CONTENTS
9.3 Run selection . . . . 207
9.4 Excess determination and position reconstruction . . . . 209
9.5 Light curve . . . . 211
9.6 Spectrum determination . . . . 213
9.7 A determination of an upper redshift limit for PG 1553+113 . . . . 214
9.8 Interpretation and conclusions . . . . 215
10 Detection of VHE -rays from BL Lacertae 219 10.1 Observations . . . . 220
10.2 Event reconstruction and excess determination . . . . 220
10.3 Light curve . . . . 222
10.4 Differential energy spectrum . . . . 224
10.5 Conclusions . . . . 224
11 A synoptic study of VHE -ray blazars detected to date 227 11.1 Population studies: The -ray horizon . . . . 228
11.2 Black hole masses in AGNs . . . . 229
11.3 Intrinsic VHE -ray emission parameters . . . . 231
11.3.1 Correlation of X-ray and VHE -ray luminosity . . . . 233
11.3.2 Correlations of intrinsic VHE -ray emission parameters with the black hole properties or redshift . . . . 235
11.3.3 500 GeV luminosity for PG 1553+113 at different distances . . . 238
11.3.4 Correlation between the intrinsic photon index and the VHE - ray luminosity . . . . 239
11.3.5 Variability timescales and X-ray duty cycles . . . . 239
11.4 Concluding comments on the correlation studies . . . . 241
11.5 Implications of the synoptic studies . . . . 244
12 Concluding remarks 249
Bibliography 253
Acknowledgments 281
xvi
List of Figures
1.1 Experiments in the early days . . . . 5
1.2 All–particle cosmic ray spectrum . . . . 6
1.3 AGASA, HiRes and AUGER measurements in the UHE region . . . . 7
1.4 Spectral energy distribution of the EBL . . . . 11
1.5 EBL cutoff energy as a function of redshift z at an optical depth of τ = 1. 13 1.6 Optical depth τ (E) for different redshifts z. . . . 13
1.7 Measured and EBL de-absorbed spectrum of Mkn 501 . . . . 14
1.8 Number of discovered X-ray, -ray and VHE -ray sources . . . . 14
1.9 EGRET and VHE -ray sources . . . . 15
1.10 T
90distribution for gamma-ray bursts . . . . 17
2.1 Empirical classification scheme of AGNs . . . . 22
2.2 AGN model in the unified AGN scheme . . . . 22
2.3 AGN taxonomy . . . . 23
2.4 MHD simulations of jets . . . . 25
2.5 Radio-to-X-ray composite of the jet of 3C 273 . . . . 25
2.6 Spectral energy distribution of Mkn 421 . . . . 26
2.7 Average SED for a sample of 261 blazars . . . . 26
2.8 Blazar sequence in SSC models . . . . 29
2.9 Blazars in the 5 GHz-radio—synchrotron peak frequency plane . . . . 29
2.10 Electron injection spectrum and spectral photon energy distribution in the SSC model . . . . 31
2.11 Spectral energy distributions of the BL Lac objects Mkn 421 and Mkn 501 32 2.12 Filament structure in the supernova remnant SN 1006 . . . . 35
2.13 Calculated SEDs with increasing synchrotron peak frequency . . . . 37
2.14 BL Lac candidate selection criteria . . . . 38
2.15 EBL absorption for a redshift of z = 0.4 . . . . 40
2.16 Predicted spectral energy distributions for selected BL Lac candidate objects 41 3.1 Atmospheric windows for the observation of the universe. . . . 43
3.2 Schematic description of extended air showers . . . . 44
List of Figures
3.3 Longitudinal development of an extended air shower . . . . 46
3.4 Simulated extended air showers . . . . 48
3.5 Photograph of a Cherenkov light flash . . . . 49
3.6 Production of Cherenkov light . . . . 50
3.7 Lateral Cherenkov photon density distribution . . . . 51
3.8 Cherenkov photon yields for different particle species . . . . 51
3.9 Spectra of Cherenkov light emitted by an air shower . . . . 52
3.10 Imaging technique I: IACT in the Cherenkov light pool . . . . 53
3.11 Imaging technique II: Projection of the air shower onto an imaging detector 53 3.12 Air showers as imaged with an IACT. . . . 54
3.13 Small and large zenith angle observations . . . . 55
4.1 Aerial view of the MAGIC telescope . . . . 57
4.2 Layout of the telescope and mirror support structure . . . . 58
4.3 Imaging photomultiplier camera of the MAGIC telescope . . . . 60
4.4 Hardware readout chain . . . . 61
4.5 Azimuth and elevation drive units . . . . 63
4.6 Location of the shaft encoders and motor units on the telescope . . . . 64
4.7 Measurement of the torsion of the elevation axis . . . . 64
4.8 Control loop implemented in the drive system microcontrollers . . . . 65
4.9 Tests of the control loops . . . . 66
4.10 Acceleration tests with an artificial end switch . . . . 67
4.11 Relationship between celestial coordinates . . . . 68
4.12 Residuals before and after applying a bending model . . . . 70
4.13 Control deviation of the drive system . . . . 71
4.14 A stacked image of the bright star Vega . . . . 72
4.15 Starfield monitor CCD camera . . . . 73
4.16 Technical specifications for the Xenoplan 1.9/35mm lens . . . . 73
4.17 CCD camera pictures . . . . 73
4.18 Starfield monitor location . . . . 74
4.19 Schematical view of the starfield monitor camera . . . . 75
4.20 Starfield position reconstruction . . . . 76
4.21 Starfield monitor operation . . . . 77
4.22 Resolution of the prototype starfield monitor . . . . 78
4.23 Distributions of measured mispointings . . . . 79
4.24 Deliberate stop of the drive system as seen by the starfield monitor . . . . 80
4.25 The “culmination problem” as observed with the starfield monitor . . . . 81
4.26 Determination of the point spread function from stars . . . . 82
4.27 Sensitivity of the MAGIC telescope . . . . 83
xviii
List of Figures
4.28 Observation modes . . . . 85
5.1 FADC readout . . . . 89
5.2 An air shower event before and after image cleaning. . . . 93
5.3 The Hillas parameters L
ENGTH, W
IDTH, D
IST, and A
LPHA. . . . 93
5.4 Comparison of MC and hadronic background data. . . . 95
5.5 Importance of RF input parameters . . . . 97
5.6 Comparison of image parameter distributions for MC -ray and for ob- served -ray excess events . . . . 98
5.7 Hadronness distributions for MC gammas and O
FFdata . . . . 99
5.8 Integrated hadronness . . . . 99
5.9 A
LPHAdistributions for different hadronness cuts . . . . 100
5.10 Simulated vs. estimated energy for a MC gamma sample . . . . 101
5.11 Overall energy resolution of the energy estimator . . . . 101
5.12 Bias and resolution of the energy estimator . . . . 101
5.13 The D
ISPparameter for arrival direction reconstruction . . . . 102
5.14 Sky maps produced with the D
ISPmethod . . . . 103
5.15 Determination of the -ray excess by means of the directional image pa- rameter A
LPHA. . . . 104
5.16 Determination of the -ray excess by means of the quadratic angular dis- tance θ
2. . . . 105
5.17 Typical effective collection areas before and after cuts . . . . 107
5.18 Determination of the effective observation time . . . . 108
5.19 Cut efficiencies including all event selection cuts . . . . 109
5.20 Migration matrix . . . . 111
5.21 Test of the flux algorithm with MC data . . . . 112
5.22 Test of the flux algorithm with MC and O
FFdata . . . . 112
5.23 Effective collection area in bins of time . . . . 113
5.24 Control plots for the light curve determination . . . . 114
5.25 Control plots of the energy unfolding. . . . 115
5.26 MAGIC analysis chain . . . . 117
6.1 Pulsed and overall emission spectrum of the Crab nebula . . . . 120
6.2 Radiation from a pulsar-wind nebula complex . . . . 121
6.3 Energy reconstruction: estimated energy vs. true energy and energy reso- lution . . . . 123
6.4 A
LPHAdistributions for the Crab nebula . . . . 124
6.5 Sky map for the Crab nebula . . . . 124
6.6 Crab nebula light curve . . . . 125
6.7 Differential energy spectrum for the Crab Nebula . . . . 127
List of Figures
6.8 Spectral energy distribution for the Crab nebula . . . . 128 6.9 Comparison of the MAGIC spectrum with different leptonic emission
models . . . . 129 6.10 Combined MAGIC and H.E.S.S. Crab nebula spectrum . . . . 129 7.1 SEDs of Mkn 501 measured during the 1997 flare . . . . 132 7.2 SEDs of Mkn 501 measured by the HEGRA CT System (1997–1999) . . 132 7.3 Long–term RXTE observation of Mkn 501 . . . . 133 7.4 Sub–hour -ray variability of Mkn 501 . . . . 135 7.5 Sub–hour X-ray flare from Mkn 501 . . . . 135 7.6 Sub–hour X-ray flare from Mkn 501 . . . . 136 7.7 Light curve for the observations of Mkn 501 in 1998/9 . . . . 139 7.8 A
LPHAplots for Mkn 501 observations . . . . 141 7.9 Low energy A
LPHAplots for Mkn 501 observations . . . . 142 7.10 Sky map for Mkn 501 . . . . 143 7.11 VHE -ray and X-ray light curve for Mkn 501 . . . . 144 7.12 ASM energy band along with the MAGIC energy range and SSC models . 144 7.13 Correlation between ASM and VHE -ray fluxes in an analytical SSC
approximation . . . . 144 7.14 Correlations of X-ray and VHE -ray flux for Mkn 501 . . . . 147 7.15 Correlations of optical and VHE -ray flux for Mkn 501 . . . . 148 7.16 Diurnal light curve . . . . 149 7.17 Differential energy spectra for different flux levels. . . . 151 7.18 Spectral energy densities for different flux levels. . . . 151 7.19 Correlation of flux level and slope . . . . 153 7.20 Interpretation of the flux—spectral slope correlation . . . . 153 7.21 Combined SED for 2005 July 1 and 2005 July 10 . . . . 154 7.22 SEDs for 2005 July 1 and 2005 July 10, runs with integrated flux ≥ 0.08 ·
10
−8cm
−2s
−1. . . . 155 7.23 SEDs for 2005 July 1 and 2005 July 10, runs with integrated flux < 0.08 ·
10
−8cm
−2s
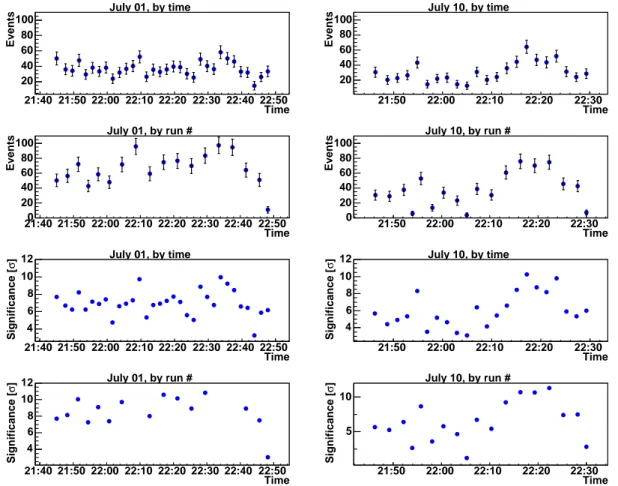
−1. . . . 155 7.24 Correlation of peak energy and integrated flux level . . . . 155 7.25 EBL attenuation function for z = 0.034 . . . . 156 7.26 Intrinsic energy spectra of Mkn 501 . . . . 157 7.27 Light curves for 2005 July 1 and 2005 July 10 . . . . 158 7.28 Distributions of flux values for 2005 July 1 and 2005 July 10 . . . . 159 7.29 Distributions of background events for 2005 July 1 and 2005 July 10 . . . 159 7.30 Distributions of excess events and significances for 2005 July 1 and 2005
July 10 . . . . 160
7.31 Flare significances for 2005 July 1 and 2005 July 10 . . . . 161
xx
List of Figures
7.32 Contemporaneous X-ray pointings with MAGIC data taking . . . . 161 7.33 Spectral changes during a flare on 2005 July 10 . . . . 162 7.34 Flare fits for the observation night of 2005 July 1, 2005 . . . . 164 7.35 Flare fits for the observation night of July 10, 2005 . . . . 164 7.36 Doubling times . . . . 165 7.37 Permitted values in the (R, δ ) plane for the assumption of a homogeneous
source. . . . 166 7.38 Simultaneous fit to the three flares of 2005 July 10 . . . . 168 7.39 Limits on the quantum gravity energy scale. . . . 171 7.40 Light curves and hardness ratios for the observation nights of 2005 July 1
and 2005 July 10 . . . . 172
7.41 Evolution of the flare candidates under study in the (F, h) plane . . . . 173
7.42 Overall Mkn 501 VHE -ray light curve . . . . 174
7.43 Fits to the diurnal Mkn 501 VHE -ray light curve . . . . 176
7.44 Overall Mkn 501 light curve and diurnal flux RMS . . . . 178
7.45 Flux volatility: Normalized RMS of the diurnal flux distributions . . . . . 179
7.46 Normalized RMS distribution and correlation with flux . . . . 179
7.47 BeppoSAX observations of Mkn 501 . . . . 183
7.48 Overall SED for Mkn 501 . . . . 184
8.1 Spectral energy distribution of 1ES 2344+514 . . . . 188
8.2 Long–term ASM observations of 1ES 2344+514 . . . . 190
8.3 θ
2plot for the 1ES 2344+514 observations . . . . 192
8.4 Sky map for 1ES 2344+514 . . . . 192
8.5 VHE -ray, X-ray and optical light curves for 1ES 2344+514 . . . . 193
8.6 Light curves for MJD 53585–53597 & MJD 53723–53736 . . . . 194
8.7 Correlations with X-ray and optical measurements . . . . 195
8.8 Long–term VHE -ray light curve of 1ES 2344+514 . . . . 197
8.9 Differential energy spectrum of 1ES 2344+514 . . . . 199
8.10 Spectra for individual observation periods. . . . 199
8.11 EBL absorption for a redshift of z = 0.044 . . . . 200
8.12 EBL de-absorbed spectrum of 1ES 2344+514 . . . . 201
8.13 Overall SED for 1ES 2344+514 . . . . 203
9.1 Long–term RXTE ASM observations of PG 1553+113 . . . . 206
9.2 A
LPHAplot for PG 1553+113 . . . . 210
9.3 Sky map for PG 1553 . . . . 210
9.4 Light curve for the PG 1553 observations . . . . 211
9.5 Correlation of VHE/X-ray measurements . . . . 212
9.6 Correlation of VHE/optical measurements . . . . 212
List of Figures
9.7 Combined differential energy spectrum of PG 1553+113 . . . . 214 9.8 EBL de-absorbed SEDs for PG 1553+113 . . . . 215 9.9 Redshift limit determination . . . . 216 9.10 Overall SED for PG 1553+113 . . . . 217 10.1 A
LPHAplot for BL Lacertae . . . . 222 10.2 Sky map for BL Lacertae . . . . 223 10.3 Light curve for BL Lacertae . . . . 224 10.4 Tentative differential energy spectrum for BL Lacertae . . . . 225 10.5 Spectral energy distribution and SSC models for BL Lacertae . . . . 226 10.6 Spectral energy distribution for BL Lacertae and hadronic models . . . . 226 11.1 The tips of the VHE -ray icebergs . . . . 227 11.2 Currently known VHE -ray blazars and EGRET AGNs . . . . 228 11.3 AGN VHE -ray emission searches and discoveries . . . . 229 11.4 Redshift vs. black hole mass distribution for known VHE -ray emitting
AGNs . . . . 232 11.5 Redshift vs. black hole mass distribution for 375 AGNs and known VHE
-ray emitting AGNs . . . . 232 11.6 Spectra of VHE -ray emitting blazars . . . . 234 11.7 VHE -ray luminosity vs. X-ray luminosity for known VHE -ray emitters 235 11.8 Correlations of black hole mass and redshift with intrinsic photon index
and VHE -ray luminosity . . . . 237 11.9 Luminosity evolution for PG 1553+113 at different distances . . . . 238 11.10Intrinsic photon index vs. luminosity . . . . 240 11.11Evolution of intrinsic photon index and luminosity during flare states . . . 240 11.12X-ray flare duty cycles of VHE -ray emitting AGNs . . . . 242 11.13Correlations of temporal properties with the black hole mass and the lu-
minosity . . . . 243 11.14Redshifts of the known VHE -ray blazars . . . . 245 11.15Modeled SEDs for 1ES 2344, Mkn 180, and 1ES 1959 . . . . 245 11.16Effective detection area for AMANDA-II . . . . 247
xxii
List of Tables
1.1 Definition of energy ranges in astronomy . . . . 8 2.1 Typical length scales for a 10
8M
¯black hole . . . . 23 2.2 SSC model parameters for Mkn 421 and Mkn 501 . . . . 32 2.3 Discovered and confirmed extragalactic VHE -ray sources. . . . 36 2.4 Candidate BL Lac objects for VHE emission . . . . 39 2.5 Predicted integral fluxes . . . . 41 6.1 Observations used for the Crab nebula analysis . . . . 122 7.1 Limits on the quantum gravity energy scales in literature. . . . 138 7.2 Analysis results for individual nights . . . . 140 7.3 Grouping of Mkn 501 data . . . . 150 7.4 Spectral properties for different flux levels . . . . 152 7.5 Fit parameters for intrinsic Mkn 501 energy spectra . . . . 156 7.6 Doubling times for the observed flares on 2005 July 1 and 10. . . . 165 7.7 Integral flux levels for the night of July 10 . . . . 168 8.1 Summary of VHE -ray measurements of 1ES 2344+514 . . . . 189 8.2 Observations of 1ES 2344+514 . . . . 190 8.3 Parameters of differential energy spectra for individual observation periods.200 9.1 Summary of VHE -ray measurements of PG 1553+113. . . . 207 9.2 Observations of PG 1553+113 . . . . 208 9.3 O
FF–observations for PG 1553+113 . . . . 208 9.4 MAGIC observation results for PG 1553+113 . . . . 210 10.1 Observations of BL Lacertae . . . . 220 10.2 O
FF–observations for BL Lacertae . . . . 221 10.3 Light curve for BL Lacertae . . . . 223 10.4 SED model fit parameters for BL Lacertae . . . . 225 11.1 Mass estimations for the central black holes of known VHE -ray emit-
ting blazars . . . . 231
List of Acronyms and Abbreviations
1ES First Einstein survey
2MASS Two micron all sky survey [Jar03]
AGASA Akeno giant air shower array sect. 1.1
AGN Active galactic nucleus sect. 2
AMANDA Antarctic muon and neutrino detector array sect. 11 AMC Active mirror control
ASM All-sky monitor (detector on board RXTE) a.s.l. Above sea level
Az Azimuth
BATSE Burst and transient source experiment
BH Black hole
BR Branching ratio
BeppoSAX Satellite per astronomia X
CANGAROO Collaboration of Australia and Nippon (Japan) for a gamma-ray observatory in the outback CAT Cherenkov array at Themis
CCD Charged coupled device
CELESTE Cherenkov low energy sampling and timing experiment CGRO Compton gamma-ray observatory
CIB Cosmic infrared background
CM Center of mass
CMB Cosmic microwave background
CORSIKA Cosmic ray simulations for KASCADE [Hec98]
CT Cherenkov telescope
c.u. Crab unit sect. 7.4
DAQ Data acquisition
DKC Drive control units used in the drive system
EAS Extended air shower sect. 3.1
EBL Extragalactic background light sect. 1.2.2
EGRET Energetic gamma-ray experiment telescope
EIC External inverse Compton
List of Acronyms and Abbreviations
EINSTEIN HEAO2 mission, renamed “EINSTEIN” after launch
EM Electromagnetic
EXO EXOSAT observation log
FADC Flash analog to digital converter
FK5 Fifth fundamental catalogue [Fri88]
FSR Fazio–Stecker relation sect. 1.2.2
FSRQ Flat spectrum radio quasar sect. 2
FWHM Full width at half maximum
GLAST Gamma-ray large area space telescope
GNCT Global network of Cherenkov telescopes sect. 6.5
GRB Gamma-ray burst [Mes02]
GRH Gamma-ray horizon sect. 1.2.2
GZK Greisen–Zatsepin–Kuz’min sect. 1.1
H.E.S.S. High energy stereoscopic system
HBL High–frequency peaked BL Lac sect. 2.1
HE High energy tab. 1.1
HEAO2 High energy astrophysics observatory 2
HEGRA High energy gamma-ray astronomy [Dau97]
HETE High energy timing explorer
HFSRQ High–peaked flat spectrum radio quasar sect. 2.1.1 HST Hubble space telescope
IAC Instituto de Astrof´ısica de Canarias
IACT Imaging atmospheric Cherenkov telescope sect. 3 IAU International astronomical union
IC Inverse Compton sect. 1.2.1
IR Infrared
KASCADE Karlsruhe shower core and array detector
KVA Kungliga Vetenskapsakademien [telescope] sect. 4.8
LBL Low–frequency peaked BL Lac sect. 2.1
LI Lorentz invariance
LMC Large Magellanic cloud LONS Light of the night sky
LZA Large zenith angle sect. 3.4
MACS Micro controllers used in the drive system sect. 4.5.2 MAGIC Major atmospheric gamma-ray imaging Cherenkov sect. 4 MARS MAGIC analysis and reconstruction software sect. 5 MC Monte Carlo [simulations]
MHD Magnetohydrodynamic
MJD Modified Julian day
Mkn Markarian
NED NASA extragalactic database
xxvi
List of Acronyms and Abbreviations
NGC New general catalogue of nebulae and clusters of stars
NKG Nishimura–Kamata–Greisen sect. 3.1.1
NRAO U.S. National Radio Astronomy Observatory
NSB Night–sky background
ORM Observatorio del Roque de los Muchachos
PG Palomar–Green catalog of UV-excess stellar objects [Gre86]
ph.el. photoelectrons
PID Proportional–integral–differential sect. 4.5.2
PIN Positive intrinsic negative [diode]
PKS Parkes catalogue of radio sources PMT Photomultiplier tube
PPM Positions and proper motions [star catalog] [Roe88]
PSF Point spread function
PWN Pulsar wind nebula
QE Quantum efficiency
RA Right ascension
RASS ROSAT all-sky survey
RF Random forest
TMRMS Root mean square
ROOT An object–oriented data analysis framework ROSAT R¨ontgen satellite
RXTE Rossi X-ray timing explorer sect. 7.6
SCUBA Sub-millimeter common-user bolometer array
SE Shaft encoder
SED Spectral energy distribution SMBH Supermassive black hole
SNR Supernova remnant
SSC Synchrotron–self Compton sect. 2.1.1
UHE Ultra high energy tab. 1.1
UTC Coordinated universal time
UV Ultraviolet
UVOT UV/optical telescope [on board Swift]
VCSEL Vertical cavity surface emitting laser
VERITAS Very energetic radiation imaging telescope array system
VHE Very high energy tab. 1.1
VLA Very large array
WMAP Wilkinson microwave anisotropy probe XBL X-ray selected BL Lac
XMM XMM-Newton satellite mission
XRT X-ray telescope [on board Swift]
Useful conversion units and definitions
This section provides a small collection of information on units that are commonly used in astrophysics. We also list some important conventions followed in this work.
Astrophysical units and definitions.
Electronvolt: The energy an electron acquires in vacuum from rest through a potential difference of 1 Volt: 1 eV = 1.6022 · 10
−12erg = 1.6022 · 10
−19Joule
MJD: The Modified Julian Date (MJD) is defined as MJD ≡ JD−2400000.5, where JD is the Julian day. JD 0 is defined as January 1, −4712 (=4713 BC), 12:00 noon Greenwich mean time. MJD is used when a continuous numbering of days is more convenient than the use of the civil calendar. Fractions of the day can be added to indicate the exact time of the day.
Solar properties: Solar mass: M
¯= 1.989 × 10
30kg; Solar luminosity: L
¯= 3.90 × 10
26W; Solar radius: R
¯= 6.96 × 10
8m
Light year: 1 light year = 9.4607 × 10
15m
AU: The astronomical unit is the mean distance between the Earth and the Sun. It is commonly used to measure distances within the solar system. 1 astronomical unit (AU) = 1.49597870 × 10
11m
Parsec: The distance at which an object would have a parallax of one arc second is defined as 1 parsec. 1 pc = 3.26 ly = 206,265 AU = 3.0857 × 10
16m
Jansky: A unit for energy flux common in radio astronomy. 1 Jansky (Jy) = 10
−26W m
−2Hz
−1(named after K. Jansky)
Equatorial coordinates: The equatorial coordinate system is given by the projection of
the Earth’s equator and its poles onto the celestial sphere. Great circles through
the celestial poles are perpendicular to the celestial equator and are called hour
circles. The coordinate corresponding to the latitude is called declination (Dec) and
it is the angle between the position of an object and the celestial equator measured
along its hour circle. The hour angle system is fixed to the Earth like the geographic
coordinate system. The hour angle of a given point is defined as the angle measured
westwards along the celestial equator from the local meridian to the hour circle that
passes through the point. The right ascension system is in first order fixed to the
stars (neglecting precession and nutation effects). RA = 0
his the intersection point
of the equatorial plane with Earth’s orbital plane, the ecliptic. RA is given in time
units (0
h− 24
h), while Dec takes values from −90
◦− 90
◦(see also fig. 4.11).
Units and conventions
Conventions.
Zenith distance, zenith angle: The distance of a given point to the local zenith along a great circle. Zd = 90
◦− Elevation.
Spectral index, spectral slope: In the energy region to which imaging air Cherenkov telescopes are sensitive, many astrophysical -ray sources exhibit power law spec- tra. Throughout this work, measured power law indices are denoted by − α , whereas intrinsic power law indices are given by −Γ. Intrinsic and measured spec- tra may differ due to absorption effects, cf. sect. 1.2.2.
Observation night designation: Note that within MAGIC and within this thesis, full observation nights by convention are always designated by the date or the integer MJD of the following day. This avoids ambiguities, as both the date and the integer MJD change during each observation night.
xxx
Introduction
“Never think that the poetry of Nature’s moods in all their infinite variety is lost on the scientific observer, for the habit of observing refines our sense of beauty and adds a brighter hue to the richly colored background against which each particular fact is outlined.”
(Marcel Minnaert)
In astronomy, the opening of each new spectral window has proven to add new, substan- tial, and unique information which cannot be obtained by other means. It all started with Galileo in the early years of the 17th century, when he for the first time used an optical instrument for astronomical observations. He published his discovery of the four Galilean satellites of Jupiter in the Sidereus Nuncius, the sidereal messenger: “I should disclose and publish to the world the occasion of discovering and observing four Planets, never seen from the beginning of the world up to our own times. . . ”. His observations also led him to the correct physical interpretation, namely that these discovered celestial bodies were orbiting Jupiter.
From the 20th century on, astronomy witnessed many of such breakthroughs:
Radio astronomy with its foundations in the 1930s led to the discovery of new classes of objects, including pulsars, quasars and radio galaxies. The scent of extreme energetic physical processes in the universe came about by studying the underlying physical pro- cesses in these objects. Even more, radio measurements of rotation curves of galaxies prepared the postulation of dark matter, and the detection of the cosmic microwave back- ground radiation added to the understanding of the very early universe.
Infrared astronomy, i.e. observations in the range up to submillimeter wavelengths, for
the first time allowed the observation of dense interstellar dust clouds, which constitute
the birthplaces of stars. Such protostars could now be observed during their contraction
phase by virtue of the dust around them—long before they initiate hydrogen burning and
thus enter the main sequence. The center of our own galaxy also shines brightly in the
infrared: While the high concentration of dust in the galactic plane prevents visible light
of the galaxy center to be observed from Earth, infrared astronomy allows the orbits of
stars to be traced very close to the center of the Milky Way and thus the enclosed mass
Introduction
density to be determined: Evidence for a supermassive black hole in the center of our galaxies was found.
As X-rays and gamma rays ( -rays) coming from space are mostly absorbed by the Earth’s atmosphere, -ray astrophysics dawned with the launch of the first satellite observatories.
-ray emission was not only found to originate from within our galaxy, but from several other extragalactic sources. The term “violent universe” was coined for the observed phenomena, because the kinds of events in the universe that produce -rays were thought to be explosions, high-speed collisions, and other non–thermal processes. The early 1970s also revealed the currently most violent and enigmatic events observed in the universe:
gamma-ray bursts (GRBs). The discipline has flourished since the 1990s when satellite missions with substantially advanced technologies were launched, namely the Compton Gamma Ray Observatory (CGRO), and other missions like BeppoSAX and Swift. They increased significantly the number of sources in this energy domain, offering information about the most energetic processes and phenomena in the universe.
-rays above an energy of some GeV cannot reasonably be observed by satellite detectors with their too small detection areas. In this very high energy (VHE) -ray domain, since the late 1980s ground-based Cherenkov telescopes have proved to be very successful in the energy range above ≈ 300 GeV, adding significant information to the understanding of and for modeling -ray sources and emission mechanisms.
The most recent installations like H.E.S.S., MAGIC, VERITAS, and CANGAROO–III started to become observational in 2002 and currently achieve unprecedented sensitivity and low energy thresholds of / 100 GeV.
This thesis deals with recent observations of extragalactic sources of VHE -rays that exploit both the increased sensitivity and the unprecedented low energy threshold that the MAGIC telescope, the largest of its kind, offers. The text is organized as follows:
• A short introduction to VHE -ray astrophysics and to the sources of such radiation is given in chapter 1. Of particular interest for the theoretical understanding of the astrophysical objects under study are the elementary acceleration mechanisms.
We also discuss the absorption of VHE -rays by extragalactic background light photons, which substantially attenuates the measured -ray spectra of sources at cosmological distances.
• Active Galactic Nuclei (AGN), the class of objects which this thesis deals with,
are the subject of chapter 2. The BL Lac subclass of AGNs is characterized and
acceleration models that aim to explain the non–thermal emission observed in the
VHE -ray domain are discussed. Special emphasis is put on the description of
Synchrotron Self–Compton (SSC) models, and possibilities to explain fast variabil-
ity in AGNs. A source-finding strategy for MAGIC is outlined, which led to the
2
discovery of two new VHE -ray sources presented in this thesis, PG 1553+113 and BL Lacertae.
• Chapter 3 is devoted to the technique which allows so-called Imaging Air Cheren- kov Telescopes (IACT) to observe -rays in the 30 GeV − 100 TeV energy range.
We explain the development of extended air showers in the atmosphere and the subsequent emission of Cherenkov light.
• In chapter 4 the main hardware elements of the MAGIC telescope are described.
Emphasis is put on the implementation of the drive system, its unique fast reposi- tioning capabilities essential for GRB observations, and the starfield monitor that checks the tracking accuracy of the telescope.
• Chapter 5 gives an overview of the standard analysis chain used for MAGIC data and in particular in this thesis. It describes the standard MAGIC telescope analysis chain, important parts of which have been contributed by the author, namely the flux and light curve calculation.
• The Crab nebula with its constant high–level flux of -rays is the standard “candle”
of VHE -ray astronomy. In chapter 6, the first analysis of a large set of Crab nebula data obtained with the MAGIC telescope is presented; the findings are compared with the results of other experiments and emission models for this -ray source.
• Chapter 7 deals with the data obtained during a six-week observation campaign conducted in 2005 on the well–known AGN Markarian 501. A spectral and tempo- ral analysis of the 24 observation nights puts special emphasis on two nights, dur- ing which high flux levels exceeding three times the Crab nebula flux were found.
Thanks to the unprecedented sensitivity of MAGIC, spectral changes within a single observation night were observed and light curves with high time resolution could be produced. Studies of the variation timescales of these flares show that the interday flare states, which were found, can be accommodated by a one-zone SSC model, while the observed flares on timescales of minutes push homogeneous one-zone SSC models to their limits. The fast flares are used to infer a lower limit on the quantum gravity energy scale. In addition, the observations are put in context with previous observations of Mkn 501 in the VHE -ray domain.
• Another previously detected VHE -ray emitter, the AGN 1ES 2344+514, was ob-
served from August 2005 to January 2006. The analysis presented in chapter 8
shows that the object was observed at a rather low flux level with only marginal
signs of variability. A differential energy spectrum derived from the observations is
compared to measurements during a flare in 1995. An all-time VHE light curve is
compiled, and flare and low emission energy spectra are described using a homo-
geneous one-zone SSC model.
Introduction
• H.E.S.S. and MAGIC simultaneously discovered the VHE -ray source PG 1553+113, the redshift of which could not yet be determined. This AGN shows the steepest -ray spectrum observed so far in the VHE domain. The analysis of the data obtained with MAGIC is discussed in chapter 9. Assuming a maximum hardness of the intrinsic spectrum, the VHE -ray measurements allow an upper limit on z to be posed.
• The prototype of the class of BL Lac objects, BL Lacertae, has not been confirmed as a VHE -ray emitter. In chapter 10 we present a first analysis of MAGIC data taken on this object, which hints at VHE -ray emission from BL Lacertae.
• Chapter 11 compares the characteristics of the sources discussed in this thesis and all other known VHE -ray emitting blazars. This is the beginning of a VHE -ray blazar astronomy, of an assessment of common properties of this class of objects.
Studies of correlations of characteristics of the observed emissions are presented.
We also examine the black hole masses of VHE -ray BL Lac objects, compare them with the AGN black hole mass distribution and correlate them with -ray emission characteristics. The comparative study of BL Lac VHE luminosities allows a redshift limit for PG 1553+113 to be inferred. Finally, conclusions on the prospects for neutrino emission of blazars are drawn.
• The concluding remarks in chapter 12 summarize the key findings of this thesis and put them in perspective with the prospects of current and future VHE -ray astronomy.
4
Chapter 1
Very High Energy Gamma Ray Astrophysics
FIGURE1.1:Experiments in the early days: In 1925, Robert Millikan and his co-workers Glenn Millikan, Otto Oldenberg, Ted Cook, and C. H. Prescott, Jr. carry detectors for measuring the cosmic radiation on Mt. Whitney (picture°c California Institute of Technology; taken from [Pau99]).
1.1 Cosmic rays
In his balloon experiments in 1912, Victor Hess observed ionizing radiation permanently
impinging on the Earth’s atmosphere [Hes12]. These particles, coined “cosmic rays” by
R. Millikan (fig. 1.1), have been found to comprise mainly electrically charged particles,
namely protons, alpha particles and heavier nuclei, as well as photons and (to a small
Very High Energy Gamma Ray Astrophysics
Flux [m-2 sr-1 s-1 GeV-1]
Energy [eV]
1 particle m-2 s-1
1 particle m-2 yr-1
1 particle km-2 yr-1 Ankle
Knee
108 1010 1012 1014 1016 1018 1020 10-28
10-25 10-22 10-19 10-16 10-13 10-10 10-7 10-4 10-1 102 104
FIGURE1.2:All–particle cosmic ray spectrum [Bha00].
fraction) electrons. The overall differential cosmic ray spectrum is given in fig. 1.2. It extends over an energy range of 13 orders of magnitude with the flux dropping from about 1 particle cm
−2s
−1at energies of 100 MeV to 10
−2particles km
−2yr
−1at 10
20eV.
Below E = 1 GeV, the cosmic ray flux is affected by the solar wind, which modulates the magnetic field in the solar system with a period of about 11 years. At higher energies the differential spectrum can be described by a power law with spectral index α ≈ 2.7 up to E = 10
15.5eV and above that with α = 3. The transition region is called knee.
The spectrum hardens again at about E = 10
18eV (the so-called ankle). It is believed that cosmic rays below the knee are produced at galactic sites like supernova remnants, pulsars, or binary systems, while cosmic rays with higher energies are not confined to our galaxy. Due to galactic and intergalactic magnetic fields, charged cosmic rays up to 10
19eV are isotropized. Therefore the direction of their arrival at Earth does not point back to their origin. Only at even higher energies, in the regime of the ultra high energy cosmic rays (UHECR), is the rigidity R = E/(Ze) of the particles so high that they are not deflected by extragalactic or galactic magnetic fields (r
gyro= R/B). Anisotropies found in the AGASA data set hint at the possibility of an astronomy of such extremely high energy particles [Tak99].
6
Cosmic rays
log[E (eV)]
E3 × F [eV2 m-2 s-1 sr-1] × 10–24
1 10
0.1
17 18 17.5 18.5 19 19.5 20 20.5 21 HiRes-1 Monocular
HiRes-2 Monocular
Auger SD AGASA HiRes-1 Monocular
HiRes-2 Monocular Stereo
log[E (eV)]
E3 × F [eV2 m-2 s-1 sr-1] × 10–24
1 10
0.1
17 18 17.5 18.5 19 19.5 20 20.5 21
FIGURE 1.3: Status of the UHECR field. Left figure: Monocular and stereoscopic measurements of the HiRes experiment. Taken from [Wat05]. Right figure: HiRes monocular, AGASA and preliminary AUGER surface detector spectra above1017.5eV. Note that after allowing for≈20% systematic errors, the HiRes and AGASA data sets are incompatible on the2.2σsignificance level only. Note also that the provisional stereoscopic HiRes data are not so different from the AGASA data. Taken from [PDG06].
The GZK–cutoff. The reaction of cosmic rays with the omnipresent 2.7K microwave background radiation limits the upper edge of the cosmic ray spectrum:
p +
CMB→ N
∗→ p +
0, n +
+.
The loss of energy by this process leads to the Greisen–Zatsepin–Kuz’min cutoff [Gre66, Zat66] which limits the maximum distance that cosmic rays of E = 10
20eV and above can travel to ≈ 50 Mpc. Currently the existence of the GZK cutoff is a much de- bated subject. While the AGASA experiment, a 100 km
2scintillator air shower array in Japan, observed 11 events above the GZK cutoff energy [Tak98, Hay00], the mea- surements performed by the HiRes collaboration, operating two fluorescence detectors in the U.S., show the expected attenuation structure both in monocular and stereoscopic observations at significance levels of 5 σ and 4.8 σ , respectively [Spr05]. Although the HiRes exposure exceeds that of AGASA by a factor of three [Yos05], the small num- ber of excess events and the rather large systematic errors of the two experiments make it necessary to wait for results from the Pierre Auger Observatory,
1a 3000 km
2hybrid scintillator–fluorescence experiment currently becoming operational [Man05] (fig. 1.3).
Acceleration of charged particles. In astrophysics, non–thermal processes generally lead to power law spectra of the accelerated particles [Lon92]. A mechanism accounting for this observation was put forward by E. Fermi [Fer49]: In diffusive shock acceleration
1http://www.auger.org/
![Fig. 1.7 shows that if the measured energy spectrum [Aha01a] is corrected for EBL ab- ab-sorption effects, the resulting spectrum is consistent with a pure power law as expected in the SSC model (cf](https://thumb-eu.123doks.com/thumbv2/1library_info/4006448.1540881/45.892.155.776.145.404/measured-spectrum-corrected-sorption-resulting-spectrum-consistent-expected.webp)
![Fig. 2.11 shows SSC model fits to observational data of the well–established sources Mkn 421 and Mkn 501 as done by [Cos02]](https://thumb-eu.123doks.com/thumbv2/1library_info/4006448.1540881/64.892.190.671.343.520/fig-shows-ssc-model-fits-observational-established-sources.webp)