Synoptic studies of seventeen blazars detected in very high-energy gamma-rays
R. M. Wagner
?Max-Planck-Institut f¨ur Physik, F¨ohringer Ring 6, D-80805 M¨unchen, Germany
Accepted 2007 December 12. Received 2007 December 10; in original form 2007 September 13
ABSTRACT
Since 2002, the number of detected blazars at gamma-ray energies above 100 GeV has more than doubled. I study 17 blazars currently known to emit E >100 GeV gamma rays. Their intrinsic energy spectra are reconstructed by removing extragalactic background light atten- uation effects. Luminosity and spectral slope in theE >100 GeV region are then compared and correlated among each other, with X-ray, optical and radio data, and with the estimated black hole (BH) masses of the respective host galaxies.
According to expectations from synchrotron self-Compton emission models, a correlation on the 3.6-σsignificance level between gamma-ray and X-ray fluxes is found, while corre- lations between gamma-ray and optical/radio fluxes are less pronounced. Further, a general hardening of the blazar spectra in theE >100 GeV region with increasing gamma-ray lumi- nosity is observed, both for the full 17-source sample and for those sources which have been detected at distinct flux levels. This goes in line with a correlation of the gamma-ray luminos- ity and the synchrotron peak frequency, which is also seen. Tests for possible selection effects reveal a hardening of the spectra with increasing redshift. The blazar gamma-ray emission might depend on the mass of the central BH. The blazars under study do, however, show no correlation of the BH masses with the spectral index and the luminosity in theE >100 GeV region.
I also consider temporal properties of the X-ray andE >100 GeV gamma-ray flux. No general trends are found, except for the observation that the blazars with the most massive BHs do not show particularly high duty cycles. These blazars include Mkn 501 and PKS 2155-304, for which recently very fast flares have been reported. In general, VHE flare time-scales are not found to scale with the BH mass.
As a specific application of the luminosity study, a constraint for the still undetermined redshift of the blazar PG 1553+113 is discussed.
Key words: galaxies: active – BL Lacertae objects: individual (1ES 0229+200, 1ES 0347- 121, 1ES 1011+496, 1ES 1101-232, 1ES 1218+304, 1ES 1959+650, 1ES 2344+514, 3C 279, BL Lacertae, H 1426+428, H 2356-309, Mkn 180, Mkn 421, Mkn 501, PG 1553+113, PKS 0548-322, PKS 2005-489, PKS 2155-304) – black hole physics – galaxies: jets.
1 INTRODUCTION
All but one of the detected extragalactic very high energy (VHE, defined byE>100 GeV) gamma (γ) ray sources so far are blazars.
Within the unified scheme (e.g. Urry & Padovani 1995) of active galactic nuclei (AGN), blazars comprise the rare and extreme sub- classes of BL Lac objects and flat spectrum radio quasars (FSRQs).
These are characterised by high apparent luminosities, short vari- ability time-scales, and apparent superluminal motion of jet com- ponents. These observations can be explained by highly relativis- tic, beamed plasma outflows (jets) closely aligned to the observer’s line of sight (Blandford & K¨onigl 1979) powered by central su-
? E-mail: robert.wagner@mppmu.mpg.de
permassive black holes accreting at sub-Eddington rates (Lynden- Bell 1969; Rees 1978b). The prime scientific interest in VHEγ- ray emitting blazars (in the following, ‘VHE blazars’) is twofold:
(1) To understand the particle acceleration andγ-ray production mechanisms, assumed to take place in the jets and to be linked to the central supermassive black hole (BH). Knowledge of the VHE emission process will also contribute to the further understanding of the accretion processes in AGN, jet formation processes, and the jet structure. (2) To use the VHEγ-rays as a probe of the extra- galactic background light (EBL; e.g. Hauser & Dwek 2001; Kash- linsky 2005) spectrum in the wavelength range between about 0.3 to 30µm. Determining the EBL spectrum in this wavelength range may allow to constrain the star formation rate (convolved with the initial mass function) in the early Universe. In order to assess both
c
b=-180o
b=+180o
l=90o
l=-90o
Mkn 421
Mkn 501
1ES 2344+514 1ES 1959+650
PKS 2155-304 H 1426+428 M87
BL Lac
PKS 2005-489 1ES 1218+304
PG 1553+113 Mkn 180
1ES 1101-232
H 2356-309
PKS 0548-322 1ES 0229+200
1ES 0347-121
1ES 1011+496 3C 279
(z=0.536)
Redshift z
00.02 0.040.06 0.08 0.10.12 0.140.16 0.18 0.2
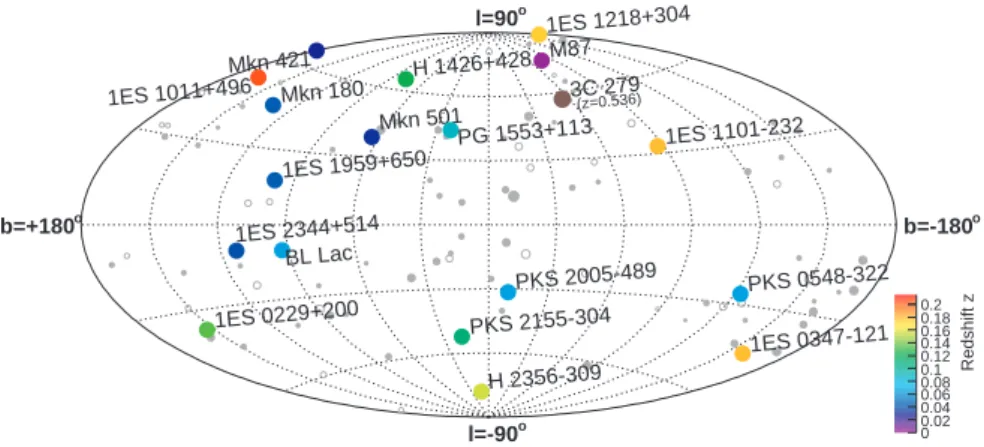
Figure 1.Currently known VHEγ-ray blazars along with the identified (66 objects) and tentatively identified AGN (27 objects) in the 3rd EGRET catalogue ofγ-ray sources (solid grey dots: identified AGN; open grey dots: tentatively identified AGN). EGRET data from Hartman et al. (1999). The sources are shown in a galactic coordinate system.
issues, it is essential to have a large sample of VHEγ-ray blazars at hand. Ideally it should encompass a wide range in redshift for EBL studies and at the same time include groups of sources at similar distances in order to probe and compare properties of the individ- ual sources without possible systematic uncertainties caused by the EBL de-absorption.
The preconditions for such studies have much improved re- cently: Before 2004, only a few nearby extragalactic sources had been established as VHEγ-ray emitters (e.g. Mori 2003) and pro- vided hardly enough data to perform comparative studies. Around 2004, the third generation of imaging air Cerenkov telescopes (IACTs, e.g. MAGIC, Baixeras et al. 2004; Cortina et al. 2005 and H.E.S.S., Hinton 2004), the most successful tools so far to explore VHEγ-rays, started to deliver scientific results. To date, the VHE blazar sample with available spectral information in the VHE re- gion comprises 17 BL Lac objects, among them one LBL object, BL Lacertae. Furthermore, now the redshifts of the known VHE blazars reach up toz =0.212 – or even toz=0.536, considering the recently announced discovery of the first FSRQ in VHEγ-rays, 3C 279 (Teshima et al. 2007). For 3C 279, however, no VHE spec- trum has been published yet, therefore the VHE luminosity and spectral slope of 3C 279 are not yet available for this study. M87, a FR I radio galaxy also detected in VHEγ-rays, is not included in the study, as its VHEγ-ray production mechanism may differ from that in blazars (Aharonian et al. 2006c). Fig. 1 shows the sky posi- tions of the known VHE blazars in galactic coordinates along with the AGN identified in the 3rd EGRET catalogue.
The electromagnetic continuum spectra of blazars extend over many orders of magnitude from radio frequencies to sometimes multi-TeV energies and are dominated by non-thermal emission that consists in a νFν representation of two pronounced peaks.
The low-energy peak, located between the IR and hard X-rays, is thought to arise from synchrotron emission of ultrarelativistic elec- trons, accelerated by shocks moving along the jets at relativistic bulk speed. Depending on the location of the low-energy peak, BL Lac objects are often referred to as high-frequency peaked (HBL; in the UV to X-ray domain) or low-frequency peaked (LBL;
in the near-IR to optical) BL Lac objects (Fossati et al. 1998), al- though the transition is smooth rather than dichotomic. The ori- gin of the high-energy peak at MeV to TeV energies is still de- bated. It is commonly explained by inverse Compton upscatter- ing of low-energy photons by electrons. The seed photons may
originate from synchrotron radiation produced by the same elec- tron population (synchrotron-self Compton (SSC) models; e.g.
Maraschi, Ghisellini & Celotti 1992; Coppi 1992) or belong to ambient thermal photon fields (external inverse Compton models;
e.g. Melia & K¨onigl 1989; Sikora, Begelman & Rees 1994; Der- mer & Schlickeiser 1994). In hadronic models, which can also ex- plain the observed features, interactions of a highly relativistic jet outflow with ambient matter (Dar & Laor 1997; Bednarek 1993), proton-induced cascades (Mannheim 1993), synchrotron radiation by protons (Aharonian 2000; M¨ucke & Protheroe 2001), or cur- vature radiation, are responsible for the high energy photons. The AGN identified in the EGRET data are predominantly powerful FS- RQs and quasars with SEDs peaking at rather low frequencies, and thus only few of these (Mkn 421, PKS 2155-304, BL Lacertae and 3C 279) were also detected in the VHE range.
Knowing the variability time-scales of the VHEγ-ray emis- sion and the form of the two-bump spectral energy distribution (SED) enables the derivation of all input parameters of one-zone SSC models (Tavecchio et al. 1998), which describe the observed emission in BL Lac objects reasonably well. Strictly simultaneous and temporally-resolved measurements of the SED, however, are only rarely possible and more often than not are also severely re- stricted by the (temporal) instrumental resolution. Generally, de- tailed spectral studies particularly in low-emission states are rather demanding. In addition, the determination of the location of the high-energy peak νICpeak generally would require complementary satellite detector coverage of the SED between some hundred MeV and≈50 GeV. This region of the SED, however, is difficult to ac- cess due to the low fluxes expected (up to≈100 MeV) from extra- galactic sources in between the two bumps and due to insufficient instrumental sensitivity for energies exceeding some GeVs.
In this paper, for the first time studies of the VHE emission properties of the complete set of all currently known VHE blazars (cf. Tab. 1) are performed. First, the detected VHE blazars are brought into context with the AGN searches conducted by IACTs so far and the expectedγ-ray attenuation by the EBL in Sect. 2. Af- ter a study of the black hole mass distribution of the VHE blazars in Sect. 3, I infer intrinsic emission properties in the VHEγ-ray regime in Sect. 4. Because measurements of the location and shape of the high-energy bump are elusive at present for almost all VHE blazars, the observedγ-ray luminosity and spectral slope in the VHE region are used as auxiliary observables to characterise the
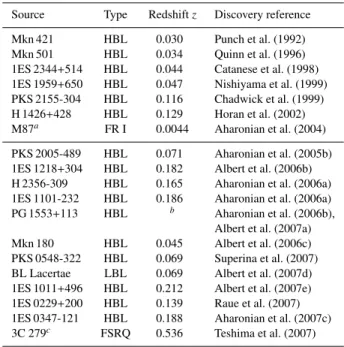
Table 1.Extragalactic VHEγ-ray sources, listed in chronological order of their discovery.
Source Type Redshiftz Discovery reference
Mkn 421 HBL 0.030 Punch et al. (1992)
Mkn 501 HBL 0.034 Quinn et al. (1996)
1ES 2344+514 HBL 0.044 Catanese et al. (1998) 1ES 1959+650 HBL 0.047 Nishiyama et al. (1999) PKS 2155-304 HBL 0.116 Chadwick et al. (1999) H 1426+428 HBL 0.129 Horan et al. (2002) M87a FR I 0.0044 Aharonian et al. (2004) PKS 2005-489 HBL 0.071 Aharonian et al. (2005b) 1ES 1218+304 HBL 0.182 Albert et al. (2006b) H 2356-309 HBL 0.165 Aharonian et al. (2006a) 1ES 1101-232 HBL 0.186 Aharonian et al. (2006a) PG 1553+113 HBL b Aharonian et al. (2006b),
Albert et al. (2007a) Mkn 180 HBL 0.045 Albert et al. (2006c) PKS 0548-322 HBL 0.069 Superina et al. (2007) BL Lacertae LBL 0.069 Albert et al. (2007d) 1ES 1011+496 HBL 0.212 Albert et al. (2007e) 1ES 0229+200 HBL 0.139 Raue et al. (2007) 1ES 0347-121 HBL 0.188 Aharonian et al. (2007c) 3C 279c FSRQ 0.536 Teshima et al. (2007) The upper part of the table shows the confirmed sources prior to the advent of new generation instruments like MAGIC and H.E.S.S., while the lower panel summarises the sources discovered after 2002. HBL: High-frequency peaked BL Lac object, LBL: Low-frequency peaked BL Lac object, FSRQ:
Flat spectrum radio quasar, FR: Fanaroff–Riley galaxy.a M87 is not in- cluded in the present study.bThis redshift is currently under discussion, cf.
Sect. 5.6.cNo spectrum of 3C 279 has been published yet.
VHEγ-ray emission. The main part of the paper (Sect. 5.1–5.5) is devoted to the search for correlations of these observables with the X-ray emission properties, the optical and the radio luminos- ity, and with the black hole mass estimations. In Sect. 5.6 the VHE blazar luminosity distribution is used to address the specific prob- lem of the unknown redshift of PG 1553+113 by deriving an upper redshift for this VHE blazar. Finally, Sect. 5.7 turns to the study of X-ray and VHEγ-ray timing properties. Sect. 6 summarises the main conclusions of the studies.
2 POPULATION STUDIES AND THEγ-RAY HORIZON When travelling cosmological distances, VHEγ-rays interact with the low-energy photons of the EBL (see, e.g. Nikishov 1962;
Gould & Schr´eder 1966; Hauser & Dwek 2001; Kashlinsky 2005).
The predominant reactionγVHE+γEBL →e+e−modifies source- intrinsic γ-ray energy spectra. The cross-section of this process peaks strongly atECM=1.8×2mec2, therefore a given VHE pho- ton energy probes a narrow range of the EBL spectrum. The part of the EBL to which VHEγ-rays are sensitive comprises the (red- shifted) relic emission of galaxies and star-forming systems and the light absorbed and re-emitted by dust. The EBL attenuation results in a maximum distance over which photons with a partic- ular energy can survive: The Fazio-Stecker relation (FSR, Fazio
& Stecker 1970; Stecker, de Jager & Salamon 1992) describes the distance at which the optical depth for a VHE photon of a given en- ergy reaches unity (attenuation by a factor e−1). Thus the FSR de- fines thecosmologicalγ-ray horizon. Fig. 2a shows the instrumen- tal low-energy thresholds from searches for VHEγ-ray emission
from AGN. Along with these, the FSR for different EBL models as given by Kneiske et al. (2004) is plotted. The models differ in the IR density, dust properties and the star formation rate in the early Universe. The FSR divides the plot into a region from which noγ- rays can reach the Earth and into another region, in which positive detections are to be expected or a too weak source-intrinsic emis- sion made detections fail (due to insufficient instrumental sensitiv- ity). Obviously, with a decreasing instrumental energy threshold, the visible Universe ‘opens up’, providing access to a larger source population. Current EBL models result in a steepening of the in- trinsic spectra from≈200 GeV on (power-law spectra are softened, but their shape is approximately retained), while for lower energies the effects are minimal. When an optical depth of one is reached, a quasi-exponential cutoffin the observed spectra occurs. Fig. 2b shows the energy ranges over which blazars in VHEγ radiation have been detected. Up to now, only for the strong, close-by blazars Mkn 421 and Mkn 501 indications of the expected exponential high energy cutoffhave been observed thanks to highγstatistics (Aha- ronian et al. 2001a; Krennrich et al. 2001; Albert et al. 2007c). The observed spectra of all other blazars can be accurately described by power-laws or broken power-laws. While most of the nearby VHE blazars cannot constrain the current EBL models, some of the sources atz>0.1 start challenging these (Aharonian et al. 2006a, 2007c; Teshima et al. 2007), as no cutoffs have been observed so far at the high-energy ends of theirγ-ray spectra.
3 BLACK HOLE MASSES IN BLAZARS
It is well established that all galaxies with a massive bulge com- ponent host supermassive black holes in their centres (Richstone et al. 1998; Bender & Kormendy 2003). There are a couple of in- direct methods to infer the masses of the central BHs: One is to estimateM•using the correlation betweenM•and the central ve- locity dispersionσof the host galaxy (M•−σrelation, Ferrarese
& Merritt 2000; Gebhardt et al. 2000) found from stellar and gas kinematics and maser emission. I estimated the black hole masses of VHEγ-ray emitting blazars using the M• −σ relation given by Tremaine et al. (2002). This approach assumes that AGN host galaxies are similar to non-active galaxies. The velocity dispersions were collected from the literature or are inferred from the funda- mental plane (Djorgovski & Davis 1987), a relation betweenσ, the effective galaxy radiusRe, and the corresponding surface bright- nesshµei, which is valid for elliptical galaxies, in particular also for AGN and radio galaxies (Bettoni et al. 2001). Whenever more than oneσvalue is given in the literature, individual masses were derived for each of theσvalues and averaged. Theσvalues and the resulting black hole masses for the VHEγ-ray blazars studied here are given in Tab. 2.
The determination ofM•suffers from rather large systematic uncertainties due to the different methods used to deriveσ. The relation betweenM•and bulge luminosityLB(Kormendy & Rich- stone 1995) has generally a larger scatter than theM•−σrelation and was therefore only used for PKS 2155-304, because for this blazar noσorhµeimeasurement is available. I used theR-band luminosity given by Falomo (1996) to calculate log(M•/M) = 8.98±0.44 using eq. 12 in Graham (2007). Aharonian et al. (2007b) give an estimate of M• = (1. . .2)×109M. For a compara- tive study using values inferred by different methods is not ad- visable due to possible different systematics. Therefore, the M•
value used for PKS 2155-304 should be taken with care in the fol- lowing. The BH mass of 3C 279 was determined using the virial c
Redshift z
10-3 10-2 10-1 1
Energy [GeV]
102 103 104
EBL models Low-IR Warm-dust Low star formation rate Best-fit
Upper limits HEGRA H.E.S.S.
Whipple VERITAS CANGAROO MAGIC
(a)
Redshift z
10-3 10-2 10-1 1
Energy [GeV]
102 103 104
EBL models Low-IR Warm-dust Low star formation rate Best-fit
(b)
Optical Depth < 1
Optical Depth > 1
Figure 2.(a) Lower energy thresholds from searches for VHEγ-ray emission from AGN. Dots: blazars, crosses: other AGN types (starburst galaxies, radio galaxies, etc.). The curves represent Fazio–Stecker relations (flux attenuation by a factor e−1) for different EBL models given by Kneiske et al. (2004). Data from searches by HEGRA (Aharonian et al. 2004), H.E.S.S. (Aharonian et al. 2005c; Benbow & B¨uhler 2007), Whipple (Kerrick et al. 1995; Horan et al.
2004), VERITAS (Cogan 2007; Krawczynski 2007), CANGAROO (Nishijima 2002) and MAGIC (Albert et al. 2008). (b) Detected VHEγ-ray sources (see Tab. 3 for references). Shown are the energy ranges of the measuredγ-ray spectra; high-energy cutoffs were found only for Mkn 421 and Mkn 501, for all other sources arrows represent spectra possibly continuing to higher energies. The dashed lines represent PG 1553+113 at the lower and upper limit for its redshift, z>0.09 (Sbarufatti et al. 2006) andz<0.74 (Aharonian et al. 2006b; Albert et al. 2007a).
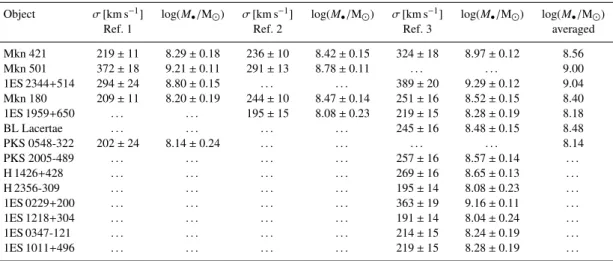
Table 2.Measured velocity dispersions and resulting estimated black hole masses for the VHE blazars.
Object σ[km s−1] log(M•/M) σ[km s−1] log(M•/M) σ[km s−1] log(M•/M) log(M•/M)
Ref. 1 Ref. 2 Ref. 3 averaged
Mkn 421 219±11 8.29±0.18 236±10 8.42±0.15 324±18 8.97±0.12 8.56
Mkn 501 372±18 9.21±0.11 291±13 8.78±0.11 . . . . . . 9.00
1ES 2344+514 294±24 8.80±0.15 . . . . . . 389±20 9.29±0.12 9.04
Mkn 180 209±11 8.20±0.19 244±10 8.47±0.14 251±16 8.52±0.15 8.40
1ES 1959+650 . . . . . . 195±15 8.08±0.23 219±15 8.28±0.19 8.18
BL Lacertae . . . . . . . . . . . . 245±16 8.48±0.15 8.48
PKS 0548-322 202±24 8.14±0.24 . . . . . . . . . . . . 8.14
PKS 2005-489 . . . . . . . . . . . . 257±16 8.57±0.14 . . .
H 1426+428 . . . . . . . . . . . . 269±16 8.65±0.13 . . .
H 2356-309 . . . . . . . . . . . . 195±14 8.08±0.23 . . .
1ES 0229+200 . . . . . . . . . . . . 363±19 9.16±0.11 . . .
1ES 1218+304 . . . . . . . . . . . . 191±14 8.04±0.24 . . .
1ES 0347-121 . . . . . . . . . . . . 214±15 8.24±0.19 . . .
1ES 1011+496 . . . . . . . . . . . . 219±15 8.28±0.19 . . .
References: (1) Barth, Ho & Sargent (2003); (2) Falomo, Kotilainen & Treves (2002); (3) Wu, Liu & Zhang (2002). The velocity dispersionsσwere translated into estimated BH masses using theM•−σrelation from Tremaine et al. (2002). Theσvalues taken from Wu et al. (2002) were indirectly determined using the fundamental plane of radio galaxies (Bettoni et al. 2001). BH masses given in units of the solar mass, M. If more than oneM•value is given, the averageM• is used. Due to the possible different systematic errors of the individual data sets, the largest error was assumed as error of the averageM•.
BH mass estimate of McLure & Dunlop (2002) and is given as log(M•/M) =8.912 by Gu et al. (2001). For two of the blazars under study, PG 1553+113 and 1ES 1101-232, noM• estimations exist yet.
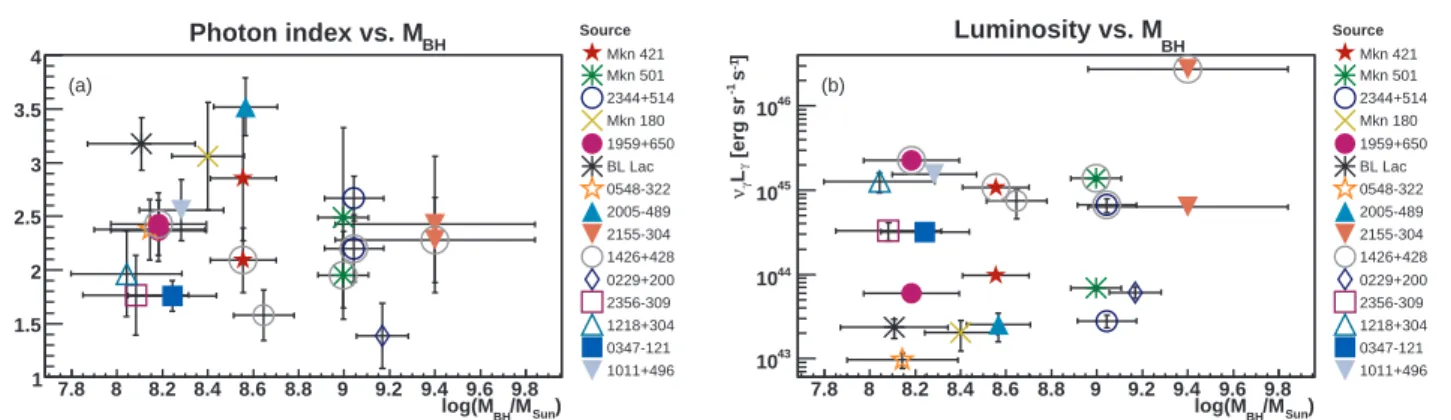
Recent estimations of the BH masses for 452 AGN find them distributed over a large range of (106−7×10⁹) Mwith no evidence for dependencies on the radio loudness of the objects (Woo & Urry 2002a,b). A recent study of the BH mass distribution of 66 BL Lac objects (Woo et al. 2005) reports anM•range of (107−4×10⁹) M and could also not find a correlation ofM•with radio or X-ray lu- minosity. (In Sect. 5.5 the distribution of VHE blazars in luminosity andM•is discussed). As Fig. 3 shows, there is no dependence of the BH masses of the VHE blazars on their redshift, but they are rather flatly distributed in their BH masses between (108−109.5)M. Al- though AGN harbour BHs with M• > 106M, up to now only blazars with rather massive BHs,M• &108M, have been discov- ered in VHEγ-rays, raising the question whether a physics reason
is responsible for the non-detection of blazars with less massive BHs in the mass range (107−108) M. There exist studies that find radio-loud AGN, and therefore also blazars, to be associated with BHs withM• & 109M(Laor 2000) or at least on average with more massive BHs than radio-quiet AGN (Metcalf & Magliocchetti 2006). The latter authors also report a threshold BH mass for the onset of radio activity, with very little dependence of the radio out- put on the BH mass once above the threshold mass. Whether such a mass threshold is also at work for the VHE emission, remains subject for further studies at this point. The BH masses of the VHE blazars are compared to those of 375 AGN collected by Woo &
Urry (2002a) in Fig. 4. The confinement of Seyfert galaxy mea- surements to low redshifts presumably is due to a selection effect:
These are spiral galaxies and therefore expected to harbour compar- atively low-mass BHs. Distant Seyfert galaxies (z&1.0) might just not be luminous enough to obtainM• measurements. Conversely,
Sun)
BH/M log(M
6 6.5 7 7.5 8 8.5 9 9.5 10
Redshift z
0.02 0.1 0.2 0.3 0.4 0.5
Source Mkn 421 Mkn 501 2344+514 Mkn 180 1959+650 BL Lac 0548-322 2005-489 2155-304 1426+428 0229+200 2356-309 1218+304 0347-121 1011+496 3C 279
Figure 3.Redshift vs.M•distribution for the known VHEγ-ray emitting AGN. The superimposed histogram shows the BH mass distribution of the 375 AGN given in Fig. 4 (linear vertical scale independent ofz).
Sun)
BH/M log(M
6 6.5 7 7.5 8 8.5 9 9.5 10
Redshift z
0.001 0.01 0.1 1
AGN class emitters γ VHE BL Lac Radio-loud quasar Radio-quiet quasar Radio galaxies Seyfert 1 Seyfert 2
Figure 4.The redshift vs.M•distribution for 375 AGN collected by Woo & Urry (2002a) and the known VHEγ-ray emitting AGN.
quasars are too rare as to be found in small volumes and thus at small distances.
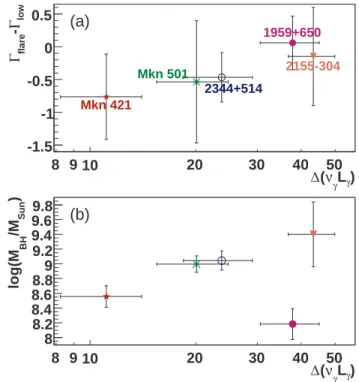
4 INTRINSIC VHEγ-RAY EMISSION PARAMETERS VHEγ-ray observations enable us to look deep into the emission regions of blazar jets and thus convey information on the respon- sible particle acceleration and cooling processes. Here I study pri- marily the differential energy spectra in the VHE domain, which are summarised in Tab. 3. For the sources Mkn 421, Mkn 501, PKS 2155-304, 1ES 1959+650, and 1ES 2344+514 observations of clearly distinct flux states exist. Accordingly, for each of those sources two spectra, one ‘low-state’ and one ‘high-state’ spectrum, are considered. Low-state spectra are characterised by the absence of high (& 0.2 Crab units1) flux levels and short-term variabil- ity (probably beyond instrumental sensitivity though), while flare spectra were obtained during outbursts of the respective sources (viz.the 1995 December 20 flare of 1ES 2344+514, the 1997 flare
1 The Crab nebula exhibits a strong, constant VHEγ-ray flux and is there- fore often considered a standard candle in VHEγ-ray astronomy
of Mkn 501, the 2002 flare of 1ES 1959+650 and the 2006 July 28 flare of PKS 2155-304). At present for none of these sources, even for those with only one flux state, can a true baseline flux state be claimed, although low-flux states have been observed (Albert et al.
2006a, 2007b). Long-term monitoring campaigns are currently per- formed to address this issue (Goebel et al. 2007; Steele et al. 2007;
Punch 2007).
The measured spectra sufferγγabsorption on photons of the EBL as shown in Sect. 2. The intrinsic source spectra are recon- structed employing (Mazin 2003) the EBL ‘low-IR’ model given in Kneiske et al. (2004), which assumes the least possible infrared star formation rate as allowed by galaxy counts and which is in reason- able agreement with other models (Primack, Bullock & Somerville 2005; Stecker, Malkan & Scully 2006). Note that due to the fact that the VHEγ-rays are attenuated exponentially with the optical depth, an accurate knowledge of the EBL is crucial for the individ- ual interpretation of the intrinsic VHEγ-ray spectra.
In the following, I will use two observables to characterise the VHEγ-ray emission: TheK-corrected (Hogg et al. 2002) luminos- ity at 500 GeV,νγLγ=4πd2L·(500 GeV)2F(500 GeV/(1+z))/(1+z) with the luminosity distance dL and the intrinsic photon index Γin the region around 500 GeV, which is determined by fitting c
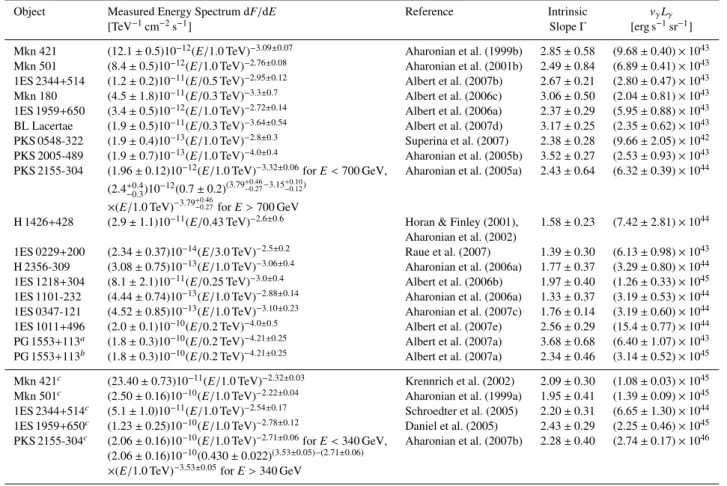
Table 3.Measured VHE blazar spectra, reconstructed intrinsic spectral indices and luminosities.
Object Measured Energy Spectrum dF/dE Reference Intrinsic νγLγ
[TeV−1cm−2s−1] SlopeΓ [erg s−1sr−1]
Mkn 421 (12.1±0.5)10−12(E/1.0 TeV)−3.09±0.07 Aharonian et al. (1999b) 2.85±0.58 (9.68±0.40)×1043 Mkn 501 (8.4±0.5)10−12(E/1.0 TeV)−2.76±0.08 Aharonian et al. (2001b) 2.49±0.84 (6.89±0.41)×1043 1ES 2344+514 (1.2±0.2)10−11(E/0.5 TeV)−2.95±0.12 Albert et al. (2007b) 2.67±0.21 (2.80±0.47)×1043 Mkn 180 (4.5±1.8)10−11(E/0.3 TeV)−3.3±0.7 Albert et al. (2006c) 3.06±0.50 (2.04±0.81)×1043 1ES 1959+650 (3.4±0.5)10−12(E/1.0 TeV)−2.72±0.14 Albert et al. (2006a) 2.37±0.29 (5.95±0.88)×1043 BL Lacertae (1.9±0.5)10−11(E/0.3 TeV)−3.64±0.54 Albert et al. (2007d) 3.17±0.25 (2.35±0.62)×1043 PKS 0548-322 (1.9±0.4)10−13(E/1.0 TeV)−2.8±0.3 Superina et al. (2007) 2.38±0.28 (9.66±2.05)×1042 PKS 2005-489 (1.9±0.7)10−13(E/1.0 TeV)−4.0±0.4 Aharonian et al. (2005b) 3.52±0.27 (2.53±0.93)×1043 PKS 2155-304 (1.96±0.12)10−12(E/1.0 TeV)−3.32±0.06forE<700 GeV, Aharonian et al. (2005a) 2.43±0.64 (6.32±0.39)×1044
(2.4+0.4−0.3)10−12(0.7±0.2)(3.79+0.46−0.27−3.15+0.10−0.12)
×(E/1.0 TeV)−3.79+0.46−0.27forE>700 GeV
H 1426+428 (2.9±1.1)10−11(E/0.43 TeV)−2.6±0.6 Horan & Finley (2001), 1.58±0.23 (7.42±2.81)×1044 Aharonian et al. (2002)
1ES 0229+200 (2.34±0.37)10−14(E/3.0 TeV)−2.5±0.2 Raue et al. (2007) 1.39±0.30 (6.13±0.98)×1043 H 2356-309 (3.08±0.75)10−13(E/1.0 TeV)−3.06±0.4 Aharonian et al. (2006a) 1.77±0.37 (3.29±0.80)×1044 1ES 1218+304 (8.1±2.1)10−11(E/0.25 TeV)−3.0±0.4 Albert et al. (2006b) 1.97±0.40 (1.26±0.33)×1045 1ES 1101-232 (4.44±0.74)10−13(E/1.0 TeV)−2.88±0.14 Aharonian et al. (2006a) 1.33±0.37 (3.19±0.53)×1044 1ES 0347-121 (4.52±0.85)10−13(E/1.0 TeV)−3.10±0.23 Aharonian et al. (2007c) 1.76±0.14 (3.19±0.60)×1044 1ES 1011+496 (2.0±0.1)10−10(E/0.2 TeV)−4.0±0.5 Albert et al. (2007e) 2.56±0.29 (15.4±0.77)×1044 PG 1553+113a (1.8±0.3)10−10(E/0.2 TeV)−4.21±0.25 Albert et al. (2007a) 3.68±0.68 (6.40±1.07)×1043 PG 1553+113b (1.8±0.3)10−10(E/0.2 TeV)−4.21±0.25 Albert et al. (2007a) 2.34±0.46 (3.14±0.52)×1045 Mkn 421c (23.40±0.73)10−11(E/1.0 TeV)−2.32±0.03 Krennrich et al. (2002) 2.09±0.30 (1.08±0.03)×1045 Mkn 501c (2.50±0.16)10−10(E/1.0 TeV)−2.22±0.04 Aharonian et al. (1999a) 1.95±0.41 (1.39±0.09)×1045 1ES 2344+514c (5.1±1.0)10−11(E/1.0 TeV)−2.54±0.17 Schroedter et al. (2005) 2.20±0.31 (6.65±1.30)×1044 1ES 1959+650c (1.23±0.25)10−10(E/1.0 TeV)−2.78±0.12 Daniel et al. (2005) 2.43±0.29 (2.25±0.46)×1045 PKS 2155-304c (2.06±0.16)10−10(E/1.0 TeV)−2.71±0.06forE<340 GeV, Aharonian et al. (2007b) 2.28±0.40 (2.74±0.17)×1046
(2.06±0.16)10−10(0.430±0.022)(3.53±0.05)−(2.71±0.06)
×(E/1.0 TeV)−3.53±0.05forE>340 GeV
Γdenotes the reconstructed (intrinsic) VHE spectral power-law index at 500 GeV andνγLγrepresents the source luminosity at 500 GeV. Both values were calculated from the measured spectra assuming a Kneiske et al. ‘low-IR’ EBL density.aat an assumedz=0.1.bat an assumedz=0.3.cspectrum measured during a flare state of the respective blazar.
the intrinsic spectra with pure power-laws of the form dF/dE = f0 ·(E/E0)−Γ. These two parameters act as proxies for the peak position and the spectral shape on the falling edge of the high- energy bump, which cannot, as explained before, easily be deter- mined from the existing VHE data. For extraction of the luminosity and of the spectral slope, the region around 500 GeV was chosen because all blazars under study have measured spectra in this en- ergy region. All calculations and fits have been performed in en- ergy ranges whereγ-ray spectra for the respective blazars have ac- tually been observed, so that no extrapolations in energy regions not covered by the data were required. All in all, extragalactic source observations included in this paper cover the energy range 85 GeV6E611 TeV. For the determination of the luminosity dis- tances the cosmological parameters given in Spergel et al. (2007) were used:Ωmh2=0.127+0.007−0.013;Ωbh2=0.0223+0.0007−0.0009with the Hub- ble constantH0=100·hkm s−1Mpc−1=73+3−3km s−1Mpc−1.
Tab. 3 also shows the resulting source luminosities in the VHE region and the spectral slope of the reconstructed source-intrinsic spectra. While the luminosities range from ≈ 1043erg s−1sr−1 to
≈3×1045erg s−1sr−1(≈1045erg s−1sr−1to≈3×1046erg s−1sr−1 for blazars in outburst), the photon indices of the reconstructed in- trinsic spectra vary betweenΓ = 1.4−3.3, except for 1ES 1101- 232, which probably has an intrinsic spectrum peaking far beyond E = 1 TeV (Aharonian et al. 2007a). The VHE measurements lie close to, but generally above the maximum of the high-energy
bump (which occurs atΓ = 2). Spectra withΓ <1.5 are difficult to explain in current acceleration models (Malkov & Drury 2001;
Aharonian et al. 2006a; but see Katarzy´nski et al. 2006a,b; Stecker et al. 2007 for models that would explain harder spectra). The rather hard intrinsic slopes found for some sources go in line with indica- tions that the EBL absorption effects are still smaller than currently modelled (e.g. Aharonian et al. 2006a): a lower EBL level would soften the intrinsic spectra inferred here, i.e. increase the value of Γ.
Before instruments like MAGIC and H.E.S.S. became opera- tional, the average observed photon index in BL Lac objects was Γ ≈2.3. This raised the expectation that AGN would in general exhibit rather hard spectra in the VHE range, which also would be compatible with the average EGRET blazar spectrum (at MeV- GeV energies), found to have a slope ofΓEGRET=2.27 (Venters &
Pavlidou 2007). In fact, the average spectral slope at VHE has not changed much, although the scatter ofΓincreased as a new pop- ulation of objects with intrinsically rather soft spectra (Mkn 180, PKS 2005-489) has been tapped, and at the same time distant, hard- spectrum sources were found.
For PG 1553+113 with its unknown redshift (see Sect. 5.6 for details), two possible distances (z = 0.1,z =0.3) were assumed in this paper. The resulting ‘intrinsic spectra’, however, are only given for illustrative purposes and are not used for any conclusions throughout this study unless stated otherwise.
-1]
-1 s [erg sr LX
νX
1044 1045
]-1 s-1 [erg srγLγν
1043
1044
1045
Source Mkn 421 Mkn 501 2344+514 Mkn 180 1959+650 BL Lac 0548-322 2005-489 2155-304 1426+428 0229+200 2356-309 1218+304 1101-232 0347-121 1011+496 1553+113
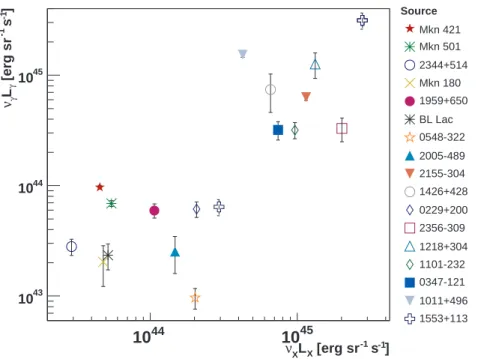
Figure 5.VHEγ-ray luminosityνγLγvs. X-ray luminosity at 1 keV,νXLXfor 17 VHE blazars. The two data points for PG 1553+113 (open crosses) are for assumed redshifts ofz=0.1 (νγLγ=6.4×1043erg sr−1s−1) andz=0.3 (νγLγ=3.1×1045erg sr−1s−1), respectively, and are not used in the fit and for determining the correlation coefficient (see text). It should be noted that VHE data points have an additional systematic error of typically 35 per cent. The systematic error of the X-ray luminosities is unfortunately unknown.
5 CORRELATION STUDIES
5.1 Correlation of X-ray, optical, radio and VHEγ-ray luminosity
In SSC models, the X-ray and the VHE emission are closely con- nected, owing to their common origin. While in some blazars clear evidence for a corresponding correlation has been observed (Mkn 421, Krawczynski et al. 2001; Bła˙zejowski et al. 2005; Albert et al.
2007c), the connection is only weak for other ones (Mkn 501, Al- bert et al. 2007f) or even non-existing during some flare states (the 1ES 1959+650orphan flarecase, Daniel et al. 2005). Fig. 5 shows νγLγ versus the X-ray luminosity at 1 keV (νXLX; from Costamante & Ghisellini 2002). Note that high thermal contribu- tions at 1 keV are unlikely and would imply a very high amount of gas and pressure. Unfortunately, the X-ray and VHE data have not been taken simultaneously. While VHE measurements during outbursts were not used in the Figure, variations in the X-ray do- main for the blazars under study are, according to the compilation of X-ray fluxes in Donato et al. (2001), not larger than a factor 4.6 (most extreme object: Mkn 501) with an average of a factor 1.4 and a variance of 2.2. According to expectations, a trend towards a correlation is visible. When including all data points except for those representing PG 1553+113, I find a correlation coefficient of r=0.76+0.09−0.14, which is within 3.6 standard deviations different from zero. A linear fit to the data yields a slope ofm = 1.11±0.09 (χ2red=61.8/14).
Recently, optical triggers lead to the successful discoveries of the VHE blazars Mkn 180 (Albert et al. 2006c) and 1ES 1011+496 (Albert et al. 2007e). At times of lower optical emission the latter in fact showed a lower flux and thus only yielded a marginal detection (Albert et al. 2008). This seems to imply the existence of a VHE – optical connection, which would be a convenient proxy for finding new VHE blazars. However, in the past no (Bła˙zejowski et al. 2005;
Rebillot et al. 2006; Albert et al. 2007a) or only weak (Buckley et al. 1996) evidence for optical or radio to VHE correlations was found for individual observations of Mkn 421 and PG 1553+113.
The optical flux data at 5500 Å used here were collected from several source catalogues by Costamante & Ghisellini (2002), as were the radio flux data at 5 GHz. I converted them into luminosi- ties taking into account the appropriate luminosity distancesdL. Fig. 6 shows the corresponding correlations: the data in the VHE – optical plane feature a larger scatter than that in the VHE – X-ray data, while in the VHE – radio plane no clear trend is seen.
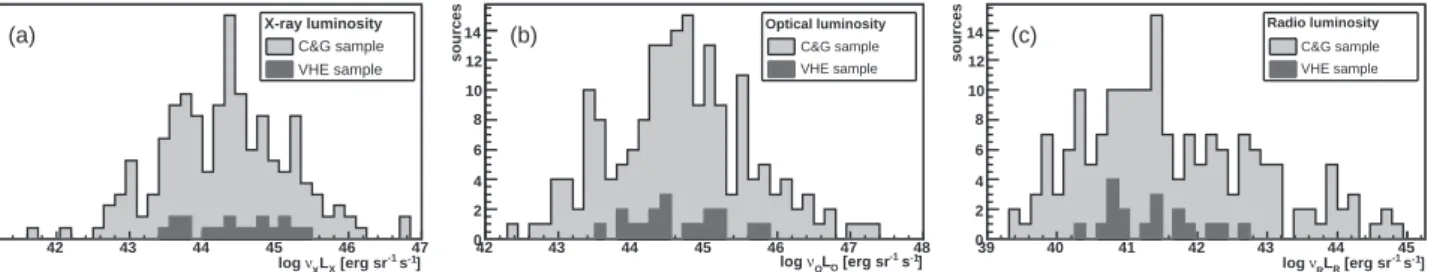
VHE blazars might populate only restricted ranges in X-ray, optical, or radio luminosity distributions. To test this, I use X-ray, optical and radio data from the full set of 246 sources considered by Costamante & Ghisellini (2002). I rejected the sources for which no redshift is known and converted the remaining 183 fluxes into luminosities. These blazars are compared to the VHE blazars in Fig. 7. In none of the three distributions can substantial deviations of the VHE blazars from the overall set of blazars be found.
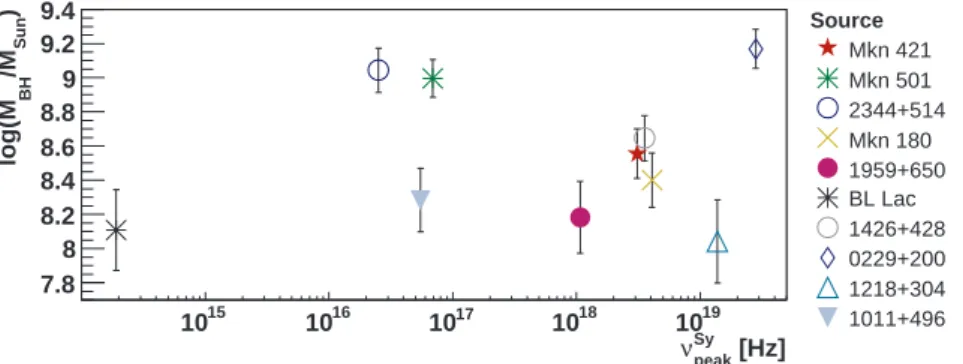
5.2 Correlations of intrinsic photon index and VHE luminosity with the synchrotron peak frequency
In SSC models the VHE peak, identified with the inverse Comp- ton (IC) peak with a maximum atνICpeak, resembles the form (e.g.
Fossati et al. 1998) of the synchrotron peak at νSypeak, displaced by the squared Lorentz factorνICpeak/νSypeak ∼ γ2 (Tavecchio et al.
1998). Nieppola, Tornikoski & Valtaoja (2006) collected (non- simultaneous) multiwavelength data for a large (> 300) set of blazars, which includes eleven of the VHE blazars under study here. The data, covering frequencies from the 5 GHz radio to the 2.4 keV X-ray domain, were used by Nieppola et al. to reconstruct the SEDs of these blazars and to infer the synchrotron peak frequency νpeak. I test for correlations betweenνSypeakand the VHE luminosity c