arXiv:1102.0277v2 [astro-ph.HE] 25 Apr 2011
A. A. Abdo 1 , M. Ackermann 2 , M. Ajello 2 , A. Allafort 2 , L. Baldini 3 , J. Ballet 4 , G. Barbiellini 5,6 , D. Bastieri 7,8 , R. Bellazzini 3 , B. Berenji 2 , R. D. Blandford 2 , E. D. Bloom 2 , E. Bonamente 9,10 , A. W. Borgland 2 , A. Bouvier 11 , J. Bregeon 3 , M. Brigida 12,13 , P. Bruel 14 , R. Buehler 2 , S. Buson 7,8 ,
G. A. Caliandro 15 , R. A. Cameron 2 , P. A. Caraveo 16 , J. M. Casandjian 4 , E. Cavazzuti 17 , C. Cecchi 9,10 , E. Charles 2 , A. Chekhtman 18 , C. C. Cheung 1 , J. Chiang 2 , S. Ciprini 10 , R. Claus 2 ,
J. Conrad 19,20,21 , S. Cutini 17 , F. D’Ammando 22,23 , A. de Angelis 24 , F. de Palma 12,13 , C. D. Dermer 25,26 , S. W. Digel 2 , E. do Couto e Silva 2 , P. S. Drell 2 , R. Dubois 2 , D. Dumora 27 ,
L. Escande 27,28,29 , C. Favuzzi 12,13 , S. J. Fegan 14 , E. C. Ferrara 30 , P. Fortin 14 , Y. Fukazawa 31 , P. Fusco 12,13 , F. Gargano 13 , D. Gasparrini 17 , N. Gehrels 30 , S. Germani 9,10 , N. Giglietto 12,13 ,
P. Giommi 17 , F. Giordano 12,13 , M. Giroletti 32 , T. Glanzman 2 , G. Godfrey 2 , I. A. Grenier 4 , J. E. Grove 25 , S. Guiriec 33 , D. Hadasch 15 , M. Hayashida 2 , E. Hays 30 , D. Horan 14 , R. Itoh 31 , G. J´ ohannesson 34 , A. S. Johnson 2 , T. Kamae 2 , H. Katagiri 31 , J. Kataoka 35 , J. Kn¨ odlseder 36,37 , M. Kuss 3 , J. Lande 2 , S. Larsson 19,20,38 , L. Latronico 3 , S.-H. Lee 2 , F. Longo 5,6 , F. Loparco 12,13 ,
B. Lott 27,39 , M. N. Lovellette 25 , P. Lubrano 9,10 , G. M. Madejski 2 , A. Makeev 40 ,
M. N. Mazziotta 13 , W. McConville 30,41 , J. E. McEnery 30,41 , P. F. Michelson 2 , W. Mitthumsiri 2 , T. Mizuno 31 , A. A. Moiseev 42,41 , C. Monte 12,13 , M. E. Monzani 2 , A. Morselli 43 ,
I. V. Moskalenko 2 , S. Murgia 2 , M. Naumann-Godo 4 , S. Nishino 31 , P. L. Nolan 2 , J. P. Norris 44 , E. Nuss 45 , T. Ohsugi 46 , A. Okumura 47 , E. Orlando 48,2 , J. F. Ormes 44 , D. Paneque 49,2 , V. Pelassa 45 , M. Pesce-Rollins 3 , M. Pierbattista 4 , F. Piron 45 , T. A. Porter 2 , S. Rain`o 12,13 ,
R. Rando 7,8 , S. Razzaque 40 , A. Reimer 50,2 , O. Reimer 50,2 , S. Ritz 11 , M. Roth 51 ,
H. F.-W. Sadrozinski 11 , D. Sanchez 14 , J. D. Scargle 52 , T. L. Schalk 11 , C. Sgr` o 3 , E. J. Siskind 53 , P. D. Smith 54 , G. Spandre 3 , P. Spinelli 12,13 , M. S. Strickman 25 , H. Takahashi 46 , T. Takahashi 47 , T. Tanaka 2 , Y. Tanaka 47 , J. G. Thayer 2 , J. B. Thayer 2 , D. J. Thompson 30 , L. Tibaldo 7,8,4,55 ,
D. F. Torres 15,56 , G. Tosti 9,10 , A. Tramacere 2,57,58 , E. Troja 30,59 , J. Vandenbroucke 2 , V. Vasileiou 45 , G. Vianello 2,57 , N. Vilchez 36,37 , V. Vitale 43,60 , A. P. Waite 2 , P. Wang 2 ,
B. L. Winer 54 , K. S. Wood 25 , Z. Yang 19,20 , M. Ziegler 11
1
National Research Council Research Associate, National Academy of Sciences, Washington, DC 20001, resident at Naval Research Laboratory, Washington, DC 20375
2
W. W. Hansen Experimental Physics Laboratory, Kavli Institute for Particle Astrophysics and Cosmology, De- partment of Physics and SLAC National Accelerator Laboratory, Stanford University, Stanford, CA 94305, USA
3
Istituto Nazionale di Fisica Nucleare, Sezione di Pisa, I-56127 Pisa, Italy
4
Laboratoire AIM, CEA-IRFU/CNRS/Universit´e Paris Diderot, Service d’Astrophysique, CEA Saclay, 91191 Gif sur Yvette, France
5
Istituto Nazionale di Fisica Nucleare, Sezione di Trieste, I-34127 Trieste, Italy
6
Dipartimento di Fisica, Universit` a di Trieste, I-34127 Trieste, Italy
7
Istituto Nazionale di Fisica Nucleare, Sezione di Padova, I-35131 Padova, Italy
8
Dipartimento di Fisica “G. Galilei”, Universit` a di Padova, I-35131 Padova, Italy
9
Istituto Nazionale di Fisica Nucleare, Sezione di Perugia, I-06123 Perugia, Italy
10
Dipartimento di Fisica, Universit` a degli Studi di Perugia, I-06123 Perugia, Italy
11
Santa Cruz Institute for Particle Physics, Department of Physics and Department of Astronomy and Astrophysics, University of California at Santa Cruz, Santa Cruz, CA 95064, USA
12
Dipartimento di Fisica “M. Merlin” dell’Universit` a e del Politecnico di Bari, I-70126 Bari, Italy
13
Istituto Nazionale di Fisica Nucleare, Sezione di Bari, 70126 Bari, Italy
14
Laboratoire Leprince-Ringuet, ´ Ecole polytechnique, CNRS/IN2P3, Palaiseau, France
15
Institut de Ciencies de l’Espai (IEEC-CSIC), Campus UAB, 08193 Barcelona, Spain
16
INAF-Istituto di Astrofisica Spaziale e Fisica Cosmica, I-20133 Milano, Italy
17
Agenzia Spaziale Italiana (ASI) Science Data Center, I-00044 Frascati (Roma), Italy
18
Artep Inc., 2922 Excelsior Springs Court, Ellicott City, MD 21042, resident at Naval Research Laboratory, Washington, DC 20375
19
Department of Physics, Stockholm University, AlbaNova, SE-106 91 Stockholm, Sweden
20
The Oskar Klein Centre for Cosmoparticle Physics, AlbaNova, SE-106 91 Stockholm, Sweden
21
Royal Swedish Academy of Sciences Research Fellow, funded by a grant from the K. A. Wallenberg Foundation
22
IASF Palermo, 90146 Palermo, Italy
23
INAF-Istituto di Astrofisica Spaziale e Fisica Cosmica, I-00133 Roma, Italy
24
Dipartimento di Fisica, Universit` a di Udine and Istituto Nazionale di Fisica Nucleare, Sezione di Trieste, Gruppo Collegato di Udine, I-33100 Udine, Italy
25
Space Science Division, Naval Research Laboratory, Washington, DC 20375, USA
26
email: charles.dermer@nrl.navy.mil
27
Universit´e Bordeaux 1, CNRS/IN2p3, Centre d’´ Etudes Nucl´eaires de Bordeaux Gradignan, 33175 Gradignan, France
28
CNRS/IN2P3, Centre d’´ Etudes Nucl´eaires Bordeaux Gradignan, UMR 5797, Gradignan, 33175, France
29
email: escande@cenbg.in2p3.fr
30
NASA Goddard Space Flight Center, Greenbelt, MD 20771, USA
31
Department of Physical Sciences, Hiroshima University, Higashi-Hiroshima, Hiroshima 739-8526, Japan
32
INAF Istituto di Radioastronomia, 40129 Bologna, Italy
33
Center for Space Plasma and Aeronomic Research (CSPAR), University of Alabama in Huntsville, Huntsville, AL 35899
34
Science Institute, University of Iceland, IS-107 Reykjavik, Iceland
35
Research Institute for Science and Engineering, Waseda University, 3-4-1, Okubo, Shinjuku, Tokyo 169-8555, Japan
36
CNRS, IRAP, F-31028 Toulouse cedex 4, France
37
Universit´e de Toulouse, UPS-OMP, IRAP, Toulouse, France
38
Department of Astronomy, Stockholm University, SE-106 91 Stockholm, Sweden
39
email: lott@cenbg.in2p3.fr
40
Center of Earth Observation and Space Research, College of Science, George Mason University, Fairfax, VA 22030, resident at Naval Research Laboratory, Washington, DC 20375
41
Department of Physics and Department of Astronomy, University of Maryland, College Park, MD 20742
42
Center for Research and Exploration in Space Science and Technology (CRESST) and NASA Goddard Space Flight Center, Greenbelt, MD 20771
43
Istituto Nazionale di Fisica Nucleare, Sezione di Roma “Tor Vergata”, I-00133 Roma, Italy
44
Department of Physics and Astronomy, University of Denver, Denver, CO 80208, USA
45
Laboratoire de Physique Th´eorique et Astroparticules, Universit´e Montpellier 2, CNRS/IN2P3, Montpellier, France
46
Hiroshima Astrophysical Science Center, Hiroshima University, Higashi-Hiroshima, Hiroshima 739-8526, Japan
47
Institute of Space and Astronautical Science, JAXA, 3-1-1 Yoshinodai, Chuo-ku, Sagamihara, Kanagawa 252- 5210, Japan
48
Max-Planck Institut f¨ ur extraterrestrische Physik, 85748 Garching, Germany
49
Max-Planck-Institut f¨ ur Physik, D-80805 M¨ unchen, Germany
50
Institut f¨ ur Astro- und Teilchenphysik and Institut f¨ ur Theoretische Physik, Leopold-Franzens-Universit¨ at Inns- bruck, A-6020 Innsbruck, Austria
51
Department of Physics, University of Washington, Seattle, WA 98195-1560, USA
52
Space Sciences Division, NASA Ames Research Center, Moffett Field, CA 94035-1000, USA
53
NYCB Real-Time Computing Inc., Lattingtown, NY 11560-1025, USA
54
Department of Physics, Center for Cosmology and Astro-Particle Physics, The Ohio State University, Columbus, OH 43210, USA
55
Partially supported by the International Doctorate on Astroparticle Physics (IDAPP) program
56
Instituci´ o Catalana de Recerca i Estudis Avan¸cats (ICREA), Barcelona, Spain
ABSTRACT
The flat-spectrum radio quasar 3C454.3 underwent an extraordinary 5-day γ-ray outburst in November 2010 when the daily flux measured with the Fermi Large Area Telescope (LAT) at photon energies E > 100 MeV reached (66 ± 2) × 10
−6 ph cm
−2 s
−1 . This is a factor of 3 higher than its previous maximum flux recorded in December 2009
and & 5 times brighter than the Vela pulsar, which is normally the brightest source in
the γ-ray sky. The 3-hr peak flux was (85 ± 5) × 10
−6 ph cm
−2 s
−1 , corresponding to an apparent isotropic luminosity of (2.1 ± 0.2) × 10 50 erg s
−1 , the highest ever recorded for a blazar. In this paper, we investigate the features of this exceptional event in the γ-ray band of the Fermi-LAT. In contrast to previous flares of the same source observed with the Fermi-LAT, clear spectral changes are observed during the flare.
Subject headings: Galaxies: active
1. Introduction
The radio source 3C454.3, a well-known flat-spectrum radio quasar (FSRQ) at redshift z = 0.859, has shown remarkably high activity since 2000. It has been particularly bright in the γ -ray band covered by AGILE and the Fermi-LAT, reaching a daily record flux level F[E > 100 M eV ] (F 100 in units of 10
−6 ph cm
−2 s
−1 ) of 22 ± 1 in December 2009 (Striani et al. 2010; Ackermann et al.
2010). This high flux allowed detailed analysis to be performed, making it the best-studied blazar in the GeV band. Gamma-ray variability on timescales as short as a few hours (Tavecchio et al. 2010) and a flux-doubling time scale of less than 3 hours for a short subflare on 2009 Dec 5 (MJD55170, Ackermann et al. 2010) have been reported. In the LAT energy band, 3C454.3 exhibits a spectrum with a clear departure from a power-law distribution, characterized by a break around 2 GeV (Abdo et al. 2009). This is found to be a common feature of bright γ-ray FSRQs (Abdo et al.
2010d). Little variation of the break energy and spectra for large differences in flux states was observed for 3C454.3 (Ackermann et al. 2010). From γγ-opacity constraints, a minimum Doppler factor δ
min≈ 13 was derived from the flux variability time (Ackermann et al. 2010), and highest- energy photon measurements, in accord with independent measurements of δ from superluminal motion observations (Jorstad et al. 2005).
In November 2010, the source displayed sustained activity at a flux of F 100 ≈ 10 for several days before showing a fast rise to record levels of F 100 = 55, then rising to F 100 ≈ 80 (as measured
57
Consorzio Interuniversitario per la Fisica Spaziale (CIFS), I-10133 Torino, Italy
58
INTEGRAL Science Data Centre, CH-1290 Versoix, Switzerland
59
NASA Postdoctoral Program Fellow, USA
60
Dipartimento di Fisica, Universit` a di Roma “Tor Vergata”, I-00133 Roma, Italy
over 6 hr-long periods). In this paper, the intraday variability and the associated spectral changes in the γ-ray band of 3C454.3 are studied and comparisons are made with the findings obtained from earlier major flares. In Section 2, observations and analysis of Fermi-LAT data from 2010 September 1 to December 13 are presented. Results are presented in Section 3 and discussion is given in Section 4. A flat ΛCDM cosmology with H 0 = 71 km s
−1 Mpc
−1 , Ω
m= 0.27 and Ω Λ =0.73 is used in this paper.
2. Observations and analysis
The analysis performed for this paper is very similar to that reported in Ackermann et al.
(2010), to which we refer for details. The data presented in this paper are restricted to the 100 MeV–200 GeV range and were collected from MJD55440 (2010 September 1) to MJD55543 (2010 December 13) in survey mode.
Spectral analyses were performed by fitting the spectra with multiple different models over the whole energy range covered by the LAT at E > 100MeV. The spectral forms considered are a broken power law (BPL, N (E) = N 0 (E/E break )
−Γ
i, with i = 1 if E < E break and i = 2 if E > E break ), a log-parabola function (N (E) = N 0 (E/E
p)
−α−βlog(E/E
p) , where E
pis fixed at 1 GeV), a power law with exponential cutoff function (PLEC, N (E) = N 0 (E/E
p)
−Γ exp( − E/E cutoff )), and a PL model over equally spaced logarithmic energy bins with Γ kept constant and equal to the value fitted over the whole range.
Source variability was investigated by producing light curves with various time binnings (3hours, 6 hours, 1 day, 1 week) and over different energy ranges (E>100 MeV, E>1 GeV, E=0.1-1 GeV).
Although the actual spectral shape exhibits definite curvature, light curves were produced by mod- eling the spectra in each time bin as a simple power law (PL) over the considered energy range, since the statistical uncertainties on the power-law indices are smaller than those obtained from BPL fits. In order to minimize spurious correlations between integrated flux and Γ, the fluxes F
E>E0were also computed above the “decorrelation energy” E 0 where this correlation is minimal.
For the 2009 December and 2010 April flares, E 0 was found to be 163MeV (Ackermann et al. 2010).
The same value has been used here for consistency. The estimated systematic uncertainty on the flux is 10% at 100 MeV, 5% at 500 MeV and 20% at 10 GeV. The energy resolution is better than 10% over the range of measured E break .
3. Results
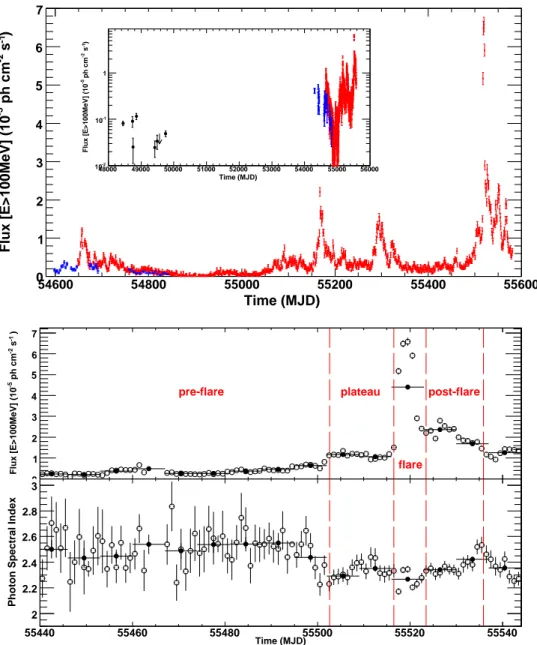
Figure 1 (top panel) showing the historical F 100 light curve illustrates the spectac-
ular rise in activity of 3C454.3 over the years. It is evident that the December 2010
outburst dwarfs any previously recorded flares. The second panel displays the light
curves with time binnings of 1-day (open circles) and 1-week (filled circles) during the
outburst period. A 13-day-long plateau precedes the 5-day-long flare, confirming the trend pre- viously observed in the July 2008 and December 2009 flares, but it is longer in duration and higher in flux than those in previous flares (Ackermann et al. 2010). The onset of this plateau is clearly accompanied by a weak but significant hardening of the spectrum (Γ changes from 2.50 ± 0.02 to 2.32 ± 0.03), as observed on a weekly time scale in the bottom panel of Figure 1. The daily flux decreases by a factor of about 3 in 4 days at the end of the flare. The flare is followed by a slowly decaying activity around F 100 = 20. Different time periods labeled pre-flare, plateau, flare and post-flare in Figure 1 are considered in the following.
The light curves for F 100 with 6-hr and 3-hr time binnings (focusing on the flare period) are shown in the upper panel of Figure 2. The F[E > 1 GeV] light curves with 6-hr and 3-hr time binnings are given in the second panel of Figure 2. The corresponding evolution of Γ is plotted in the third and bottom panels. As can be seen, the major flare lasts for about 5 days. In the F 100 light curves, it seems to comprise three to four subflares, with the flux peaking during the last one.
The rise time of the MJD55516.5 flare is 12 hours for a factor of 4 increase in flux (i.e., a doubling time of 6 hours). This is shorter than the previous fastest relative flux variation claimed in the GeV band for a major flare, which was from PKS 1502+106, when an increase by a factor of 3 in 12 hours (i.e., a doubling time of 7.5 hours) was found (Abdo et al. 2010c). In the upper panel of Figure 2, a fit consisting of a slowly varying background and four faster temporally evolving components was performed between MJD55516.5 and MJD55522 for both the 6-hr and 3-hr light curves. Each component is assumed to be fit by a function of the form
F = 2F 0 (e (t
0−t)/Tr+ e (t
−t0)/T
f)
−1 (1) (Abdo et al. 2010b), where T
rand T
fare the rising and falling times, respectively, and F 0 is the flux at t 0 representing approximately the flare amplitude. With the rise time T
rset equal for all subflares, and likewise for the fall time T
f, we find that T
r= 4.5 ± 1hr and T
f= 15 ± 2hr gives a good fit to both the 3-hr and 6-hr light curves. The highest-energy photon collected during the MJD55516-55522 period within the energy and inclination angle-dependent 95% containment angle around the source position has E
max= 31 ± 3GeV and was detected at MJD55521.46. Its detection time is depicted with an arrow in the upper panel of Figure 2.
Significant differences between light curves for fluxes in the E=0.1-1 GeV (F 0.1
−1 GeV ) and E> 1 GeV (F 1GeV ) ranges are observed (see the second panel of Figure 2). The peak of the first subflare occurs approximately 15 hr after F 0.1
−1GeV has leveled off, demonstrating clear spectral variability. This behavior is confirmed by a progressive decrease of Γ (spectral hardening) from Γ ≈ 2.35 to Γ ≈ 2.1 as the subflare develops beyond the 100 MeV peak (black points in the third panel of Figure 2). Overall, the F 1GeV light curve shows sharper structures than the F 0.1
−1GeV light curve. A clear difference is also observed in the decaying stage, with the high-energy component starting to fade away later than the lower-energy component. In the lower two panels of Figure 2, the spectral indices obtained over the two restricted energy ranges are shown as well. As F 0.1
−1 GeV
levels off in the first subflare while F 1 GeV keeps rising, the 0.1 − 1 GeV index is fairly constant,
indicating that the hardening is limited to the range above 1 GeV. This hardening is confirmed by the evolution of Γ measured in the > 1 GeV range (blue points in the bottom panel in Figure 2).
The pronounced spectral evolution observed during the flare can be further investigated by plotting Γ versus the flux above E 0 = 163 MeV. This is done, with a 6-hr binning in Figure 3 for two consecutive time periods covering approximately the first and second half of the major flare and two different photon energy ranges: E > 0.1 GeV and E = 0.1 − 1 GeV. For orientation, the points associated with the earlier times have labels corresponding to those given in the third panel of Figure 2. In addition, 4-day averages obtained during the plateau period are displayed as blue squares. In contrast to the 2009 December-2010 April flares for which no clear pattern was found in the data, a clockwise pattern is observed for the second period. The reduced χ 2
rfor a fit with a constant Γ are 37.6/8 (P = 8.9 × 10
−6 , ∼ 4.4σ) and 35.4/8 (P = 2.3 × 10
−5 , ∼ 4.2σ) for the first and second periods, respectively (for the E > 0.1 GeV case). For the first period, a flux increase by a factor of 4 is accompanied by an essentially constant Γ (or one becoming weakly harder). This is followed by a clear hardening of the spectrum at constant flux, with Γ changing from 2.24 ± 0.06 to 2.11 ± 0.04 in 12 hours.
Such a hard lag can also be observed in the top right-hand panel of Figure 3, where a hardening by ∆ Γ = 0.42 ± 0.13, associated with the decaying stage of the flare, occurs over 2.25 days. The spectrum softens fairly quickly afterward, with Γ changing from 2.0 ± 0.1 to 2.31 ± 0.07 in 6 hours.
This behavior may be driven by cooling. During the flare, the electron energy distributions may reflect the alternative dominance of acceleration and cooling processes.
Restricting the analysis to the E=0.1-1 GeV range (bottom panels in Figure 3) produces a pattern similar to the E>0.1 GeV case for the second period, but somewhat different for the first period, although the patterns are less clear due to larger statistical uncertainties. The rise in flux is accompanied by a pronounced hardening in this energy range followed by a state of essentially constant spectral hardness evolving into a slow softening. This behavior confirms the conclusions obtained in the context of Figure 2. Due to insufficient statistics, no clear pattern of the photon spectral index above 1 GeV vs flux can be observed with 6-hr time binning.
Figure 4 shows the ν F
νdistributions of the Fermi-LAT data for the four different time periods
delineated in Figure 1. These distributions have been fitted with BPL (solid), log-parabola function
(dashed), and PLEC (dashed-dotted) functions. The parameters of the different fits can be found
in the Table1. As the likelihood method does not provide an absolute goodness-of-fit measure,
the χ 2 of the ν F
νdata points for the different functions have been calculated. For the pre-flare
and plateau periods, both BPL and PLEC give fits of similar quality, while the log-parabola fit
is notably worse. The PLEC function is preferred for the post-flare period. None of the tested
functions provides a very good fit to the energy distribution in that period, which may be a result
of the significant spectral evolution during the flare. The ν F
νspectra obtained over time intervals
where the four subflares alternatively dominate are consistent for the first three subflares in terms
of curvature, while a significantly harder spectrum is observed between MJD55520.0-55521.5. In
that interval, the PLEC fit gives E cutoff =8.3 ± 1.7 GeV. A total of 10 photons with E > 10 GeV (out of 12 detected during the entire 5-day flare) were collected in that 1.5-day time lapse (second panel of Figure 2). The variation of E break and E cutoff with flux are displayed in the inset of Figure 4. As already found during the 2009 December and 2010 April flares, no strong evolution of either E break or E cutoff is found. E break remains constant within a factor of ≈ 2 while the flux varies by a factor of ≈ 40.
4. Discussion
During its five-day outburst from 2010 November 17 to 21 (flare interval in Figure 1), 3C454.3 was the brightest GeV γ-ray source in the sky, with a flux F 100 = 66 ± 2 on 2010 November 18–19.
Prior to the flaring phase, the Fermi-LAT light curve displays a 13-day long flux plateau preceding the major outburst. The onset of the plateau is marked by a rapid (< 1) day flux increase by a factor of ≈ 2. This feature appears to be a characteristic behavior indicating that 3C454.3 is about to flare, as noted in Ackermann et al. (2010). In the December 2009 flare, the plateau lasted for 6 days at a level of F 100 ≈ 10 before flaring to a daily flux of ≈ 22, while for the April 2010 outburst, it lasted for 7 days at a level of F 100 ≈ 7 before reaching a peak flux of ≈ 16. The spectrum hardens slightly from the pre-flare to the plateau preceding the giant flare. Spectral hardening and clustering of photons with E > 10 GeV is also seen in the decaying stage of the gamma-ray outburst at MJD55520.0-55521.5, which could point to the presence of radiating hadrons or γγ- absorption effects. In the former case, protons require additional time to accelerate and cool while the < 1 GeV flux, if due to rapidly cooling electrons, would decline more rapidly. In the latter case, the emergence of the hard component could occur if the radiating plasma becomes optically thin to γγ-absorption, either due to a larger bulk Lorentz factor or increased size of the radiating plasma.
The features of the giant flare can be compared to those of the two earlier, fainter flares (December 2009 and April 2010) that have been carefully investigated in the LAT energy band (the different observation mode used during most of the July 2008 flare provided poorer-quality data). The overall light curves show similarities (presence of a preflare plateau, main flare lasting a few days, several week-long fading period). The rise time T
rof the November 2010 flare is about half that of the December 2009 flare (4.5 hr vs 8.9 hr). Whereas the latter showed indication of
“flickering” activity on timescales as short as 3 hours above 100 MeV, this effect is not clearly present here, as demonstrated by similar 3-hr and 6-hr light curves in Figure 1. For the first time, a significant temporary hardening of the spectrum leading to Γ ≃ 2.1 has been observed for 3C454.3.
Note that in the first LAT AGN catalog (Abdo et al. 2010a), less than 2% of FSRQs are found
with 11-month averaged Γ <2.1. The moderately hard spectrum during the large luminosity flare
deviates from the trend seen in the blazar divide (Ghisellini et al. 2009), where the most γ -ray
luminous blazars generally have Γ & 2.5. Despite the overall spectral variation, the energy cutoff
remains essentially unchanged as observed in earlier flares (Figure 4). Interestingly, several-day
long spectral variations are also observed during the postflare period (beyond MJD55524 in Figure
1). No such effect was found in previous flares despite sufficient measurement statistical accuracy.
Significant spectral hardening at the end of the main flare was not seen either.
The minimum Doppler factor δ
mincan be numerically evaluated from γγ-opacity constraints.
From Swift-XRT public data, the total energy flux in the 2–10 keV range is 0.8 × 10
−10 erg cm
−2 s
−1 and the photon-number index is 1.70. Correlated X-ray and GeV variability supports the assump- tion that the γ-rays are made co-spatially with the X-rays. At the time that the 31-GeV photon was observed, t
var=0.4 d (taken as ln(2) × T
fin the fading phase of the flare), giving δ
min= 16, which is somewhat larger than the value of δ
min= 13 found by Ackermann et al. (2010). The estimated comoving size of the emission region is R
′= c t
varδ
min/(1 + z) ≈ 3 × 10 15 cm. For the 31-GeV photon, the optical depth to pair production by the extragalactic background light (EBL) is ≈ 1 for the high-EBL model of Stecker et al. (2006), so no absorption constraints are provided by these data.
An upper limit on the optical depth τ
γγ(E
max) ≈ 2 arising from the interaction of γ rays with broad-line-region (BLR) photons can be obtained by comparing the flux measured at E
max=31GeV, with the flux extrapolated from lower energy. Assuming a BLR luminosity of 3 × 10 45 erg s
−1 (Pian et al.
2005) and adopting a BLR size r
BLR≈ 6 × 10 17 cm ≈ 0.2 pc from reverberation mapping (Kaspi et al. 2007; Bonnoli et al. 2011), we calculate τ
γγ(z
em), where z
emis the distance of the emitting blob from the black hole (following Reimer 2007). Assuming that the BLR clouds are distributed between 0.01 pc and r
BLR, the condition τ
γγ(E
max) = 2 is satisfied for z
em≃ 0.14 pc.
Therefore the emission region must have been located either close to the outer boundary of the BLR or beyond at the time of emission of the 31-GeV photon.
The asymmetry of the time profiles derived for the subflares can be produced by accelera- tion/radiative losses or light-travel effects in quasi-spherical emission regions (Sikora et al. 2001;
Dermer 2004). Assuming a spherical geometry of the emission region, then r < 2c Γ 2 t
var/(1 + z) ≈ 0.1 pc for a bulk Lorentz factor Γ = δ
min= 16 and a variability time scale t
var≃ 0.4 d. If the jet opening angle θ
j≪ 1/δ
min≃ 3
◦, then this estimate can be compatible with the location estimated above.
The 3-hr peak F 100 is 85 ± 5, corresponding to an apparent isotropic γ-ray luminosity L
γ= 10 50 L 50 erg s
−1 with L 50 = 2.1 ± 0.2, assuming a spectral shape for the flare as given in Table 1.
This is ≈ 4 times the luminosity of PKS 1622 − 297 (L 50 ≃ 0.5 with the current cosmological model)
during its 1995 flare (Mattox et al. 1997), making this the largest γ-ray luminosity ever observed
for a blazar. (Foschini et al. (2011) derived a luminosity of L 50 ≈ 3.0 during this flare by assuming
a power-law shape and considering a short 4.7 ks time interval where F 100 & 100.) During the
5-day flare, F 100 = 43 ± 1 implies L 50 ≃ 1.0. The black hole mass for 3C454.3 is estimated to be in
the range of (0.5–4) × 10 9 M
⊙(Bonnoli et al. 2011; Gu et al. 2001), so L Edd ≈ (0.6–5) × 10 47 erg s
−1 .
In order for the time-averaged flare luminosity to be lower than L Edd , θ
j. 2
◦–6
◦, and a beaming
factor (1 − cosθ
j)
−1 & 200–1700 is implied. For highly efficient γ -ray production, the absolute jet
power is comparable to the disk luminosity of L
d=6.75 × 10 46 erg s
−1 estimated in Bonnoli et al.
(2011).
This flaring episode marks a record among AGNs and, indeed, all non-GRB sources for its rate of change in apparent luminosity, L
γ/∆t. Using a 6-hour variability time scale, then L
γ/∆t ≃ 10 50 L 50 erg s
−1 /(10 4 t 4 s) ≃ 10 46 L 50 /t 4 ergs
−2 , noting that 6 hr/(1+z) ≃ 10 4 s. By comparison, the giant flares of PKS2155 − 304 (Aharonian et al. 2007) reached only . 10 47 erg s
−1 /300s ≈ 3 × 10 44 erg s
−2 (in the TeV regime). This value now greatly exceeds L Edd /(R S /c) ≈ 1.3 × 10 43 erg s
−2 given by the ratio of the Eddington luminosity and the light crossing time across the Schwarzschild radius of a black hole, and strongly violates optically thin, Eddington-limited accretion scenarios (Elliot & Shapiro 1974), showing that such a condition is unlikely to apply to the highly asymmetric disk/jet system of a blazar.
We thank the AGILE team for providing their published data points.
The Fermi-LAT Collaboration acknowledges support from a number of agencies and institutes for both development and the operation of the LAT as well as scientific data analysis. These include NASA and DOE in the United States, CEA/Irfu and IN2P3/CNRS in France, ASI and INFN in Italy, MEXT, KEK, and JAXA in Japan, and the K. A. Wallenberg Foundation, the Swedish Research Council and the National Space Board in Sweden. Additional support from INAF in Italy and CNES in France for science analysis during the operations phase is also gratefully acknowledged.
REFERENCES Abdo, A. A., et al. 2009, ApJ, 699, 817
—. 2010a, ApJ, 715, 429
—. 2010b, ApJ, 722, 520
—. 2010c, ApJ, 710, 810
—. 2010d, ApJ, 710, 1271
Ackermann, M., et al. 2010, ApJ, 721, 1383 Aharonian, F., et al. 2007, ApJ, 664, L71
Bonnoli, G., Ghisellini, G., Foschini, L., Tavecchio, F., & Ghirlanda, G. 2011, MNRAS, 410, 368 Dermer, C. D. 2004, ApJ, 614, 284
Elliot, J. L., & Shapiro, S. L. 1974, ApJ, 192, L3+
Foschini, L., Ghisellini, G., Tavecchio, F., Bonnoli, G., & Stamerra, A. 2011, ArXiv e-prints 1101.1085
Ghisellini, G., Maraschi, L., & Tavecchio, F. 2009, MNRAS, 396, L105 Gu, M., Cao, X., & Jiang, D. R. 2001, MNRAS, 327, 1111
Hartman, R. C., et al. 1999, ApJS, 123, 79 Jorstad, S. G., et al. 2005, AJ, 130, 1418
Kaspi, S., Brandt, W. N., Maoz, D., Netzer, H., Schneider, D. P., & Shemmer, O. 2007, ApJ, 659, 997
Mattox, J. R., Wagner, S. J., Malkan, M., McGlynn, T. A., Schachter, J. F., Grove, J. E., Johnson, W. N., & Kurfess, J. D. 1997, ApJ, 476, 692
Pian, E., Falomo, R., & Treves, A. 2005, MNRAS, 361, 919 Reimer, A. 2007, ApJ, 665, 1023
Sikora, M., B la˙zejowski, M., Begelman, M. C., & Moderski, R. 2001, ApJ, 554, 1 Stecker, F. W., Malkan, M. A., & Scully, S. T. 2006, ApJ, 648, 774
Striani, E., et al. 2010, ApJ, 718, 455
Tavecchio, F., Ghisellini, G., Bonnoli, G., & Ghirlanda, G. 2010, MNRAS, 405, L94
This preprint was prepared with the AAS L
ATEX macros v5.2.
Time (MJD)
54600 54800 55000 55200 55400 55600
)
-1s
-2ph cm
-5Flux [E>100MeV] (10
0 1 2 3 4 5 6 7
Time (MJD)
48000 49000 50000 51000 52000 53000 54000 55000 56000 )-1 s-2 ph cm-5Flux [E>100MeV] (10
10-2 10-1 1
55440 55460 55480 55500 55520 55540
)-1 s-2 ph cm-5Flux [E>100MeV] (10
0 1 2 3 4 5 6 7
pre-flare plateau
flare
post-flare
Time (MJD)
55440 55460 55480 55500 55520 55540
Photon Spectral Index
2 2.2 2.4 2.6 2.8 3
Fig. 1.— Top, main figure: Daily light curve of 3C454.3 measured with the Fermi-
LAT since launch. Inset: Historical light curve. Black points are from EGRET
(Hartman et al. 1999) and blue points are from AGILE (Striani et al. 2010). Bot-
tom: Light curve of the flux F 100 (top) and Γ (bottom) for a 103-day period including both the
slowly increasing flux phase, the plateau, the flare and the post-flare. The open and filled symbols
correspond to daily and weekly averaged quantities respectively. Error bars are statistical only.
55514 55516 55518 55520 55522 55524 )-1 s-2 ph cm-3Flux [E>100MeV] (10
0 0.02 0.04 0.06 0.08 0.1
×10
55514 55516 55518 55520 55522 55524
)-1 s-2 ph cm-6Flux (10
0 1 2 3 4 5
×10
55514 55516 55518 55520 55522 55524
Photon Spectral Index
1.8 2 2.2 2.4 2.6 2.8
A’
A
B’
B C’
C
D’
D
Time (MJD)
55514 55516 55518 55520 55522 55524
Photon Spectral Index
2 2.5 3 3.5 4
Fig. 2.— Top panel: light curve of the flux above 100 MeV. Open and filled symbols correspond
to 3-hr and 6-hr averaged quantities respectively. The lines correspond to the results of a five-
component fit (four subflares and a slowly-varying background) as described in the text, using
the 6-hr data. The arrow depicts the detection time of the 31-GeV photon. Second panel: flux
F 0.1
−1GeV , multiplied by a factor of 0.05 (red); flux F 1GeV (blue). The blue histogram represents the
times of detection of E > 10 GeV photons. Third panel: Γ measured at E>100 MeV (black) and
E=100 MeV-1 GeV (red). Bottom panel: Γ measured at E>100 MeV (black), E=100 MeV-1 GeV
(red) and E>1 GeV (blue).
0 5 10 15 20 25 30 35 40 45 ×
Photon Spectral Index
1.8 1.9 2 2.1 2.2 2.3 2.4 2.5 2.6
E>0.1 GeV
A B
-1
)
-2
s ph cm ] (10
-6Flux [E>E
00 5 10 15 20 25 30 35 40 45 ×
Photon Spectral Index
1.8 1.9 2 2.1 2.2 2.3 2.4 2.5 2.6
E=0.1-1 GeV
A’
B’
0 5 10 15 20 25 30 35 40 45 ×
1.8 1.9 2 2.1 2.2 2.3 2.4 2.5 2.6
E>0.1 GeV
C D
-1)
-2 s ph cm ] (10-6
Flux [E>E0
0 5 10 15 20 25 30 35 40 45
1.8 × 1.9 2 2.1 2.2 2.3 2.4 2.5 2.6
E=0.1-1 GeV
C’
D’
Fig. 3.— Γ vs. flux above the decorrelation energy for two different periods of time during the flare, obtained with a 6-hr binning. Photons with energy above 0.1 GeV (top) or in the 0.1-1 GeV range (bottom) were used. In the left panels, the blue points correspond to 4-day averages in the
“plateau” period preceding the flare.
E (MeV)
10 2 10 3 10 4
) -1 s -2 (erg cm ν F ν
10 -11
10 -10
10 -9
10 -8
-1)
-2s ph cm Flux [E>100 MeV] (10-6
0 5 10 15 20 25 30 35 40 45
(GeV)cutoff or EbreakE
0 2 4 6 8 10 12 14
Hist. flares Nov. 2010 break cutoff