arXiv:1011.3855v3 [astro-ph.HE] 10 Jan 2011
Gamma-ray flares from the Crab Nebula
A. A. Abdo
1, M. Ackermann
2, M. Ajello
2, A. Allafort
2, L. Baldini
3, J. Ballet
4, G. Barbiellini
5,6, D. Bastieri
7,8, K. Bechtol
2, R. Bellazzini
3, B. Berenji
2, R. D. Blandford
2,∗, E. D. Bloom
2, E. Bonamente
9,10, A. W. Borgland
2, A. Bouvier
2, T. J. Brandt
11,12, J. Bregeon
3, A. Brez
3, M. Brigida
13,14, P. Bruel
15, R. Buehler
2,†, S. Buson
7,8, G. A. Caliandro
16, R. A. Cameron
2, A. Cannon
17,18, P. A. Caraveo
19, J. M. Casandjian
4, ¨ O. C ¸ elik
17,20,21, E. Charles
2, A. Chekhtman
22, C. C. Cheung
1, J. Chiang
2, S. Ciprini
10, R. Claus
2, J. Cohen-Tanugi
23, L. Costamante
2, S. Cutini
24, F. D’Ammando
25,26, C. D. Dermer
27, A. de Angelis
28, A. de Luca
29, F. de Palma
13,14, S. W. Digel
2, E. do Couto e Silva
2, P. S. Drell
2, A. Drlica-Wagner
2, R. Dubois
2, D. Dumora
30, C. Favuzzi
13,14, S. J. Fegan
15, E. C. Ferrara
17, W. B. Focke
2, P. Fortin
15, M. Frailis
28,31, Y. Fukazawa
32, S. Funk
2,‡, P. Fusco
13,14, F. Gargano
14, D. Gasparrini
24, N. Gehrels
17, S. Germani
9,10, N. Giglietto
13,14, F. Giordano
13,14, M. Giroletti
33, T. Glanzman
2, G. Godfrey
2, I. A. Grenier
4, M.-H. Grondin
30, J. E. Grove
27, S. Guiriec
34, D. Hadasch
16, Y. Hanabata
32, A. K. Harding
17, K. Hayashi
32, M. Hayashida
2, E. Hays
17, D. Horan
15, R. Itoh
32, G. J´ohannesson
35, A. S. Johnson
2, T. J. Johnson
17,36, D. Khangulyan
42, T. Kamae
2, H. Katagiri
32, J. Kataoka
37, M. Kerr
38, J. Kn¨odlseder
11, M. Kuss
3, J. Lande
2, L. Latronico
3, S.-H. Lee
2, M. Lemoine-Goumard
30, F. Longo
5,6, F. Loparco
13,14, P. Lubrano
9,10, G. M. Madejski
2, A. Makeev
22, M. Marelli
19, M. N. Mazziotta
14, J. E. McEnery
17,36, P. F. Michelson
2, W. Mitthumsiri
2, T. Mizuno
32, A. A. Moiseev
20,36, C. Monte
13,14, M. E. Monzani
2, A. Morselli
39, I. V. Moskalenko
2, S. Murgia
2, T. Nakamori
37, M. Naumann-Godo
4, P. L. Nolan
2, J. P. Norris
40, E. Nuss
23, T. Ohsugi
41, A. Okumura
42, N. Omodei
2, J. F. Ormes
40, M. Ozaki
42, D. Paneque
2, D. Parent
22, V. Pelassa
23, M. Pepe
9,10, M. Pesce-Rollins
3, M. Pierbattista
4, F. Piron
23, T. A. Porter
2, S. Rain`o
13,14, R. Rando
7,8, P. S. Ray
27, M. Razzano
3, A. Reimer
43,2, O. Reimer
43,2, T. Reposeur
30, S. Ritz
44, R. W. Romani
2, H. F.-W. Sadrozinski
44, D. Sanchez
15, P. M. Saz Parkinson
44, J. D. Scargle
45, T. L. Schalk
44, C. Sgr`o
3, E. J. Siskind
46, P. D. Smith
12, G. Spandre
3, P. Spinelli
13,14, M. S. Strickman
27, D. J. Suson
47, H. Takahashi
41, T. Takahashi
42, T. Tanaka
2, J. B. Thayer
2, D. J. Thompson
17, L. Tibaldo
7,8,4,48, D. F. Torres
16,49, G. Tosti
9,10, A. Tramacere
2,50,51, E. Troja
17,52, Y. Uchiyama
2, J. Vandenbroucke
2, V. Vasileiou
20,21, G. Vianello
2,50, V. Vitale
39,53, P. Wang
2, K. S. Wood
27, Z. Yang
54,55, M. Ziegler
441. National Research Council Research Associate, National Academy of Sciences, Wash-
ington, DC 20001, resident at Naval Research Laboratory, Washington, DC 20375, USA
2. W. W. Hansen Experimental Physics Laboratory, Kavli Institute for Particle Astrophysics
and Cosmology, Department of Physics and SLAC National Accelerator Laboratory, Stanford University, Stanford, CA 94305, USA
3. Istituto Nazionale di Fisica Nucleare, Sezione di Pisa, I-56127 Pisa, Italy
4. Laboratoire AIM, CEA-IRFU/CNRS/Universit´e Paris Diderot, Service d’Astrophysique, CEA Saclay, 91191 Gif sur Yvette, France
5. Istituto Nazionale di Fisica Nucleare, Sezione di Trieste, I-34127 Trieste, Italy 6. Dipartimento di Fisica, Universit`a di Trieste, I-34127 Trieste, Italy
7. Istituto Nazionale di Fisica Nucleare, Sezione di Padova, I-35131 Padova, Italy 8. Dipartimento di Fisica “G. Galilei”, Universit`a di Padova, I-35131 Padova, Italy 9. Istituto Nazionale di Fisica Nucleare, Sezione di Perugia, I-06123 Perugia, Italy 10. Dipartimento di Fisica, Universit`a degli Studi di Perugia, I-06123 Perugia, Italy
11. Centre d’ ´ Etude Spatiale des Rayonnements, CNRS/UPS, BP 44346, F-30128 Toulouse Cedex 4, France
12. Department of Physics, Center for Cosmology and Astro-Particle Physics, The Ohio State University, Columbus, OH 43210, USA
13. Dipartimento di Fisica “M. Merlin” dell’Universit`a e del Politecnico di Bari, I-70126 Bari, Italy
14. Istituto Nazionale di Fisica Nucleare, Sezione di Bari, 70126 Bari, Italy
15. Laboratoire Leprince-Ringuet, ´ Ecole polytechnique, CNRS/IN2P3, Palaiseau, France 16. Institut de Ciencies de l’Espai (IEEC-CSIC), Campus UAB, 08193 Barcelona, Spain 17. NASA Goddard Space Flight Center, Greenbelt, MD 20771, USA
18. University College Dublin, Belfield, Dublin 4, Ireland
19. INAF-Istituto di Astrofisica Spaziale e Fisica Cosmica, I-20133 Milano, Italy
20. Center for Research and Exploration in Space Science and Technology (CRESST) and NASA Goddard Space Flight Center, Greenbelt, MD 20771, USA
21. Department of Physics and Center for Space Sciences and Technology, University of
Maryland Baltimore County, Baltimore, MD 21250, USA
22. College of Science, George Mason University, Fairfax, VA 22030, resident at Naval Re- search Laboratory, Washington, DC 20375, USA
23. Laboratoire de Physique Th´eorique et Astroparticules, Universit´e Montpellier 2, CNRS/IN2P3, Montpellier, France
24. Agenzia Spaziale Italiana (ASI) Science Data Center, I-00044 Frascati (Roma), Italy 25. IASF Palermo, 90146 Palermo, Italy
26. INAF-Istituto di Astrofisica Spaziale e Fisica Cosmica, I-00133 Roma, Italy 27. Space Science Division, Naval Research Laboratory, Washington, DC 20375, USA 28. Dipartimento di Fisica, Universit`a di Udine and Istituto Nazionale di Fisica Nucleare,
Sezione di Trieste, Gruppo Collegato di Udine, I-33100 Udine, Italy 29. Istituto Universitario di Studi Superiori (IUSS), I-27100 Pavia, Italy
30. Universit´e Bordeaux 1, CNRS/IN2p3, Centre d’ ´ Etudes Nucl´eaires de Bordeaux Gradig- nan, 33175 Gradignan, France
31. Osservatorio Astronomico di Trieste, Istituto Nazionale di Astrofisica, I-34143 Trieste, Italy
32. Department of Physical Sciences, Hiroshima University, Higashi-Hiroshima, Hiroshima 739-8526, Japan
33. INAF Istituto di Radioastronomia, 40129 Bologna, Italy
34. Center for Space Plasma and Aeronomic Research (CSPAR), University of Alabama in Huntsville, Huntsville, AL 35899, USA
35. Science Institute, University of Iceland, IS-107 Reykjavik, Iceland
36. Department of Physics and Department of Astronomy, University of Maryland, College Park, MD 20742, USA
37. Research Institute for Science and Engineering, Waseda University, 3-4-1, Okubo, Shin- juku, Tokyo, 169-8555 Japan
38. Department of Physics, University of Washington, Seattle, WA 98195-1560, USA 39. Istituto Nazionale di Fisica Nucleare, Sezione di Roma “Tor Vergata”, I-00133 Roma,
Italy
40. Department of Physics and Astronomy, University of Denver, Denver, CO 80208, USA
41. Hiroshima Astrophysical Science Center, Hiroshima University, Higashi-Hiroshima, Hi- roshima 739-8526, Japan
42. Institute of Space and Astronautical Science, JAXA, 3-1-1 Yoshinodai, Chuo-ku, Sagami- hara, Kanagawa 252-5210, Japan
43. Institut f¨ur Astro- und Teilchenphysik and Institut f¨ur Theoretische Physik, Leopold- Franzens-Universit¨at Innsbruck, A-6020 Innsbruck, Austria
44. Santa Cruz Institute for Particle Physics, Department of Physics and Department of As- tronomy and Astrophysics, University of California at Santa Cruz, Santa Cruz, CA 95064, USA
45. Space Sciences Division, NASA Ames Research Center, Moffett Field, CA 94035-1000, USA
46. NYCB Real-Time Computing Inc., Lattingtown, NY 11560-1025, USA
47. Department of Chemistry and Physics, Purdue University Calumet, Hammond, IN 46323- 2094, USA
48. Partially supported by the International Doctorate on Astroparticle Physics (IDAPP) pro- gram
49. Instituci´o Catalana de Recerca i Estudis Avanc¸ats (ICREA), Barcelona, Spain 50. Consorzio Interuniversitario per la Fisica Spaziale (CIFS), I-10133 Torino, Italy 51. INTEGRAL Science Data Centre, CH-1290 Versoix, Switzerland
52. NASA Postdoctoral Program Fellow, USA
53. Dipartimento di Fisica, Universit`a di Roma “Tor Vergata”, I-00133 Roma, Italy
54. Department of Physics, Stockholm University, AlbaNova, SE-106 91 Stockholm, Sweden 55. The Oskar Klein Centre for Cosmoparticle Physics, AlbaNova, SE-106 91 Stockholm,
Sweden
† buehler@stanford.edu, * rdb3@stanford.edu , ‡funk@slac.stanford.edu
A young and energetic pulsar powers the well-known Crab Nebula. Here we describe two separate gamma-ray (photon energy >100 MeV) flares from this source detected by the Large Area Telescope on board the Fermi Gamma- ray Space Telescope. The first flare occurred in February 2009 and lasted approximately 16 days. The second flare was detected in September 2010 and lasted approximately 4 days. During these outbursts the gamma-ray flux from the nebula increased by factors of four and six, respectively. The brevity of the flares implies that the gamma rays were emitted via synchrotron radiation from PeV (10
15eV) electrons in a region smaller than 1.4 × 10
−2pc. These are the highest energy particles that can be associated with a discrete astronomical source, and they pose challenges to particle acceleration theory.
The Crab Nebula is the remnant of an historical supernova (SN), recorded in 1054 C.E., located at a distance of 2 kpc (1). The SN explosion left behind a pulsar, which continuously emits a wind of magnetized plasma of electron/positron pairs (henceforth referred to as elec- trons). This pulsar wind is expected to terminate in a standing shock where the particles may undergo shock acceleration (2, 3). As the electrons diffuse into the downstream medium they release energy through interactions with the surrounding magnetic and photon fields. This emis- sion is observed across all wavebands from radio up to TeV gamma-ray energies and is referred to as a pulsar wind nebula (PWN). The efficiency of this process is remarkable. As much as 30% of the total energy released by the Crab pulsar is emitted by the PWN [ (4) and references therein]. The Crab PWN has an approximately ellipsoidal shape on the sky with a size that decreases with increasing photon energy. At radio frequencies it extends out to 5
′(3 pc) from the central pulsar. At X-ray wavelengths a bright torus surrounds the pulsar; its radius is 40
′′(0.4 pc) and jets emerge perpendicular to it in both directions.
Within the region encapsulated by the torus there are several small-scale structures. The inner nebula, which we define as the central 15
′′around the pulsar, has several small-scale regions of variable X-ray and optical brightness. The most prominent is an X-ray-bright inner ring with a radius of 10
′′(0.1 pc); this ring is thought to represent the termination shock of the PWN (5). Several knots with diameters of ∼1
′′(0.01 pc) are detected close to the inner ring and the base of the jets, and bright arcs of comparable width are observed moving outwards from the inner ring into the torus (6, 7).
The broad-band spectral energy distribution (SED) of the Crab Nebula is composed of two
broad non-thermal components. A low-energy component dominates the overall output and ex-
tends from radio to gamma-ray frequencies. This emission is thought to be from synchrotron
radiation. This notion is confirmed in radio to X-ray frequencies with polarization measure-
ments (8–10). The emission of this synchrotron component peaks between optical and X-ray
frequencies, where the emission is primarily from the torus (5). The emission site of higher-
energy photons (beyond 100 keV) cannot be resolved due to the limited angular resolution of
telescopes observing at these frequencies. The high-energy component dominates the emission
above ∼ 400 MeV and is thought to be emitted via inverse Compton (IC) scattering, predomi-
nantly of the synchrotron photons (11, 12).
The large-scale integrated emission from the Crab Nebula is expected to be steady within a few percent and is thus often used to cross-calibrate X-ray and gamma-ray telescopes and to check their stability over time (13, 14). Recently, variability in the x-ray flux from the nebula by ∼3.5% yr
−1has been detected, setting limits on the accuracy of this practice (15). Yearly variations in the emission in the high-energy tail (1-150 MeV) of the synchrotron component has also been reported (16,17). No significant variations have been detected for the high-energy component of the nebula (18–20).
The Large Area Telescope (LAT) on board the Fermi Gamma-Ray Space Telescope (Fermi) has continuously monitored the Crab Nebula as a part of its all-sky survey since August 2008.
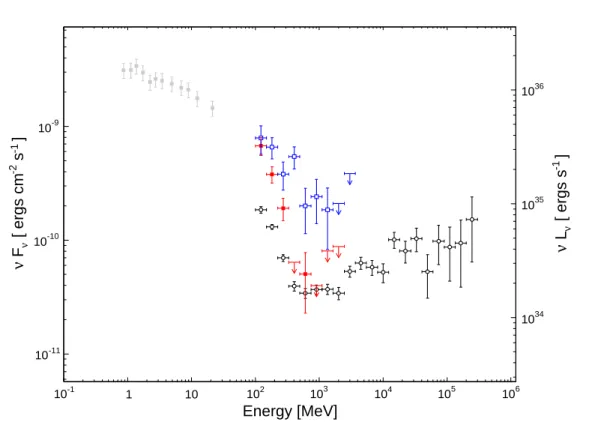
The LAT detects gamma rays from 20 MeV to >300 GeV, and this spans the transition region between the low and the high-energy components of the nebular spectrum. The average SED measured during the first 25 months of observations (Fig. 1) is well characterized by the sum of two spectral components, each with a power-law dependence on energy (21). The integrated flux of the low-energy component is (6.2 ± 0.3) × 10
−7cm
−2above 100 MeV with an photon index of 3.69 ± 0.11 (only statistical errors are given; see online supplements for a discussion of systematic errors). The high-energy component has an integral flux of (1.3 ± 0.1) × 10
−7cm
−2s
−1above 100 MeV with a photon index of 1.67 ± 0.04. Due to its hard energy spectrum the high-energy component dominates the emission above 426 ± 35 MeV.
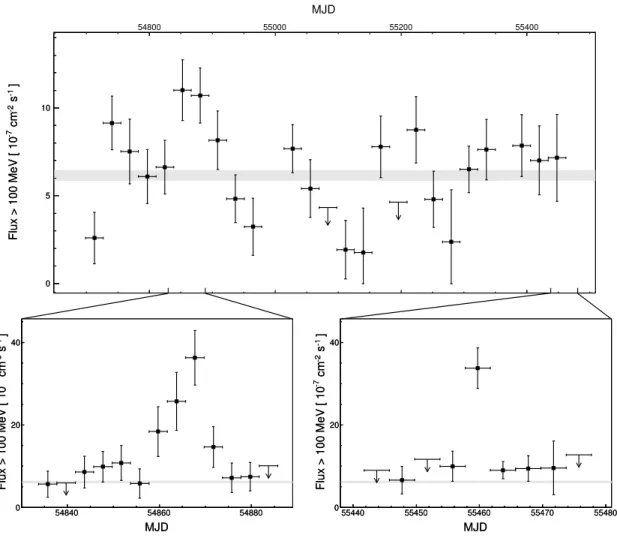
In order to search for flux variability of both spectral components in the LAT band, we grouped the flux measurements into monthly time bins. The high-energy component was found to be stable. The low-energy component was found to vary on these time scales (Fig. 2);
the probability that the measured flux variations are statistical measurement fluctuations in a constant source is less than 10
−5. No significant spectral variations were detected for either component on monthly time scales. Flux variability was also searched for on sub-monthly time scales, for which the low-energy component of the nebula is significantly detected by the LAT only in high-flux states. The flux of the low-energy component was significantly enhanced compared to the average values in February 2009 and September 2010 (Fig. 2). No variations were found for the high-energy component. The September flare was first announced by the AGILE gamma-ray mission (22), which additionally reports a flare in October 2007, before the start of Fermi observations (23). The Fermi-LAT detected flare in February 2009 was not detected by AGILE as the instrument was pointing at a different part of the sky.
The February flare had a duration of ∼16 days. The average integral flux above 100 MeV of the low-energy component between MJD 54857.73 and 54873.73 was (23.2 ± 2.9) × 10
−7cm
−2s
−1, corresponding to an increase by a factor 3.8 ± 0.5 compared with the average value;
the increase is significant at >8-σ level. The September flare lasted for only ∼ 4 days. The integral flux above 100 MeV between MJD 55457.73 and 55461.73 was (33.8 ± 4.6) × 10
−7cm
−2s
−1, corresponding to an increase by a factor 5.5 ± 0.8 with respect to the average and a significance of >10 σ.
The February flare has a soft spectrum with a photon index of 4.3 ± 0.3 (Fig. 1). The spectral slope is compatible with the average 25-month value within two standard deviations.
The energy spectrum for the second flare was significantly harder, with a photon index of 2.7
± 0.2, and was still detected above 1 GeV at a 3-σ-level. The average power released in each of the gamma-ray flares was approximately 4 ×10
36erg s
−1, for the case of isotropic emission.
No significant variations in the emission of the pulsar were detected on monthly and four-day time scales through the period of observations. Examination of the timing residuals of the pulsed emission indicated no significant variations during either flares nor any significant glitch activity during the first 25 months of LAT observations.
No variations in the synchrotron component between infrared and X-ray frequencies were seen about the average nebular flux level during the second flare (24). We analyzed data col- lected by the BAT instrument on board the Swift satellite (25), which continuously monitors the sky at photon energies of 15−150 keV. The mean flux measured during the first flare was (2.0
± 0.1) × 10
−8erg cm
−2s
−1, the flux during the second flare was (2.0 ± 0.1) × 10
−8erg cm
−2s
−1. Both observations are therefore within 5% of the average flux of (2.09± 0.10) × 10
−8erg cm
−2s
−1measured by BAT in this energy range (26), and show no correlation to the gamma- ray flares. The angular resolution of the BAT only allows for the measurement of the spatially integrated spectrum. Sub-arc-second resolution images were taken in X-rays by the Chandra observatory and optical by the Hubble Space Telescope a few days after the second flare. Al- though both images show no unusual activity compared to previous observations, both show a brightening 3
′′east of the pulsar (27). In the Chandra image this brightening is associated with a knot of ∼1
′′diameter that might be associated with the inner ring or the base of the jet. Such a brightening might be interpreted as an afterglow at lower frequencies of the gamma-ray flare, but no conclusions can be drawn based on one event.
The brief flare time scales and the requirement that the emission volume be causally con- nected imply that the flaring region must have been compact. If L is the diameter of the flaring region along the line-of-sight and t is the flare duration, then L < Dct, where the Doppler fac- tor D accounts for relativistic boosting effects. The Doppler factor is expected to be moderate within the Crab Nebula, as the typical velocities observed are smaller than 0.9 c (7). Even if the emission region was moving directly toward us, this yields D <4.4. For a flare duration of 4 days this results in L < 1.4 × 10
−2pc, which corresponds to <1.5
′′projected on the sky. Struc- tures this small are found only in the inner part of the nebula, close to the termination shock, the base of the jet or the pulsar, suggesting that the gamma-ray emission detected in the flare originated from these regions. This is in agreement with expectations of relativistic magneto- hydrodynamic simulations, in which the gamma-ray emission of the synchrotron component originates close to the termination shock (28, 29).
The extrapolation of the the LAT spectrum of low-energy component to lower frequencies
suggest that it represents synchrotron emission (Fig. 1). The brevity of the gamma-ray flares
strengthens this scenario: If the flare were instead produced by IC radiation or Bremsstrahlung,
the cooling time of the emitting electrons would greatly exceed the flare duration. The cooling
via Bremsstrahlung in particle densities <10 cm
−3(30) happens over ∼10
6years. Similarly,
electrons cooling via IC emission of 100 MeV gamma rays on the photons of the synchrotron
component of Crab Nebula have cooling times & 10
7years. The average magnetic field inside
the Crab Nebula is estimated to be ∼200 µG, as deduced from modeling of the broad-band
SED (12, 21), and might be enhanced locally by up to an order of magnitude in the inner neb- ula (31). These fields imply synchrotron cooling times .15 days, comparable to the flare dura- tion, leaving synchrotron radiation as the only plausible process responsible for the gamma-ray emission during the flares.
The detection of synchrotron photons up to energies of >1 GeV confirms that electrons are accelerated to energies of &1 PeV in the Crab Nebula (32). These are the highest energy particles that can be associated directly with any astronomical source, and they pose special challenges to particle acceleration theory. Because synchrotron losses are so efficient, there must be a strong electric field E to compensate radiation reaction, given by:
E/B ≈ r
L/ℓ
cool& (1.3αE
γpk/m
ec
2) ≈ (E
γpk/50MeV) (1)
where r
Lis the Larmor radius, ℓ
coolis the radiative cooling length, α is the fine structure con- stant and E
γpkis the peak synchrotron frequency at which the most energetic electrons are emitting (17, 33). Due to the detection of gamma-ray emission beyond 1 GeV E
γpkcan be conservatively estimated to be greater than 200 MeV. The electric field is unlikely to exceed the magnetic field; if it did, there would be a local reference frame with a pure electric field in which vacuum breakdown would occur quickly. We conclude that the electric field, as measured in the Crab frame, is close in magnitude to the magnetic field in the region where the highest energy synchrotron photons were emitted. This subsumes the possibility of bulk relativistic motion.
Furthermore, the resistive force due to radiation reaction is competitive with the Lorentz force and the cooling length is comparable with the Larmor radius. This poses severe difficulties to the widely-discussed acceleration mechanism of diffusive shock acceleration (34, 35). The proposed acceleration due to absorption of ion cyclotron waves does not suffer from these con- straints (36). However, it appears to operate on time scales which are too long to accommodate the fast variability seen during the flares. Alternatively, the acceleration could be related directly to the electric field from the pulsar.
The Crab Nebula is powered by the central neutron star which acts as a DC unipolar inductor and a source of an AC striped wind (2, 3). What happens to the DC and AC current flows is controversial. It is widely supposed that ∼ 90% of the DC current returns in an outflowing wind that becomes particle-dominated and encounters a (mostly invisible) termination shock at a radius ∼ 0.1 pc (37), but the wind could also remain electromagnetically dominated (33, 38).
For the measured spin-down rate, a moment of inertia of ∼ 1 × 10
45g cm
2and a force-free model of the magnetosphere, the total induced potential difference is ∼ 50 PV, high enough to accelerate particles to the required energies. The current associated with this potential is
∼ 300 TA yielding a DC power per hemisphere of ∼ 1.5 × 10
38erg s
−1, a factor ∼40 larger than the power released in the flares. Another interesting possibility is that particle acceleration takes place in the AC striped wind of the pulsar due to magnetic reconnection, although it is not clear if this process can accelerate particles to PeV energies on the required time scales (39, 40).
The observations reported here have raised compelling questions on our understanding of
particle acceleration and motivate more detailed calculations; together with the ongoing gamma-
ray observations of the LAT and observational campaigns at X-ray and optical wavelengths they
might soon pinpoint the gamma-ray emission site in the Crab Nebula.
Energy [MeV]
10-1 1 10 102 103 104 105 106
]
-1s
-2[ ergs cm
νF ν
10-11
10-10
10-9
]
-1[ ergs s
νL ν
1034
1035
1036