29th International Cosmic Ray Conference Pune (2005) 00, 101–106
Search for pulsed VHE Gamma ray emission from the Crab Pulsar
M. L´opez
a, N. Otte
b, M. Rissi
c, P. Majumdar
b, J.A. Barrio
a, M. Camara
a, J.L Contreras
a, R. de los Reyes
a, M.V. Fonseca
a, O.C. de Jager
e, O. Kalekin
d, F. Lucarelli
a, E. O˜na-Wilhelmi
f, I. Oya
a, for the MAGIC collaboration
(a) Fac. C.C. F´ısicas, Universidad Complutense de Madrid, Avd. Ciudad Universitaria S/N.20840, Madrid, Spain (b) Max-Planck-Institut f¨ur Physik, F¨ohringer Ring 6, D-80805 M¨unchen, Germany
(c) Institute for Particle Physics, Swiss Federal Institute of Technology (ETH), Zurich, Switzerland (d) Institut f¨ur Physik, Humboldt-Universit¨at Berlin, Germnay
(e) Space Research Unit, Northwest University, Potchefstroom, 2520, South Africa
(f) Instituto de F´ısica de Altas Energ´ıas, Universidad Aut´onoma de Barcelona, 08193, Bellaterra, Spain.
Presenter: M. L´opez (marcos@gae.ucm.es)
Pulsed gamma-ray emission has been observed from the Crab pulsar by the EGRET instrument up to energies of 5 GeV. With the 17 meter MAGIC Telescope we have searched for pulsed gamma rays from Crab, and obtained a flux upper limit for its pulsed emission.
1. Introduction
The Crab pulsar (rotation period33ms) and its nebula are one of the most studied objects in VHE gamma-ray astronomy. The pulsar itself is emitting over a broad energy range from radio up to gamma-rays. It is also the only known pulsar which presents the same light curve at all energies. The most energetic pulsedγ–ray emission detected is at 5 GeV and has been measured with the EGRET instrument on board of CGRO [1].
The most popular models describing the pulsed emission are the polar cap [2] and the outer gap [3] models.
Both predict a sharp energy cutoff in the emission spectrum between a few GeV and few tens of GeV. In the polar cap scenario, electrons are accelerated above the pulsar polar cap radiatingγ-rays via curvature and synchrotron radiation. Due to the strong magnetic fields of the pulsars magnetosphere (∼ 1012Gauss) the γ-rays can undergo magnetic pair production. As a consequence of this, in the polar cap model a super–
exponential cutoff is expected in theγ-ray flux spectrum above a cutoff energyEc. In the outer gap model γ-rays are emitted close to the light cylinder of the pulsar. In this model the cutoff is determined by photon- photon pair production which has a weaker energy dependence than magnetic pair production. Therefore a higher cutoff energy is expected.
By precisely determining the cutoff energy of the spectrum one would be able to discriminate between several models thus answering the open question about the acceleration site of electrons in the magnetosphere of the pulsar. Up to now no instrument has been able to detect pulsed emission beyond a few GeV. One possible way to detectγ-rays in the energy region of interest is to use the imaging air Cherenkov technique. However, until some years ago air Cherenkov telescopes had a too high energy threshold. MAGIC [4] is the largest air Cherenkov telescope with a reflector diameter of 17m. The current trigger threshold of MAGIC is about 50 GeV, well suited to perform pulsar studies. The central pixel of the MAGIC camera is used to detect the optical emission from the Crab Pulsar and other objects to perform correlation studies [5]. The commissioning phase of the telescope finished last summer.
2 M. L´opezaet al.
2. Data Analysis
2.1 The data sample
The data analyzed here were taking during the first Crab campaign of the MAGIC telescope after its com- missioning phase. The data were taken with two different trigger conditions, namely, in the standard trigger mode, and with a special trigger condition. In the later, the trigger region is restricted to a narrow ring of the inner MAGIC camera, since this configuration provides a lower trigger threshold, as well as a better hadron suppression at the trigger level. Table 1 summarizes the two data samples used in this analysis.
Table 1. Data sample used in this analysis.
Mode Date Tobs(hours)
Standard trigger Sep. 2004: 21, 22 0.8 Oct. 2004: 10,11,22 2.4 Special trigger Oct. 2004: 16, 21, 23 4.2 Nov. 2004: 19, 21 3.1
The standard calibration of the MAGIC telescope uses a set of light pulse generators which illuminate the PMT camera uniformly. This procedure provides an absolute calibration of the camera and the signal processing chain of the telescope. The analog signals from the PMTs of the camera are digitized by 300 MHz Flash- ADCs. The conversion factor from ADC counts to photoelectrons is obtaining by means of the so called F-Factor method. Once the data has been calibrated, a cleaning algorithm is applied to the shower images in order to remove the noise of the night sky background. The final images are then parameterized in terms of the Hillas parameters [6].
2.2 Timing analysis
For each event which triggers the telescope the exact arrival time is recorded using a Rubidium clock syn- chronized with a Global Positioning System (GPS) at the beginning of each second, which provide a precision of 200 ns. For the timing analysis, all the arrival times are transformed to the solar system barycenter, using the JPL DE200 planetary ephemeris and the TEMPO package [7]. The corrected times were folded modulo the pulse period to obtain the corresponding rotational phases of the events, according to a Taylor expansion around the known Crab radio ephemeris. The ephemeris used for each observational period were obtained from the Jodrell Bank public web page [8]. In order to test our analysis software, we used the optical data taken with the Central Pixel of the MAGIC telescope (for a detailed description see [5] in these proceedings).
2.2.1 Periodicity search
Standard gamma/hadron separation methods based on cuts on the distribution of the Hillas parameters describ- ing the images, remove a large fraction of events a low energies, and, therefore are not suitable for pulsar searches, specially for the very low energy cutoff expected for the Crab pulsar. Since the signal, if at all ob- servable, is expected at the very trigger threshold of the MAGIC telescope, we applied a cut in the size of the images of 300 photons (equivalent to∼ 55photoelectrons) thus removing all the high energy showers and retaining only the low energy events. This cut reduces the background rate by 93% while losing only 34% of the gammas (assuming a super-exponential cutoff for the Crab pulsar nebula at 20 GeV, according to [10]).
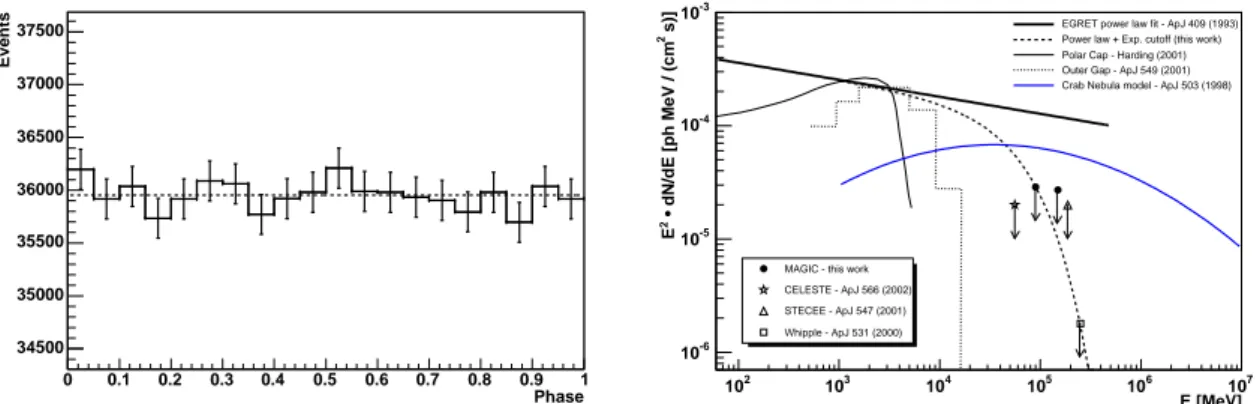
Search for VHE Gamma ray emission from the Crab Pulsar 3 Then, to search for the presence of a periodic signal at the Crab frequency, we applied different uniformity tests to the whole data sample surviving this cut. We also did a blind periodicity search around the expected Crab frequency. In either case, no evidence of a significant signal was found. The obtained light curve can be seen in Figure 1, which is consistent with an uniform distribution.
2.2.2 Flux upper limits
Since there was no evidence of the pulsed signal in our data, we proceeded to calculate the upper limit on the pulsed Crab emission. For obtaining conservative upper limits, only the data taken in the standard trigger mode have been used, applying the same gamma/hadron separation method that we employed to extract the unpulsed flux of the Crab nebula [11], but just with looser cuts. This made the energy threshold higher but easier to compare with the DC component. We have derived the upper limits from the H-test. The 3 sigma upper limit is parameterized in terms of the valueHobtained in the uniformity test and the expected duty cycle of the pulse profileδ, as [9]:
x3σ = (1.5 + 10.7δ)·(0.174H)(0.17+0.14δ)·exp (0.08 + 0.15δ)·[log10(0.174·H)]2
(1) wherex =p√
N ispthe pulsed fraction andNthe total number of recorded events. The pulse profile of the Crab pulsar above few GeVs remains unknown. For this analysis we assumed that it retains the same shape as the one measured by EGRET, i.e., we assumed a double peak pulse profile with a duty cycle of 21%. The integral upper limits obtained are reported in table 2. They have been calculated for two different lower SIZE cuts, resulting in an analysis energy threshold of 90 and 150 GeV respectively. The upper limits are compared to previous results by other experiments in Figure 1. In order to constraint the spectral energy cutoff, we have extended the EGRET power law [14] to our energy domain by assuming an exponential cutoff. The higher cutoff compatible with our upper limit isEc ≤60GeV.
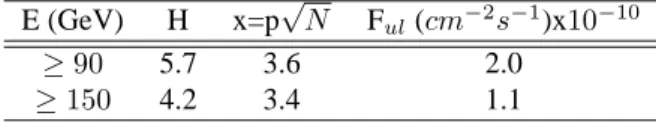
Table 2. Flux upper limits derived at different threshold energiesE.His the value obtained in the H-test, andpandNare the upper limit to the pulsed fraction and the total number of events after cuts respectively.
E (GeV) H x=p√
N Ful(cm−2s−1)x10−10
≥90 5.7 3.6 2.0
≥150 4.2 3.4 1.1
3. Conclusions
Data taken by the MAGIC telescope in 2004 has been used to search for pulsedγ-ray from the Crab pulsar. We found no evidence for its pulsed emission in our analysis at the expected radio frequency. We have calculated upper limits at different energies for a 3σ confidence level. Assuming a exponential cutoff for the Crab spectrum we conclude that this cutoff energy must be below 60 GeV. The upper limits derived here, do not allow yet to discriminate between the outer gap and polar cap models.
Apart from the Crab, other pulsars have been observed by MAGIC, which analysis can be found elsewhere in these proceedings [16].
4 M. L´opezaet al.
Phase 0 0.1 0.2 0.3 0.4 0.5 0.6 0.7 0.8 0.9 1
Events
34500 35000 35500 36000 36500 37000 37500
E [MeV]
102 103 104 105 106 107
s)]2 • dN/dE [ph MeV / (cm2E
10-6
10-5
10-4
10-3
EGRET power law fit - ApJ 409 (1993) Power law + Exp. cutoff (this work) Polar Cap - Harding (2001) Outer Gap - ApJ 549 (2001) Crab Nebula model - ApJ 503 (1998)
MAGIC - this work CELESTE - ApJ 566 (2002) STECEE - ApJ 547 (2001) Whipple - ApJ 531 (2000)
Figure 1. Left: Light curve at the expected Crab radio frequency selecting only those events below a SIZE cut of∼55 photoelectrons, i.e., close to the telescope energy threshold, and without applying any additional gamma/hadron separation cut. Right: Pulsed photon spectrum of the Crab pulsar. The full circles represents the differential flux upper limits obtained in this work at different energy thresholds. For comparison, the upper limits obtained by other experiments are also shown (see e.g. [12] and [13]). The solid line is the power law fit to the EGRET data [14], whereas the blue line is a model for the crab nebula spectrum [15]. The dashed line represents the extension of the EGRET power law into the MAGIC energy domain with an exponential cutoff constraint by our upper limit.
4. Acknowledgments
The MAGIC project is supported by the Spanish CICYT agency (under project No. FPA2003-9543-C02-01), the German BMBF and MPG, and the Italian INFN. We would like also to thank the IAC for excellent working conditions.
References
[1] D.J. Thompson, in Proc. Int. Symp. of High Energy Gamma-Ray Astronomy, Heidelberg 2000, American Institute of Physics 558, 103.
[2] J.K. Daugherty & A.K. Harding, ApJ, 458, 278 (1996).
[3] K. Hirotani, ApJ, 549, 495 (2001).
[4] E. Lorenz, New Astron. Rev., 48, 339 (2004).
[5] F. Lucarelli et al, , these proceedings.
[6] A. M. Hillas et al, ApJ, 503, 744 (1988).
[7] http://pulsar.princeton.edu/tempo/
[8] http://www.jb.man.ac.uk/ pulsar/crab.html [9] O.C. de Jager, ApJ, 436, 239 (1994).
[10] Nel, H.I. & de Jager, O.C, Astr. Space Science, 230, 299, (1995).
[11] R. Wagner et al. these proceedings.
[12] R.W. Lessard et al, ApJ, 531, 942 (2000).
[13] M. de Naurois et al. ApJ, 566, 343 (2002).
[14] P.L. Nolan et al., Ap.J., 409, 697 (1993).
[15] A.M. Hillas et al, ApJ, 503, 744 (1988).
[16] E. O˜na-Wilhelmi et al. these proceedings.