A&A 395, 803–811 (2002)
DOI: 10.1051/0004-6361:20021347 c ESO 2002
Astronomy
&
Astrophysics
A search for TeV gamma-ray emission from SNRs, pulsars and unidentified GeV sources in the Galactic plane
in the longitude range between − 2 ◦ and 85 ◦
F. A. Aharonian
1, A. G. Akhperjanian
7, M. Beilicke
4, K. Bernl¨ohr
1, H. Bojahr
6, O. Bolz
1, H. B ¨orst
5, T. Coarasa
2, J. L. Contreras
3, J. Cortina
2, S. Denningho ff
2, V. Fonseca
3, M. Girma
1, N. G ¨otting
4, G. Heinzelmann
4, G. Hermann
1, A. Heusler
1, W. Hofmann
1, D. Horns
1, I. Jung
1, R. Kankanyan
1,7, M. Kestel
2, J. Kettler
1, A. Kohnle
1,
A. Konopelko
1, H. Kornmeyer
2, D. Kranich
2, H. Krawczynski
1,%, H. Lampeitl
1, M. Lopez
3, E. Lorenz
2, F. Lucarelli
3, O. Mang
5, H. Meyer
6, R. Mirzoyan
2, A. Moralejo
3, E. Ona
3, M. Panter
1, A. Plyasheshnikov
1,§,
G. P ¨uhlhofer
1, G. Rauterberg
5, R. Reyes
2, W. Rhode
6, J. Ripken
4, A. R ¨ohring
4, G. P. Rowell
1, V. Sahakian
7, M. Samorski
5, M. Schilling
5, M. Siems
5, D. Sobzynska
2,∗, W. Stamm
5, M. Tluczykont
4, H. J. V ¨olk
1,
C. A. Wiedner
1, and W. Wittek
21 Max Planck Institut f¨ur Kernphysik, Postfach 103980, 69029 Heidelberg, Germany
2 Max Planck Institut f¨ur Physik, F¨ohringer Ring 6, 80805 M¨unchen, Germany
3 Universidad Complutense, Facultad de Ciencias F´isicas, Ciudad Universitaria, 28040 Madrid, Spain
4 Universit¨at Hamburg, Institut f¨ur Experimentalphysik, Luruper Chaussee 149, 22761 Hamburg, Germany
5 Universit¨at Kiel, Institut f¨ur Experimentelle und Angewandte Physik, Leibnizstraße 15-19, 24118 Kiel, Germany
6 Universit¨at Wuppertal, Fachbereich Physik, Gaußstr.20, 42097 Wuppertal, Germany
7 Yerevan Physics Institute, Alikhanian Br. 2, 375036 Yerevan, Armenia
§ On leave from Altai State University, Dimitrov Street 66, 656099 Barnaul, Russia
%Now at Yale University, PO Box 208101, New Haven, CT 06520-8101, USA
∗Home institute: University Lodz, Poland
Received 6 March 2002/Accepted 16 August 2002
Abstract.Using the HEGRA system of imaging atmospheric Cherenkov telescopes, one quarter of the Galactic plane (−2◦<
l <85◦) was surveyed for TeV gamma-ray emission from point sources and moderately extended sources (Ø ≤0.8◦). The region covered includes 86 known pulsars (PSR), 63 known supernova remnants (SNR) and nine GeV sources, representing a significant fraction of the known populations. No evidence for emission of TeV gamma radiation was detected, and upper limits range from 0.15 Crab units up to several Crab units, depending on the observation time and zenith angles covered. The ensemble sums over selected SNR and pulsar subsamples and over the GeV-sources yield no indication of emission from these potential sources. The upper limit for the SNR population is 6.7% of the Crab flux and for the pulsar ensemble is 3.6% of the Crab flux.
Key words.gamma rays: observations – ISM: cosmic rays – stars: pulsars: general – ISM: supernova remnants
1. Introduction
Systems of imaging atmospheric Cherenkov telescopes such as the HEGRA stereoscopic telescope system (Daum et al. 1997;
Konopelko et al. 1999a) allow one to reconstruct the direc- tions of air showers over the full field of view, with a radius of about 2◦in the case of HEGRA, and can therefore be used for sky surveys (P¨uhlhofer et al. 1999; Aharonian et al. 2001b).
Here, we report a survey of one quarter of the Galactic disc Send offprint requests to: H. Lampeitl,
e-mail:lampeitl@daniel.mpi-hd.mpg.de
ranging from the Galactic center (l≈0◦) to the Cygnus region (l≈83◦). The latitude range covered corresponds in most parts of the survey to the FoV of the HEGRA telescope system and ranges from−1.7◦ to 1.7◦ (for more details see Fig. 1). The motivation for this survey was to search for gamma-ray point sources and moderately extended sources in the TeV energy range. Most of the potential Galactic gamma-ray sources like supernova remnants (SNR) (Green 1998) and pulsars (PSR) (Taylor 1993) are the remnants of young massive (Population I) stars and thus cluster along the Galactic plane and concentrate towards the Galactic center. This picture is supported by earlier
γ-ray surveys carried out with the COS B satellite (Swanenburg et al. 1981) and with the EGRET instrument (Hartmann et al.
1999; Lamb & Macomb 1997) in the GeV range, revealing an enhancement ofγ-ray sources along the Galactic plane. Both types of objects – SNRs and pulsars – are almost certainly par- ticle accelerators and emitters of high-energy gamma radiation.
Theoretical models predict typical gamma-ray fluxes from the majority of these objects that are below the detection thresh- olds of the current generation of Cherenkov instruments (see, e.g. Drury et al. 1994; Aharonian et al. 1997 and Berezhko &
V¨olk 2000a). Until now only three SNRs - SN1006 (Tanimori et al. 1998), RX J1713.7-3946 (Muraishi et al. 2000) in the southern hemisphere and Cas-A (Aharonian et al. 2001a) in the northern hemisphere show evidence of TeV gamma-ray emis- sion. For SN1006 a flux at 70% of the Crab flux1 is reported, for RX J1713.7-3946 at 80% and for Cas-A at 3.3%. For the individual shell type SNRs, γ-Cygni, IC-433, W44, W51, up- per limits of 20% to 30% of the Crab flux are given in Buckley (1998) and V¨olk (1997). For the SNR W28 an upper limit of 70% of the Crab flux is given in Rowell et al. (2000) and for Tycho an upper limit of 3.3% of the Crab is given in Aharonian et al. (2001c). Three pulsars – the Crab Nebula (Weekes 1989), PSR1706-44 (Kifune et al. 1995) at 60% and Vela (Yoshikoshi et al. 1997) at 70% of the Crab flux have been reported as gamma-ray emitters in the TeV regime. For a review of obser- vations and theoretical predictions relating to Galactic gamma- ray sources see, e.g, Aharonian (1999c). In addition to pulsars and SNRs, many unidentified GeV sources (Lamb & Macomb 1997) lie in the Galactic plane. Both the lack of knowledge of the individual source parameters as well as the approximations used in the modeling result in large uncertainties in the predic- tions for individual objects by an order of magnitude or more.
Hence it is desirable to observe a larger sample of source can- didates beyond the few most promising representatives of each class. Given the density of source objects, a survey of the inner part of the Galactic plane provides an efficient way to search for gamma-ray emission and to average over the potential source populations.
Such a survey was conducted with the HEGRA telescope system. The range of the survey,−2◦<l<85◦, was chosen by visibility conditions and by the density of potential gamma-ray emitters. Given the location of the HEGRA telescope system at 28◦450N, observation conditions are best for Galactic longi- tudes around 65◦. The Galactic center can only be observed at large zenith angles around 60◦, and most parts of the Galactic plane with negative longitudes are virtually inaccessible.
2. The HEGRA IACT system
The HEGRA stereoscopic system (Daum et al. 1997;
Konopelko et al. 1999a) of imaging atmospheric Cherenkov telescopes (IACTs) is located on the Canary Island of
1 To keep calculations simple, we give fluxes in units of the Crab Nebula flux (so called CU). For the Crab we take a value of:
F(>E)=1.75×10⁻¹¹
E 1 TeV
−1.59
ph cm−2s−1 (Aharonian et al. 2000).
-2-10123456 -85-80-75-70-65-60-55-50-450123456 -2-10123 -40-35-30-25-20-15-10-50012345678
Galactic Latitude b (deg)
Galactic Longitude l (deg)
PSR SNR GeV
HEGRA HEGRA (A)
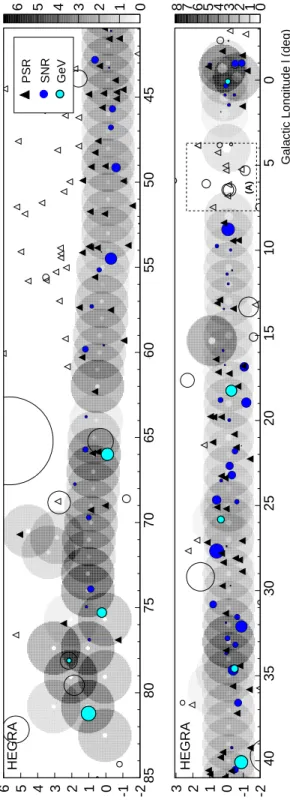
Fig. 1.Observation time in hours used for the individual scan points.
The large gray circles indicate the individual pointings and corre- spond the FoV of the telescope system used. Positions of potential TeV gamma-ray sources are marked by symbols; a filled symbol in- dicates a potential source for which we give an upper limit. The size of the circles for SNRs and GeV sources corresponds to the size of the source. Objects in the dashed box labeled (A) are excluded from further analysis (for explanation see text).
La Palma, on the site of the Observatorio del Roque de los Muchachos, at 28◦450 N, 17◦530 W, 2200 m a.s.l. The stereoscopic telescope system consists of five telescopes
(CT2-CT6). One additional telescope (CT1, Mirzoyan et al.
1994) is operated in stand-alone mode. The system telescopes are arranged on the corners and in the center of a square with 100 m side length. Each is equipped with a tessalated 8.5 m2 mirror of 5 m focal length, and a camera with 271 photomulti- plier pixels in the focal plane. The field of view of each cam- era has a diameter of 4.3◦with pixel diameters corresponding to 0.25◦. The telescope system is triggered when in at least two cameras two neighboring pixels show a signal above≈7 photoelectrons. Signals from the cameras are recorded using a 120 MHz Flash-ADC system, which is read out after a sys- tem trigger. Details of the camera hardware and of the trig- ger system are given in Hermann (1995) and Bulian et al.
(1998). The pointing uncertainty of the telescope system is below 1 arcmin (P¨uhlhofer et al. 1997). On the basis of the stereoscopic analysis of Cherenkov images, shower directions can be reconstructed with an accuracy of 0.1◦, and shower en- ergies with a resolution of 20% or better (Daum et al. 1997;
Aharonian et al. 1999a,b). The energy threshold is 500 GeV for vertical incidence of gamma-rays, and increases to 0.9 TeV at 30◦, to 1.8 TeV at 45◦ and to 5 TeV at 60◦ (Konopelko et al. 1999b). Cosmic ray showers are suppressed exploiting the width of Cherenkov images. A “mean scaled width” ¯w is defined by scaling the observed widths to the expected widths for gamma-ray images, which depend on the intensity of the images, the distance to the shower core and the zenith angle, and averaging over telescopes. Gamma-rays cause a peak in ¯w at 1, with a Gaussian width of about 0.l. Nucleonic showers have larger ¯wvalues, peaking around 1.7. While more sophisti- cated identification schemes (e.g., Daum et al. 1997; Lampeitl
& Konopelko 1999; Sch¨afer et al. 2001) can reach slightly bet- ter sensitivity, the default (and most stable) analysis schemes are based on cuts in ¯w( ¯w <1.1...1.3), combined with an angu- lar cut relative to the source of about 0.15◦in the case of a point source.
3. The dataset
Data used in this survey were taken from June to September in 1997 and from June to August in 1998 with a 4-telescope system2. In total, 176 h of observation time distributed over 92 separated locations along the Galactic plane were obtained.
The general layout of the survey is illustrated in Fig. 1. The ob- servations mainly followed the galactic equator with a spacing between individual scan positions of 1◦, allowing an overlap of the FoV between different scan points. In the outer region of the Galactic plane (l>54◦) the survey points are slightly displaced to the north following the density of interstellar matter. In the Cygnus region (l≈80◦) the survey points cover a larger range in Galactic latitudeb, because the distribution of matter is much broader in this region, at the expense of a reduced overlap be- tween adjacent points. The observation schedule was optimized such that individual survey points were observed near culmina- tion, resulting in the smallest zenith angle accessible. This ob- servation strategy leads to a strong correlation between zenith
2 CT2 was incorporated into the HEGRA-Telescope-System in May 1999.
0 10 20 30 40 50 60 70
-100 -80 -60 -40 -20 0
l (deg)
zenith angle (deg)
0.5 0.6 0.7 0.8 0.9 1 2 3 4 5 6 7 8 9 10
0 1
Eth (TeV) HEGRA
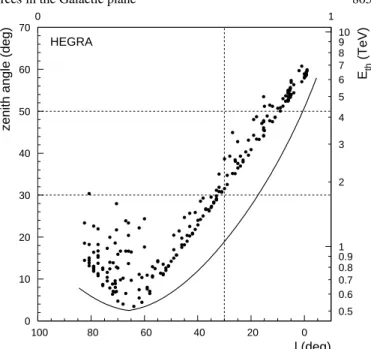
Fig. 2.Correlation between Galactic longitude and zenith angle un- der which the individual scan points were observed. Each dot repre- sents a data taking period of 20 or 30 min. The solid line indicates the approximated energy threshold in TeV (right axis) as a function of Galactic longitude (Konopelko et al. 1999b).
angle and Galactic longitude. As shown in Fig. 2 this correla- tion also implies a variation of the effective energy threshold with Galactic longitudel.
A quality selection of the data sets was based primarily on the average trigger rate of the telescope system. Data af- fected by bad weather conditions and technical problems were excluded from further analysis. The remaining data set encom- passes 115 h of observation time.
The analysis of Cherenkov images could potentially suf- fer from variations in the sky brightness over the scan region.
Since the readout electronics of the telescopes is AC coupled, a star illuminating a pixel will not cause baseline shifts, but it will still result in increased noise in that pixel. The observed re- gion contains only one star brighter than 3.5 mag atl=78.15◦, b =1.87◦with a magnitudemv = 2.23 mag. Since the galac- tic equator is obscured by interstellar dust, in most regions of the scan the Galactic background light is negligible. Only the region aroundl=6◦(marked in Fig. 1 with A) shows a strong influence of background light caused by the star clusters M8 and NGC 6530. Data taken at this location show a strong inho- mogeneity over the FoV and were excluded from this analysis.
For reference and comparison, observations of the Crab Nebula in September and October 1997 and September and October 1998 were used, and were subject to identical se- lection criteria. In total 114 h of Crab data covering the zenith angle range from 10◦ to 60◦ were used. The angular resolu- tion of the telescope system was derived by fitting a two di- mensional Gaussian distribution to the spatial distribution of the gamma ray events from the Crab Nebula. As a measure of the angular resolution, the 40% containment radius r40%
of the two dimensional distribution was taken equivalent to the Gaussian width of the projected one dimensional angular
0 0.05 0.1 0.15 0.2 0.25 0.3
0 10 20 30 40 50 60 70
z (deg)
r40% (deg) 4/4
3/4
0.0000005z3+0.08 0.00000075z3+0.1
HEGRA
Fig. 3.Angular resolution (r40%) derived from the Crab data as a func- tion of zenith anglez, after a cut on mean scaled width of ¯w < 1.1.
The angular resolution is shown for events with four telescopes out of four (4/4) and three telescopes out of four (3/4) used in the analysis.
The lines indicate the parametrisation used for further analysis.
distribution. The resulting angular resolution for different zenith angles is shown in Fig. 3. For weak sources the opti- mum significanceS/√
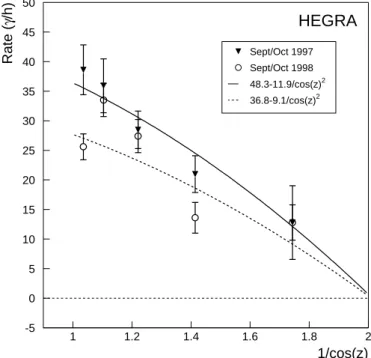
Bis obtained by cutting the distribution at a radius of 1.6·r40%. After applying the angular cut the de- tection rate for the Crab Nebula was determined. The result is shown in Fig. 4. Since aging processes of the PM tubes and different HV settings in 1997 and 1998 affected the detection rate of gamma-rays, individual calibration curves were derived for these years3. The offaxis sensitivity of the telescope system was determined by Monte Carlo simulations (for more details see Aharonian et al. 2001b). Simulations carried out for zenith angles of 20◦and 30◦show that the detection rate for offaxis gamma rays could be well described forϑ <1.7◦by a depen- dence of the form (1−0.1ϑ2) whereϑis the inclination of the shower axis with respect to the telescope pointing in degrees.
The simulation show that the detection rate is reduced by 10%
for an inclination of 1◦and by 30% at 1.7◦. For larger inclina- tions, border effects from truncated images start to deteriorate the smooth behavior.
4. Search for gamma-ray sources
The cuts on the telescope images and the shower reconstruction follow earlier work (see e.g. Aharonian et al. 1999a). In par- ticular, only images with at least 40 photoelectrons were ac- cepted and the centroid of the image had to be within 1.7◦of the camera center, in order to exclude truncated images. Showers with reconstructed cores up to 300 m from the center telescope were accepted. Since angular resolution and gamma/hadron-
3 We note that the differentγ-ray detection rates for different years indicate a change in the energy threshold of the order of 15%.
-5 0 5 10 15 20 25 30 35 40 45 50
1 1.2 1.4 1.6 1.8 2
1/cos(z)
Rate (γ/h)
Sept/Oct 1997 Sept/Oct 1998 48.3-11.9/cos(z)2 36.8-9.1/cos(z)2
HEGRA
Fig. 4.Observed photon rate for the Crab Nebula in 1997 and 1998 as a function of 1/cos(z) for 3- and 4-telescope events. An angular cut optimized for the angular resolution of the telescope system was applied. The lines indicate the parametrisation used in the analysis.
separation improves with the number of telescopes used for shower reconstruction, only events with three or more triggered telescopes were included in the analysis.
The search for gamma-ray sources was carried out on a grid of 0.03125◦spacing, well below the angular resolution of the telescope system. For each grid point the number of events located within a search radius rs were counted. The back- ground was determined by three control regions rotated by 90◦, 180◦and 270◦with respect to the pointing of the telescopes.
Each potential source location was analyzed assuming a point source, as well as extended sources of radiir=0.1◦,0.2◦,0.3◦ and 0.4◦ and taking in addition into account the zenith angle dependent angular resolution of the system (see Fig. 3). By ap- plying this scheme, the number of background events could not be evaluated for sources on or near the center of the FoV, and hence the inner part of the FoV of radiusrswas excluded from this analysis. This results in a minor loss of sky coverage, since neighboring scan points cover the excluded regions in most parts of the scan. The radius of the FoV for sources was limited to 1.7◦−rsto exclude the influence of the camera borders. With the event counts in the search region and the three control re- gions the significancesσwere calculated according to Li & Ma (1993) and upper limits according to Helene (1994) for each grid point. To derive an upper limit on the flux the result was divided by the expected number of events for a Crab-like source observed for the same time at the same zenith angle and at the same inclination with respect to the pointing of the telescopes.
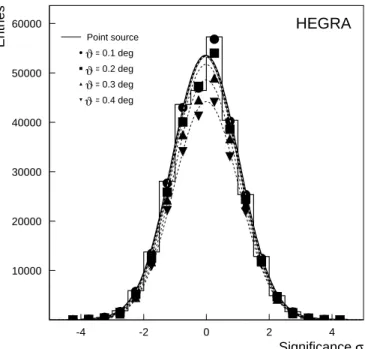
The distribution of significances for different search radii is shown in Fig. 5. All distributions are well fitted by a Gaussian distribution of mean value 0 and a variance of 1, indicating that
. 10000
20000 30000 40000 50000 60000
-4 -2 0 2 4
Significance σ
Entries Point source
θ = 0.1 deg θ = 0.2 deg θ = 0.3 deg θ = 0.4 deg
ϑ ϑϑ ϑ
HEGRA
Fig. 5.Distribution of significances for the grid points and for different search radii. No point above 4.5 σis detected. Taking the number of trials into account, this result is fully compatible with background noise. The curves shown indicate Gaussian fits to the data points. The curves for point sources and for sources with an extension of 0.1◦are nearly identical.
the background estimation is reliable. In none of the distribu- tions is a point above 4.5σevident. Taking the number of tri- als into account the result is fully compatible with background noise.
In the following we give limits for various individual sources in the range of the survey. For the nine GeV sources located in the scan region, results are given in Table 1. The source GeV J1746-2854 coincides with the Galactic center.
The limit of 8.7 Crab can thus be interpreted as an upper limit on the emission from the Galactic center. We note that the Galactic center is observed around a zenith angle of 60◦ and that at such large zenith angles the detection rate for gamma- rays is quite low (see Fig. 4) and angular resolution is degraded by more than a factor of 2 (see Fig. 3). Systematic effects might well dominate over statistics and a systematic error on a level of 50% on this limit can not be excluded.
Results for 19 SNRs out of 63 with an estimated distance of less than 10 kpc, a diameter smaller than 0.8◦and observed un- der zenith angles smaller than 45◦are given in Table 2. Results for 18 pulsars selected from 86 with a characteristic age less than 106years, a distance smaller than 10 kpc and which were observed under zenith angles smaller than 45◦ are given in Table 3. Results on the remaining SNRs and pulsars are given in Table 4. Limits obtained range from 7% of the Crab flux up to several Crab units, depending on zenith angle, accumulated observation time and search radius.
5. Ensemble limits
Even if individual sources show no indication for TeV gamma-ray emission, one can try to increase the experimental
sensitivity by considering whole ensembles of sources (“source stacking”). For given source classes, the source-region and background-region counts were accumulated and a significance and a limit was derived for each ensemble.
5.1. Unidentified GeV-sources
One can use source stacking under the assumption that all of the unidentified GeV sources here are of similar type, making any upper limits meaningful to any source-specific model. For seven GeV sources located at a Galactic longitudel>25◦the sum is given in Table 1. In total 21.9 h of on source observation time was accumulated and no indication of TeV gamma-ray emission was found. The significanceσis calculated to−1.4 and the upper limit to 5.7% of the Crab flux.
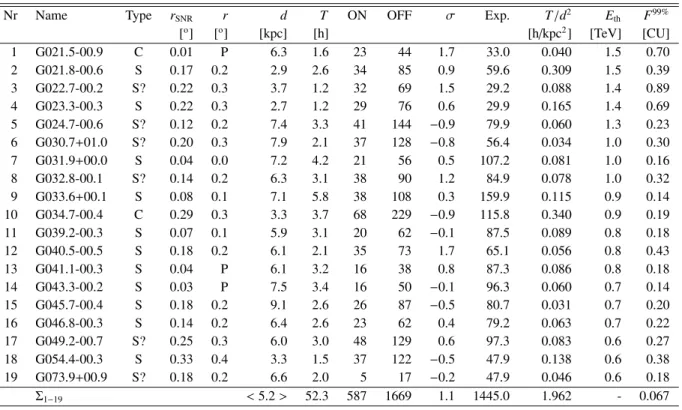
5.2. SNRs
For 19 SNRs, withl>20◦and with an estimated distanced <
10 kpc (Case & Bhattacharya 1998) statistics was accumulated (see Table 2), resulting in an equivalent observation time of 52.3 h. A significance of 1.1 standard deviations was derived and an upper limit of 6.7% of the Crab flux was calculated.
Theoretical predictions for the hadronic gamma-ray emis- sivity of SNRs are taken from Drury et al. (1994), hereafter DAV:
Fγ(>E)≈9×10⁻¹¹Θ E 1 TeV
−1.1
×S cm−2s−1. (1) The scaling value S is given by:
S = ES N 1051erg
! d 1 kpc
!−2 n 1 cm−3
· (2)
Assuming for the product of the fraction of mechanical energy converted to cosmic rays times the SNR energyΘESNa value of 1.6×1050erg as given e.g. by Fields et al. (2001), placing the remnant at a distanced=1 kpc and assuming an average value ofn=1 atom per cm3for the interstellar medium density, a flux FSNRof 78% of the remnant compared to the flux of the Crab (FCrab) is calculated in the energy range between 1 and 10 TeV.
Following the paper of DAV lower flux ratios of 48% and 18%
are derived for softer SNR spectra of index−1.2 and−1.3.
We note that the value for ΘESN is quite uncertain, de- pending on the rate of SN explosions in our Galaxy (see e.g.
Dragicevich et al. 1999), on the mass of interstellar matter in the galaxy and on the spectral index of the source popula- tion of CRs. Berezhko & V¨olk (2000b) derive a value between 0.5×1050 and 3.3×1050 erg from CR energetic arguments.
Fields et al. (2001) calculate from similar arguments a value of 1.6×1050erg but cannot exclude values as low as 1×1050erg and as high as 10×1050 erg. A similar value of 1×1050 erg to 3×1050 erg is derived in Drury et al. (1989). Theoretical calculations for diffusive shock accelerating models based on spherical symmetry of the acceleration process tend to give a value for Θ of 50% or even higher (see e.g. Drury et al.
1989 and consequently Drury et al. 1994), resulting in a value of 5×1050erg for a standard SNR of 1051erg.
Table 1.Results for GeV sources taken from the catalogue of Lamb & Macomb (1997).σposindicates the 95% error box on the source location, rthe assumed radius of the source (P=point like source).Tdenotes the observation time, ON the number of events in the source bin and OFF the number of events in the control regions.σgives the significance calculated according to Li & Ma (1983) withα =1/3. Exp. gives the number of expected events for a Crab-like source observed at the same zenith angle, the same observation time and at the same inclination with respect to the telescope pointing.Ethgives the approximate energy threshold in TeV.F99%is the derived upper limit in units of the Crab flux (CU). Possible coincidences of GeV-sources with SNRs are indicated in the last column, as given by Romero et al. (1999). The last line gives the sum over the GeV sources 3 to 9 which were observed under zenith anglesz<45◦.
Name σpos r T ON OFF σ Exp. Eth F99% Remark
[◦] [◦] [h] [TeV] [CU]
1 GeV J1746-2854 0.16 P 7.1 1183 3443 0.9 15.0 4.5 8.67 Gal. cent., G0.0+0.0, G0.5+0.0
2 GeV J1825-1310 0.32 0.4 1.0 79 201 1.23 20.4 1.7 1.87
3 GeV J1837-0610 0.20 0.2 3.6 51 170 −0.67 86.2 1.3 0.24
4 GeV J1856+0115 0.21 0.3 3.2 49 216 −2.53 101.1 0.9 0.14 G34.7-0.4 (W44)
5 GeV J1907+0557 0.36 0.4 2.1 65 169 0.97 67.7 0.8 0.48 G39.2-0.3
6 GeV J1957+2859 0.36 0.4 3.0 32 150 −2.40 78.4 0.6 0.15
7 GeV J2020+3658 0.28 0.3 1.6 27 65 0.95 56.1 0.6 0.38
8 GeV J2020+4023 0.14 0.2 6.3 36 102 0.29 181.9 0.6 0.12 G74.9+1.2
9 GeV J2035+4214 0.42 0.4 2.1 59 172 0.19 74.2 0.6 0.35
Σ3−9 21.9 319 1044 −1.4 645.6 - 0.057
Table 2.List of selected SNR from Green (1998). Type indicates the morphology according to Green (C=Composite, S=shell type, ?= some uncertainties).rSNRdenotes the radius of the SNR in degrees.rindicates the assumed source size as taken in the analysis (P=point like source).dis the distance to the individual remnant in kpc as derived from the radio-surface-brightness-to-diameter relationship (Σ-D) as given in Case & Bhattacharya (1998).T/d2is the weight of the individual remnant as used in Eq. (3). The other columns are labeled as in Table 1.
The last row gives the sum over the ensemble of SNRs.FDAVis the expected hadronic flux from the ensemble calculated according to Drury et al. (1994). For further explanations see text.
Nr Name Type rSNR r d T ON OFF σ Exp. T/d2 Eth F99%
[o] [o] [kpc] [h] [h/kpc2] [TeV] [CU]
1 G021.5-00.9 C 0.01 P 6.3 1.6 23 44 1.7 33.0 0.040 1.5 0.70
2 G021.8-00.6 S 0.17 0.2 2.9 2.6 34 85 0.9 59.6 0.309 1.5 0.39
3 G022.7-00.2 S? 0.22 0.3 3.7 1.2 32 69 1.5 29.2 0.088 1.4 0.89
4 G023.3-00.3 S 0.22 0.3 2.7 1.2 29 76 0.6 29.9 0.165 1.4 0.69
5 G024.7-00.6 S? 0.12 0.2 7.4 3.3 41 144 −0.9 79.9 0.060 1.3 0.23
6 G030.7+01.0 S? 0.20 0.3 7.9 2.1 37 128 −0.8 56.4 0.034 1.0 0.30
7 G031.9+00.0 S 0.04 0.0 7.2 4.2 21 56 0.5 107.2 0.081 1.0 0.16
8 G032.8-00.1 S? 0.14 0.2 6.3 3.1 38 90 1.2 84.9 0.078 1.0 0.32
9 G033.6+00.1 S 0.08 0.1 7.1 5.8 38 108 0.3 159.9 0.115 0.9 0.14
10 G034.7-00.4 C 0.29 0.3 3.3 3.7 68 229 −0.9 115.8 0.340 0.9 0.19
11 G039.2-00.3 S 0.07 0.1 5.9 3.1 20 62 −0.1 87.5 0.089 0.8 0.18
12 G040.5-00.5 S 0.18 0.2 6.1 2.1 35 73 1.7 65.1 0.056 0.8 0.43
13 G041.1-00.3 S 0.04 P 6.1 3.2 16 38 0.8 87.3 0.086 0.8 0.18
14 G043.3-00.2 S 0.03 P 7.5 3.4 16 50 −0.1 96.3 0.060 0.7 0.14
15 G045.7-00.4 S 0.18 0.2 9.1 2.6 26 87 −0.5 80.7 0.031 0.7 0.20
16 G046.8-00.3 S 0.14 0.2 6.4 2.6 23 62 0.4 79.2 0.063 0.7 0.22
17 G049.2-00.7 S? 0.25 0.3 6.0 3.0 48 129 0.6 97.3 0.083 0.6 0.27
18 G054.4-00.3 S 0.33 0.4 3.3 1.5 37 122 −0.5 47.9 0.138 0.6 0.38
19 G073.9+00.9 S? 0.18 0.2 6.6 2.0 5 17 −0.2 47.9 0.046 0.6 0.18
Σ1−19 <5.2> 52.3 587 1669 1.1 1445.0 1.962 - 0.067
An additional uncertainty arises from the density of the in- terstellar medium in which the SNR evolves. Berezhko & V¨olk (2000a) point out that a large fraction of the Galaxy is occu- pied by the so-called hot interstellar medium where the particle
density is lower than 1 atom per cm3, leading to lowπ0-gamma- ray production in such an ambient medium.
For comparison of the derived ensemble limit with the- oretical predictions, the difficulty of estimating the distance
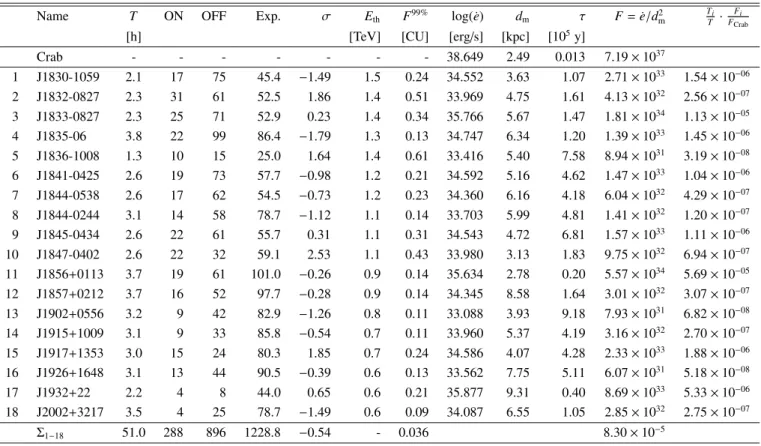
Table 3.List of selected pulsars as taken from Taylor (1993). Pulsars are selected by their modeled distancedmless than 10 kpc, rotation period less than 1 s and a characteristic ageτ=1/2p/p˙less than 106years. log(˙e) denotes the logarithm of the spin down luminosity of the pulsar in erg/s. F gives the spin down energy of the pulsar divided by the square of the distancedmin erg s−1kpc−2. The last column gives the individual contribution of the pulsar to the ensemble sum. The ensemble sum is given in the last row. Other columns are labeled as in Table 1. Pulsars are treated in the analyses as point sources. The search radius is chosen to 1.6·r40%(z) (see Fig. 3). For the calculation of the ratioTi/T ·Fi/FCrab
the sum of the total observation timeT =51.0 h is used.
Name T ON OFF Exp. σ Eth F99% log(˙e) dm τ F=e/d˙ 2m
Ti T · FFi
Crab
[h] [TeV] [CU] [erg/s] [kpc] [105y]
Crab - - - 38.649 2.49 0.013 7.19×1037
1 J1830-1059 2.1 17 75 45.4 −1.49 1.5 0.24 34.552 3.63 1.07 2.71×1033 1.54×10−06 2 J1832-0827 2.3 31 61 52.5 1.86 1.4 0.51 33.969 4.75 1.61 4.13×1032 2.56×10−07 3 J1833-0827 2.3 25 71 52.9 0.23 1.4 0.34 35.766 5.67 1.47 1.81×1034 1.13×10−05 4 J1835-06 3.8 22 99 86.4 −1.79 1.3 0.13 34.747 6.34 1.20 1.39×1033 1.45×10−06 5 J1836-1008 1.3 10 15 25.0 1.64 1.4 0.61 33.416 5.40 7.58 8.94×1031 3.19×10−08 6 J1841-0425 2.6 19 73 57.7 −0.98 1.2 0.21 34.592 5.16 4.62 1.47×1033 1.04×10−06 7 J1844-0538 2.6 17 62 54.5 −0.73 1.2 0.23 34.360 6.16 4.18 6.04×1032 4.29×10−07 8 J1844-0244 3.1 14 58 78.7 −1.12 1.1 0.14 33.703 5.99 4.81 1.41×1032 1.20×10−07 9 J1845-0434 2.6 22 61 55.7 0.31 1.1 0.31 34.543 4.72 6.81 1.57×1033 1.11×10−06 10 J1847-0402 2.6 22 32 59.1 2.53 1.1 0.43 33.980 3.13 1.83 9.75×1032 6.94×10−07 11 J1856+0113 3.7 19 61 101.0 −0.26 0.9 0.14 35.634 2.78 0.20 5.57×1034 5.69×10−05 12 J1857+0212 3.7 16 52 97.7 −0.28 0.9 0.14 34.345 8.58 1.64 3.01×1032 3.07×10−07 13 J1902+0556 3.2 9 42 82.9 −1.26 0.8 0.11 33.088 3.93 9.18 7.93×1031 6.82×10−08 14 J1915+1009 3.1 9 33 85.8 −0.54 0.7 0.11 33.960 5.37 4.19 3.16×1032 2.70×10−07 15 J1917+1353 3.0 15 24 80.3 1.85 0.7 0.24 34.586 4.07 4.28 2.33×1033 1.88×10−06 16 J1926+1648 3.1 13 44 90.5 −0.39 0.6 0.13 33.562 7.75 5.11 6.07×1031 5.18×10−08
17 J1932+22 2.2 4 8 44.0 0.65 0.6 0.21 35.877 9.31 0.40 8.69×1033 5.33×10−06
18 J2002+3217 3.5 4 25 78.7 −1.49 0.6 0.09 34.087 6.55 1.05 2.85×1032 2.75×10−07
Σ1−18 51.0 288 896 1228.8 −0.54 - 0.036 8.30×10⁻⁵
to individual remnants complicates the situation. Only for a mi- nority of SNRs do reliable estimates of the distance exist from direct measurements (see e.g. Green 1998). A recent estimate of the distance to most of the known remnants is given in Case
& Bhattacharya (1998) using the radio-surface-brightness-to- diameter relationship (Σ-D). In the calculations here we adopt their values. The limit derived from the observations can be compared with the predictions of the DAV model by summing over all remnants given in Table 2 and by weighting the indi- vidual source by the fractional observation time Ti. Thus we define the fluxFDAVpredicted by the DAV model as follows:
FDAV
FCrab =X
i
Fγi FCrab
Ti
T =FSNR
FCrab ·1 kpc2 T
X
i
Ti
d2i (3)
whereFγifor each sourceiis given by Eqs. (1) and (2) in the en- ergy range between 1 and 10 TeV. ForΘESNwe assume a value of 1.6×1050erg/s on average and for the density of the inter- stellar medium a value of 1 atom per cm3on average. This cal- culation gives a flux of 0.029 CU for a spectral index of−1.1 of the complete ensemble which is about a factor of two be- low the derived limit of 0.067 CU. This result is, within errors, still consistent but obviously rules out a strong enhanced emis- sion of the SNR population compared to the prediction of DAV.
Despite the large uncertainties in the averaged gamma-ray lu- minosity of SNRs as discussed before, this limit could also
be viewed as a limit on non-hadronic production channels of gamma-rays in SNRs.
We note that the derived flux from the ensemble is quite stable with respect to the distance estimate to individual rem- nants. An alternative way to derive an estimate on the distance for individual remnants by assuming a Sedov-Taylor expansion of the shell into the interstellar medium, assuming an average age of the population of 2×10⁴years and using the values for the shell size as given in Shu (1992), gives within a few percent the same value for the flux of the ensemble.
5.3. Pulsars
Compared to the SNR population the situation for pulsars is less complicated for the following reasons:
- pulsars are for all practical purposes point sources for HEGRA;
- the distances to the pulsars can be estimated by the dispersion measure (DM) of the pulsed radio emission and by modeling the thermal electron distribution in the Galaxy.
For further analysis, pulsars with a characteristic ageτ = 1/2 p/p˙less than 106years, a rotation period of less than 1 s and a modeled distance of less than 10 kpc were selected.
18 out of 86 pulsars fulfill these criteria. A list of these pul- sars is given in Table 3. A comparison of the estimated flux
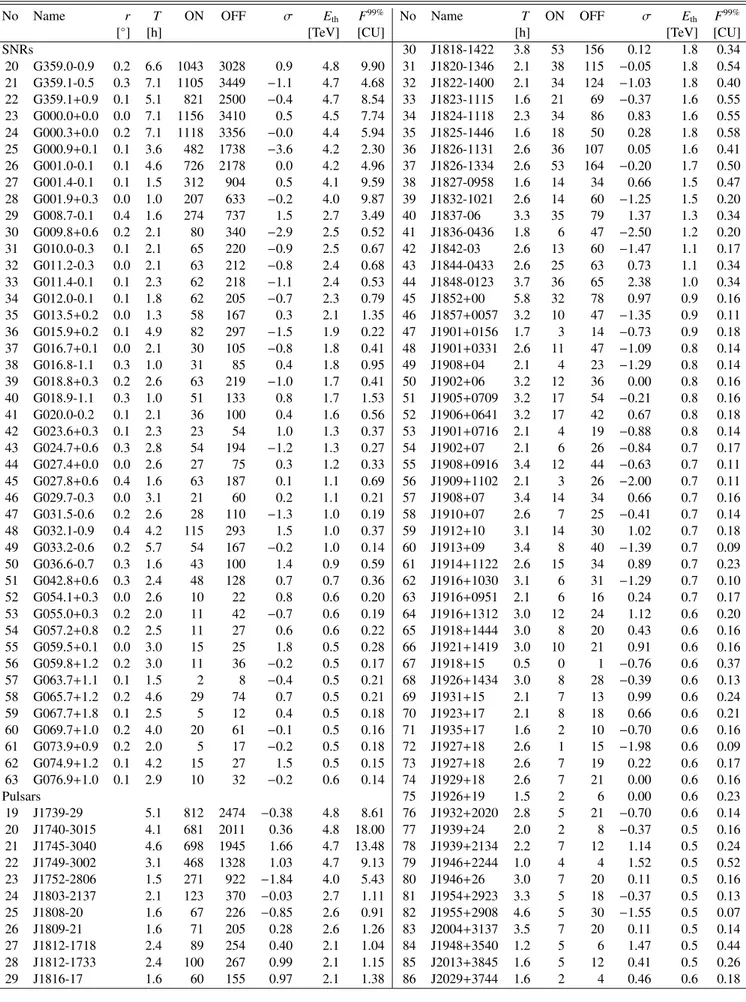
Table 4.Results for SNRs and pulsars not used in the ensemble limits of Tables 2 and 3. Columns are labeled as in Table 2 and are in the same units.
No Name r T ON OFF σ Eth F99% No Name T ON OFF σ Eth F99%
[◦] [h] [TeV] [CU] [h] [TeV] [CU]
SNRs 30 J1818-1422 3.8 53 156 0.12 1.8 0.34
20 G359.0-0.9 0.2 6.6 1043 3028 0.9 4.8 9.90 31 J1820-1346 2.1 38 115 −0.05 1.8 0.54 21 G359.1-0.5 0.3 7.1 1105 3449 −1.1 4.7 4.68 32 J1822-1400 2.1 34 124 −1.03 1.8 0.40
22 G359.1+0.9 0.1 5.1 821 2500 −0.4 4.7 8.54 33 J1823-1115 1.6 21 69 −0.37 1.6 0.55
23 G000.0+0.0 0.0 7.1 1156 3410 0.5 4.5 7.74 34 J1824-1118 2.3 34 86 0.83 1.6 0.55
24 G000.3+0.0 0.2 7.1 1118 3356 −0.0 4.4 5.94 35 J1825-1446 1.6 18 50 0.28 1.8 0.58
25 G000.9+0.1 0.1 3.6 482 1738 −3.6 4.2 2.30 36 J1826-1131 2.6 36 107 0.05 1.6 0.41
26 G001.0-0.1 0.1 4.6 726 2178 0.0 4.2 4.96 37 J1826-1334 2.6 53 164 −0.20 1.7 0.50
27 G001.4-0.1 0.1 1.5 312 904 0.5 4.1 9.59 38 J1827-0958 1.6 14 34 0.66 1.5 0.47
28 G001.9+0.3 0.0 1.0 207 633 −0.2 4.0 9.87 39 J1832-1021 2.6 14 60 −1.25 1.5 0.20
29 G008.7-0.1 0.4 1.6 274 737 1.5 2.7 3.49 40 J1837-06 3.3 35 79 1.37 1.3 0.34
30 G009.8+0.6 0.2 2.1 80 340 −2.9 2.5 0.52 41 J1836-0436 1.8 6 47 −2.50 1.2 0.20
31 G010.0-0.3 0.1 2.1 65 220 −0.9 2.5 0.67 42 J1842-03 2.6 13 60 −1.47 1.1 0.17
32 G011.2-0.3 0.0 2.1 63 212 −0.8 2.4 0.68 43 J1844-0433 2.6 25 63 0.73 1.1 0.34
33 G011.4-0.1 0.1 2.3 62 218 −1.1 2.4 0.53 44 J1848-0123 3.7 36 65 2.38 1.0 0.34
34 G012.0-0.1 0.1 1.8 62 205 −0.7 2.3 0.79 45 J1852+00 5.8 32 78 0.97 0.9 0.16
35 G013.5+0.2 0.0 1.3 58 167 0.3 2.1 1.35 46 J1857+0057 3.2 10 47 −1.35 0.9 0.11 36 G015.9+0.2 0.1 4.9 82 297 −1.5 1.9 0.22 47 J1901+0156 1.7 3 14 −0.73 0.9 0.18
37 G016.7+0.1 0.0 2.1 30 105 −0.8 1.8 0.41 48 J1901+0331 2.6 11 47 −1.09 0.8 0.14
38 G016.8-1.1 0.3 1.0 31 85 0.4 1.8 0.95 49 J1908+04 2.1 4 23 −1.29 0.8 0.14
39 G018.8+0.3 0.2 2.6 63 219 −1.0 1.7 0.41 50 J1902+06 3.2 12 36 0.00 0.8 0.16
40 G018.9-1.1 0.3 1.0 51 133 0.8 1.7 1.53 51 J1905+0709 3.2 17 54 −0.21 0.8 0.16
41 G020.0-0.2 0.1 2.1 36 100 0.4 1.6 0.56 52 J1906+0641 3.2 17 42 0.67 0.8 0.18
42 G023.6+0.3 0.1 2.3 23 54 1.0 1.3 0.37 53 J1901+0716 2.1 4 19 −0.88 0.8 0.14
43 G024.7+0.6 0.3 2.8 54 194 −1.2 1.3 0.27 54 J1902+07 2.1 6 26 −0.84 0.7 0.17
44 G027.4+0.0 0.0 2.6 27 75 0.3 1.2 0.33 55 J1908+0916 3.4 12 44 −0.63 0.7 0.11
45 G027.8+0.6 0.4 1.6 63 187 0.1 1.1 0.69 56 J1909+1102 2.1 3 26 −2.00 0.7 0.11
46 G029.7-0.3 0.0 3.1 21 60 0.2 1.1 0.21 57 J1908+07 3.4 14 34 0.66 0.7 0.16
47 G031.5-0.6 0.2 2.6 28 110 −1.3 1.0 0.19 58 J1910+07 2.6 7 25 −0.41 0.7 0.14
48 G032.1-0.9 0.4 4.2 115 293 1.5 1.0 0.37 59 J1912+10 3.1 14 30 1.02 0.7 0.18
49 G033.2-0.6 0.2 5.7 54 167 −0.2 1.0 0.14 60 J1913+09 3.4 8 40 −1.39 0.7 0.09
50 G036.6-0.7 0.3 1.6 43 100 1.4 0.9 0.59 61 J1914+1122 2.6 15 34 0.89 0.7 0.23
51 G042.8+0.6 0.3 2.4 48 128 0.7 0.7 0.36 62 J1916+1030 3.1 6 31 −1.29 0.7 0.10
52 G054.1+0.3 0.0 2.6 10 22 0.8 0.6 0.20 63 J1916+0951 2.1 6 16 0.24 0.7 0.17
53 G055.0+0.3 0.2 2.0 11 42 −0.7 0.6 0.19 64 J1916+1312 3.0 12 24 1.12 0.6 0.20
54 G057.2+0.8 0.2 2.5 11 27 0.6 0.6 0.22 65 J1918+1444 3.0 8 20 0.43 0.6 0.16
55 G059.5+0.1 0.0 3.0 15 25 1.8 0.5 0.28 66 J1921+1419 3.0 10 21 0.91 0.6 0.16
56 G059.8+1.2 0.2 3.0 11 36 −0.2 0.5 0.17 67 J1918+15 0.5 0 1 −0.76 0.6 0.37
57 G063.7+1.1 0.1 1.5 2 8 −0.4 0.5 0.21 68 J1926+1434 3.0 8 28 −0.39 0.6 0.13
58 G065.7+1.2 0.2 4.6 29 74 0.7 0.5 0.21 69 J1931+15 2.1 7 13 0.99 0.6 0.24
59 G067.7+1.8 0.1 2.5 5 12 0.4 0.5 0.18 70 J1923+17 2.1 8 18 0.66 0.6 0.21
60 G069.7+1.0 0.2 4.0 20 61 −0.1 0.5 0.16 71 J1935+17 1.6 2 10 −0.70 0.6 0.16
61 G073.9+0.9 0.2 2.0 5 17 −0.2 0.5 0.18 72 J1927+18 2.6 1 15 −1.98 0.6 0.09
62 G074.9+1.2 0.1 4.2 15 27 1.5 0.5 0.15 73 J1927+18 2.6 7 19 0.22 0.6 0.17
63 G076.9+1.0 0.1 2.9 10 32 −0.2 0.6 0.14 74 J1929+18 2.6 7 21 0.00 0.6 0.16
Pulsars 75 J1926+19 1.5 2 6 0.00 0.6 0.23
19 J1739-29 5.1 812 2474 −0.38 4.8 8.61 76 J1932+2020 2.8 5 21 −0.70 0.6 0.14
20 J1740-3015 4.1 681 2011 0.36 4.8 18.00 77 J1939+24 2.0 2 8 −0.37 0.5 0.16
21 J1745-3040 4.6 698 1945 1.66 4.7 13.48 78 J1939+2134 2.2 7 12 1.14 0.5 0.24
22 J1749-3002 3.1 468 1328 1.03 4.7 9.13 79 J1946+2244 1.0 4 4 1.52 0.5 0.52
23 J1752-2806 1.5 271 922 −1.84 4.0 5.43 80 J1946+26 3.0 7 20 0.11 0.5 0.16
24 J1803-2137 2.1 123 370 −0.03 2.7 1.11 81 J1954+2923 3.3 5 18 −0.37 0.5 0.13
25 J1808-20 1.6 67 226 −0.85 2.6 0.91 82 J1955+2908 4.6 5 30 −1.55 0.5 0.07
26 J1809-21 1.6 71 205 0.28 2.6 1.26 83 J2004+3137 3.5 7 20 0.11 0.5 0.14
27 J1812-1718 2.4 89 254 0.40 2.1 1.04 84 J1948+3540 1.2 5 6 1.47 0.5 0.44
28 J1812-1733 2.4 100 267 0.99 2.1 1.15 85 J2013+3845 1.6 5 12 0.41 0.5 0.26
29 J1816-17 1.6 60 155 0.97 2.1 1.38 86 J2029+3744 1.6 2 4 0.46 0.6 0.18
for the selected pulsars compared to the estimated flux for the Crab Pulsar from the spin-down luminosity and the distance show that even the most energetic pulsar in the selected sam- ple is well below three orders of magnitude compared to the Crab pulsar. Aharonian et al. (1997) point out that the efficiency in converting spin-down energy into high energy gamma-rays depends inversely on the magnetic field B in the surround- ing synchrotron nebula. Due to the high magnetic field in the Crab Nebula the expected efficiency in producing gamma-rays could be significantly higher (up to a factor of a hundred) for other pulsars with a low magnetic field compared to the Crab Nebula. Even under such an optimistic assumption a de- tection seems to be quite unlikely. The situation does not im- prove for the ensemble of the 18 pulsars. Under the assump- tion of the same efficiency in converting spin-down energy into TeV gamma-rays in the individual pulsars as in the Crab pulsar, a flux≈400 times lower than the calculated upper limit on the ensemble of 3.6% of the Crab flux is expected.
6. Summary
In a systematic search for point sources in the Galactic plane in the longitude range from−2oto 85owith the HEGRA IACT system, no TeV gamma-ray emission was detected at a level above 4.5σover a total observation time of 115 h. Upper limits for 63 SNRs, 86 pulsars and nine unidentified GeV-sources on the level between 7% of the Crab flux and up to 18 Crab flux units were derived, depending on observation time and zenith angle. Summation over the most promising sources for TeV gamma-ray emission within each source class did not yield an indication of emission from the SNR ensemble, the PSR ensemble or the ensemble of GeV-sources. For the ensemble of 7 GeV sources an upper limit of 5.7% compared to the Crab flux was derived. For the ensemble of 18 pulsars selected by characteristic age and distance a similar upper limit of 3.6%
was obtained. A theoretical estimate for these pulsars using the same conversion efficiency from rotational energy to gamma- rays as in the Crab Nebula gives a flux of approximately a factor of 400 lower than the derived limit.
For an ensemble of 19 selected SNRs a limit of 6.7% of the Crab flux was derived. Comparing this limit with a predicted hadronic gamma-ray flux of 2.9% according to the DAV model and reasonable parameters rules out a strong enhancement of the emission of the SNR population compared to the model predictions.
While no new TeV sources could be established in this sur- vey, we nevertheless note that with systems of IACTs such a survey provides an efficient method to probe extended re- gions of the sky with a dense population of sources, such as the Galactic plane.
Acknowledgements. The support of the HEGRA experiment by the German Ministry for Research and Technology BMBF and by the Spanish Research Council CICYT is acknowledged.
We are grateful to the Instituto de Astrof´ısica de Canarias for the use of the site and for providing excellent working conditions. We gratefully acknowledge the technical support staffof Heidelberg, Kiel, Munich, and Yerevan.
References
Aharonian, F., et al. 2001a, A&A, 370, 112 Aharonian, F. A., et al. 2001b, A&A, 375, 1008 Aharonian, F. A., et al. 2001c, A&A, 373, 292 Aharonian, F. A., et al. 2000, ApJ, 539, 317 Aharonian, F., et al. 1999a, A&A, 342, 69 Aharonian, F., et al. 1999b, A&A, 349, 11 Aharonian, F. A. 1999c, Astropart. Phys., 11, 225
Aharonian, F. A., Atoyan, A. M., & Kifune, T. 1997, MNRAS, 291, 162
Berezhko, E. G., & V¨olk, H. J. 2000a, Astropart. Phys., 14, 201 Berezhko, E. G., & V¨olk, H. J. 2000b, ApJ, 540, 923
Buckley, et al. 1998, A&A, 329, 639
Bulian, N., et al. 1998, Astropart. Phys., 8, 223 Case, G. L., & Bhattacharya, D. 1998, ApJ, 504, 761
Dragicevich, P. M., Blair, D. G., & Burman, R. R. 1999, MNRAS, 302, 693
Daum, A., et al. 1997, Astropart. Phys., 8, 1
Drury, L. O., Aharonian, F. A., & V¨olk, H. J. 1994, A&A, 287, 959 Drury, L. O., Markiewicz, W. J., & V¨olk, H. J. 1989, A&A, 225, 179 Fields, B., et al. 2001, A&A, 370, 623
Green, D. A. 1998, A Catalouge of Galactic Supernova Remnants, Mullard Radio Astronomy Observatory
Hartmann, R. C., et al. 1999, ApJSS, 123, 79 Helene, O. 1983, NIM, 212, 319
Hermann, G. 1995, Proceedings of the Int. Workshop “Towards a Major Atmospheric Cherenkov Detector IV”, Padua, ed. M. Cresti, p. 396
Kifune, T., et al. 1995, ApJ, 438, L91
Konopelko, A., et al. 1999a, Astropart. Phys., 10, 275 Konopelko, A., et al. 1999b, J. Phys. G, 25, 1989 Lamb, R. C., & Macomb, D. J. 1997, ApJ, 488, 872
Lampeitl, H., & Konopelko, A. 1999, Proc. of the 26th ICRC, Salt Lake City, 4, 81
Li, T., & Ma, Y. 1983, ApJ, 272, 317 Mirzoyan, R., et al. 1994, NIM, 351, 513 Muraishi, H., et al. 2000, A&A, 354, L57 P¨uhlhofer, G., et al. 1997, Astropart. Phys., 8, 101 P¨uhlhofer, G, et al. 1999, Proc. 26th ICRC, 4, 77
Romero, G. E., Benaglia, P., & Torres, D. F. 1999, A&A, 348, 868 Rowell, G. P., et al. 2000, A&A, 359, 337
Sch¨afer, B. M., et al. 2001, NIM, A465, 394
Shu, F. H. 1992, The Physics of Astrophysics, Volume II, University Science Books, 233
Swanenburg, B. N., et al. 1981, ApJ, 243, L69-L73 Tanimori, T., et al. 1998, ApJ, 497, L25
Taylor, J. H., et al. 1993, ApJS, 88, 529
V¨olk, H. J., in Proc. Towards a Major Atmospheric Cherenkov Detectoe-V, ed. O. C. de Jaeger (Kruger National Park, 1997), 87 Weekes, T. C., et al. 1989, ApJ, 342, 379
Yoshikoshi, T., et al. 1997, ApJ, 487, L65