Gamma ray tracking with the AGATA demonstrator
–
A novel approach for in-beam spectroscopy
Inaugural–Dissertation zur
Erlangung des Doktorgrades
der Mathematisch-Naturwissenschaftlichen Fakult¨ at der Universi¨ at zu K¨ oln
vorgelegt von Benedikt Birkenbach
aus Fulda
K¨ oln 2014
Berichterstatter: Prof. Dr. Peter Reiter (Gutachter) Prof. Dr. Jan Jolie
Tag der m¨ undlichen Pr¨ ufung: 11. April 2014
Abstract
The Advanced GAmma Tracking Array (AGATA) employs the novel method of gamma-ray tracking (GRT), where all locations of energy depositions within the Ge crystal detector volume are used by compu- ter algorithms to reconstruct the various simultaneous interactions of the measured γ radiation. The interaction positions are determined by Pulse Shape Analysis (PSA) algorithms that compare the measured and digitized signals with the information of a signal database compri- sing position dependent calculated sets of detector signals. The result of a detailed comparison between measured and calculated signals yields the position of each interaction point. The GRT algorithms rely on this precise position of the deposited energy as an input to reconstruct the initial γ-rays from the full sequence of the different interactions in the detector. Within this thesis a computer program library was developed, providing software routines to calculate the position dependent detector signals of the highly segmented HPGe detectors. The currently used signal databases of all AGATA detec- tors were generated by this software package and computer library.
Part of the computing is based on individual detector properties which were deduced from detailed characterisation measurements. Details of the library, the used routines and the needed characteristics of the de- tector system are described, this includes a precise measurement of the crystal axis orientation of the AGATA HPGe crystals.
The second part of this thesis is dealing with the analysis of one of the first in-beam experiments performed with the AGATA demonstrator setup at the LNL in Italy. The experiment aimed for a spectroscopic investigation of neutron rich actinides from Thorium to Plutonium produced after multi-nucleon transfer reactions. For this purpose a
136 Xe beam with an energy of 1 GeV bombarded onto a 238 U target.
The fast beam like particles after the transfer reactions were identi-
fied by the magnetic spectrometer PRISMA. The γ-rays were detec-
ted with the AGATA demonstrator consisting of five AGATA triple
cluster detectors. An additional micro channel plate detector for par-
ticle detection was mounted inside the scattering chamber in order to
request kinematic coincidences. The analysis procedures for the two
complex sub-detectors AGATA and PRISMA were extended and ad-
apted to the specific requirements of this new approach for actinide spectroscopy. First the complex analysis of the magnetic spectrometer PRISMA and solutions for unexpected detector behaviour like time drifts and aberration corrections are described. As a result the indi- vidual isotopes of elements from Barium to Tellurium were identified confirming the very high quality of the PRISMA spectrometer and its design parameters.
The analysis of the γ-ray spectra comprised a detailed PSA and GRT analysis of the AGATA demonstrator. This analysis included also data analysis developments for the AGATA collaboration. The data of the AGATA demonstrator, the PRISMA spectrometer and the ancillary detectors were merged to obtain background free Doppler corrected spectra for the beam- and target-like reaction products. The simul- taneous Doppler correction for beam and target-like ions included an elaborate optimization procedure for unobservable experimental pa- rameters. The γ-ray spectra for the individual isotopes is consistent with the isotope identification of the PRISMA analysis. For the beam like particles γ-ray spectra of the isotopes 128−139 Xe are presented and discussed. For the target like nuclei γ-ray spectra of the isotopes
236−240 U are deduced. By gating on the remaining excitation energy
after the multi-nucleon transfer reaction the neutron evaporation and
fission of the excited actinide nuclei were suppressed. Coincidences
between AGATA and PRISMA were exploited for the first time to-
gether with the particle coincidence between beam- and target-like
nuclei. These triple coincidences allowed further background reducti-
on. The results for the individual Xenon and Uranium isotopes de-
monstrate the successful operation of the AGATA demonstrator cou-
pled to the PRSIMA spectrometer. The quality of the γ-ray spectra
show clearly that the novel pulse shape analysis and γ-ray tracking
methods fulfil expectations also for demanding in-beam γ-ray spec-
troscopy experiments.
Zusammenfassung
Das Advanced GAmma Tracking Array (AGATA) Spektrometer ver- wendet die neue Gamma-Ray Tracking (GRT) Methode. Diese re- konstruiert mithilfe von Computeralgorithmen und den Orten der Energiedepositionen die verschiedenen simultanen Interaktionen der gemessenen γ-Strahlung innerhalb der Germanium-Detektorkristalle.
Die Interaktionsorte werden durch Impulsformanalyse-Algorithmen (PSA) bestimmt, welche die gemessenen und digitalisierten Signale mit den Informationen einer Signaldatenbank vergleichen. Diese Si- gnaldatenbank besteht aus S¨ atzen von berechneten ortsabh¨ angigen Detektorsignalen. Das Resultat eines detaillierten Vergleichs zwischen gemessenen und berechneten Signalen sind die Orte der jeweiligen In- teraktionen. Die GRT-Algorithmen ben¨ otigen die pr¨ azisen Orte der Energiedepositionen um die urspr¨ unglichen γ-Strahlen aus der vollen Sequenz unterschiedlicher Interaktionen im Detektor zu rekonstruie- ren. Im Rahmen der vorgelegten Arbeit wurde eine Programmbiblio- thek entwickelt, welche Softwareroutinen zur Berechnung der orts- abh¨ angigen Signale von hochsegmentierten HPGe-Detektoren bereit- stellt. Die aktuell genutzten Signaldatenbanken aller AGATA-Detek- toren wurden durch Programme unter Verwendung dieses Softwarepa- ketes generiert. Teile der Berechnung basieren auf den individuellen Eigenschaften der Detektoren, welche durch detaillierte Messungen bestimmt wurden. Details der Programmbibliothek, die verwendeten Routinen und die ben¨ otigten Eigenschaften des Detektorsystems wer- den beschrieben und beinhalten eine pr¨ azise Messung der Orientierung der Kristallachsen der AGATA HPGe-Kristalle.
Der zweite Teil dieser Arbeit behandelt die Analyse eines der ers-
ten In-Beam Experimente mit dem AGATA-Demonstrator am LNL
in Italien. Das Ziel des Experimentes war die spektroskopische Unter-
suchung der neutronenreichen Actinoide von Thorium bis Plutonium
nach Multi-Nucleon-Transfer-Reaktionen. Aus diesem Grund wurde
ein 136 Xe-Strahl mit einer Energie von 1 GeV auf ein 238 U-Target
geschossen. Die schnellen strahl¨ ahnlichen Teilchen wurden nach der
Transfer-Reaktion mit Hilfe des magnetischen Spektrometers PRIS-
MA identifiziert. Die γ-Strahlen wurden von dem AGATA-Demons-
trator bestehend aus 5 AGATA-Tripel-Cluster-Detektoren detektiert.
Der innerhalb der Streukammer installierte zus¨ atzlicher Micro-Chan- nel-Plate-Detektor zur Teilchenmessung erm¨ oglichte eine kinemati- sche Koinzidenzmessung. Die Analyseprozeduren der beiden kompli- zierten Unterdetektoren AGATA und PRISMA wurden erweitert und an die spezifischen Anforderungen des neuen Ansatzes zur Spektrosko- pie der Actinoiden angepasst. Als Erstes wird die komplizierte Analyse des magnetischen Spektrometers PRISMA sowie L¨ osungen f¨ ur uner- wartetes Verhalten des Detektors, wie zeitabh¨ angige Verschiebungen und Aberrationskorrekturen, beschrieben. Das Resultat ist die Identi- fikation verschiedener Isotope der Elemente Barium bis Tellur, welche die hohe Qualit¨ at des PRISMA-Spektrometers und seiner Designpa- rameter verifiziert.
Die Analyse der Gamma-Spektren setzt eine detaillierte PSA und GRT-Analyse des AGATA-Demonstrators voraus. Die Entwicklun- gen zur Datenanalyse wurden in die AGATA-Gemeinschaft einge- bracht. Die Daten des AGATA-Demonstrators, des PRISMA-Spek- trometers und der Zusatzdetektoren wurden kombiniert um unter- grund-freie, Doppler-korrigierte Spektren f¨ ur strahl- und target¨ ahnli- che Reaktionsprodukte zu erhalten. Die simultane Doppler-Korrektur f¨ ur strahl- und target¨ ahnliche Ionen beinhaltet eine aufw¨ andige Opti- mierungsprozedur f¨ ur nicht beobachtbare experimentelle Parameter.
Die γ-Spektren der einzelnen Isotope und die Identifikation der Iso-
tope der PRISMA-Analyse sind konsistent. F¨ ur die strahl¨ ahnlichen
Teilchen werden γ-Spektren der Isotope 128−139 Xe vorgestellt und dis-
kutiert. F¨ ur die target¨ ahnlichen Atomkerne wurden γ-Spektren der
Isotope 236−240 U ermittelt. Mit einer Bedingung f¨ ur die verbleibende
Anregungsenergie nach der Multi-Nucleon-Transfer-Reaktion wurde
die Abdampfung von Neutronen oder die Spaltung der angeregten
Actinoidenkerne unterdr¨ uckt. Die Koinzidenz zwischen AGATA und
PRISMA wurde erstmals um eine Teilchenkoinzidenz der strahl- und
target¨ ahnlichen Kerne erweitert. Diese dreifache Koinzidenz erlaubt
weitere Untergrund-Reduktion. Die Resultate der einzelnen Xenon-
und Uranisotope demonstrieren den erfolgreichen Betrieb des AGA-
TA-Demonstrators im Verbund mit dem PRISMA-Spektrometer. Die
Qualit¨ at der γ-Spektren zeigt deutlich, dass die neuen Methoden der
PSA und des GRT die Erwartungen auch in anspruchsvollen In-Beam
Spektroskopie-Experimenten erf¨ ullen.
Contents
1. Introduction 9
1.1. AGATA . . . . 12
2. Characterisation of highly segmented HPGe detectors 17 2.1. Pulse shape analysis in AGATA . . . . 17
2.2. Characterisation methods . . . . 18
2.3. The AGATA Detector Library ADL . . . . 19
2.3.1. Layout of the ADL software . . . . 19
2.3.2. Pulse shapes of HPGe detector signals . . . . . 23
2.3.3. The Ramo theorem . . . . 24
2.3.4. Calculating the weighting potentials and the elec- trical field . . . . 25
2.3.5. Calculation of the signals . . . . 28
2.3.6. Simulations for AGATA PSA bases . . . . 34
3. Spectroscopy of neutron rich Th and U nuclei after multi- nucleon reactions 39 3.1. Introduction . . . . 39
3.2. Detector systems . . . . 44
3.2.1. AGATA Demonstrator . . . . 44
3.2.2. PRISMA magnetic spectrometer . . . . 44
3.2.3. DANTE particle detectors . . . . 46
3.3. Trigger, data acquisition and data processing . . . . . 47
3.3.1. Trigger . . . . 48
3.3.2. Front end electronics . . . . 48
3.3.3. Online processing and computer systems . . . . 49
3.4. Replay and analysis programs . . . . 52
3.5. PRISMA analysis for particle identification, tracking and kinematics . . . . 55
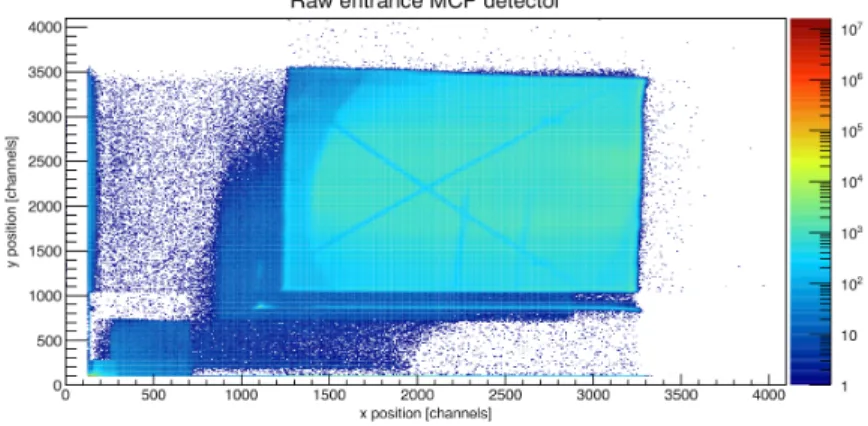
3.5.1. Calibration of the entrance MCP . . . . 55
3.5.2. Selection of Z . . . . 57
3.5.3. Time of flight (TOF) alignment . . . . 63
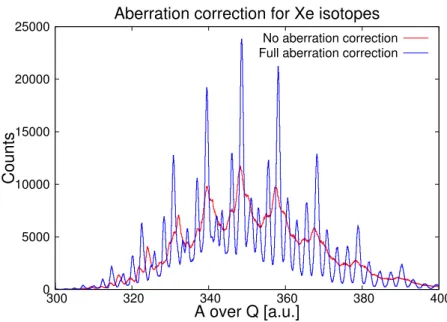
3.5.4. Aberration corrections . . . . 65
3.5.5. Charge state identification . . . . 69
3.5.6. Mass identification . . . . 70
3.6. In-beam spectroscopy with AGATA . . . . 76
3.6.1. Time alignment of the array . . . . 76
3.6.2. Energy calibration . . . . 81
3.6.3. Relative efficiency . . . . 84
3.6.4. Gamma multiplicity . . . . 85
3.6.5. Doppler correction . . . . 87
3.6.6. Kinematics of binary reactions . . . . 88
3.6.7. Optimization of the Doppler correction . . . . 90
3.6.8. Impact of PSA algorithm . . . 102
3.7. Gamma ray spectra . . . 104
3.7.1. Cuts on Elements . . . 107
3.7.2. Background radiation . . . 108
3.7.3. Q
rvalue . . . 113
3.7.4. Particle coincidence . . . 114
3.7.5. Gamma ray spectra of individual isotopes . . . 121
4. Conclusion 187
5. Outlook 191
References 197
List of Tables 213
List of Figures 217
A. Example of an ADL simulation 227
B. Template files for a simulation of detector A001 230 C. Experiments of the LNL AGATA campaign 235
D. Online spectra 237
E. Glossary 239
1. Introduction
The availability of energetic beams of short-lived nuclei opened a wide range for experiments in nuclear physics enlargening our knowledge on the structure and dynamics of nuclei under extreme conditions.
The results are not only of highest importance for nuclear physics, but also address open questions in astrophysics, solid-state physics and the study of fundamental interactions. Several European facil- ities like FAIR (GSI, Darmstadt, Germany), HIE-ISOLDE (CERN, Geneva, Switzerland), SPIRAL2 (Caen, France) and SPES (INFN, Legnaro, Italy) will provide Radioactive Ion Beams (RIB) with new accelerator facilities. All these new facilities have in common, that the experimental conditions request a powerful detector system for in-beam γ-ray spectroscopy investigations. An excellent energy res- olution, a wide energy range and a high efficiency combined with a good angular resolution and the ability to cope with high counting rates are the demands on such a spectrometer.
The quest for an optimal detector system fulfilling all the demands must be based on the basic principles of γ-ray interaction with mat- ter which are the photoelectric effect, Compton scattering and pair production [1]. The photoelectric effect is dominant up to an energy of 200 keV. From here up to a few MeV the Compton scattering be- comes the most probable interaction and for higher energies the pair production takes over. The cross-section of the photoelectric effect is proportional to Z 4−5 , for the Compton scattering it is proportional to Z and for the pair production to Z 2 , where Z is the atomic number of the absorbing material. Another important point is the size of the detectors and the density of the used material.
Scintillation detectors like NaI(Tl) or LaBr 3 (Ce) allow for a large volume and a high Z resulting in detectors with highest efficiency. In general they have excellent timing properties. However their energy resolution is severely limited to a few percent of the deposited energy [1].
In contrast, semiconductor detectors provide a very high energy res-
olution as the energy needed to create an electron-hole pair are just
a few eV. The atomic number of Germanium, the availability of large
crystals with a volume up to 450 cm 3 and the small band gap of 0.7 eV
resulting in an excellent energy resolution makes Germanium the first choice for such a semiconductor based spectrometer. There are other materials that compete with Germanium. However, Silicon has only nearly half the atomic number making full absorption less probable.
CdZnTe has a high Z and could be operated at room temperature, whereas Germanium detectors must be operated at liquid nitrogen temperature (< 110 K) due to their small band gap. Despite from three times worse energy resolution only small CdZnTe crystals can be produced and result in a low efficiency [2].
The first generation of Germanium detectors were very small, as the impurity concentration of the crystals were high. In the 1960s a pro- cess was developed to compensate the large space charge of the oc- curring p-type excess impurities in Germanium by the diffusion of Lithium. Now it was possible to grow large crystals with high ef- ficiency. This development pushed the research on the structure of the atomic nucleus and provided the most powerful tool for high res- olution γ-ray spectroscopy. Several detectors were combined to de- tector arrays enabling γγ coincidence experiments. In the late 1970s high purity Germanium (HPGe) detectors became commercially avail- able and in the 1980s the production of the HPGe crystals advanced to a stage, where comparable large crystals were achieved and the Lithium drifted Germanium detectors became obsolete. National de- tector arrays like OSIRIS in Germany or TESSA in the UK were augmented with Bismuth Germanate (BGO) shields. These shields were operated in anti-coincidence and suppressed Compton scattered γ-rays escaping a detector. In this way a high peak to total ratio was achieved. The next generation of spectrometers were the 4π de- tector arrays GAMMASPHERE in the United States of America and EUROBALL in Europe. GAMMASPHERE consists of 110 cylindri- cal HPGe detectors each one surrounded by a hexagonal BGO shield.
The EUROBALL array was build in several steps and variations and
finally had the same efficiency and resolving power like GAMMAS-
PHERE. A new mode of operation called add-back was introduced for
the newly developed cluster detectors. In this mode the different co-
incident signals of neighbouring unshielded detectors inside a cluster
were summed up to gain efficiency, especially at high energies. These
huge detector systems pushed forward the sensitivity limit for nuclear
structure research. The evolution of Germanium detectors and arrays is well summarized in [2].
The technological progress in several fields paved the way for the development of position sensitive tracking detectors. The electrical segmentation of large volume HPGe detectors allows a position sensi- tive readout of the crystals. The outer contact of segmented crystals is divided by etching and each segment electrode is read out and the signal is amplified individually. With the availability of fast digital electronics not only the energy, but also the pulse shapes of all the de- tector signals are recorded. The advances in computing allow then the deconvolution and the storage of these signal traces. Pulse shape anal- ysis (PSA) is utilized to determine the interaction position within one detector segment. Finally the track of the different interactions within the detector array can be reconstructed by tracking algorithms. First arrays of segmented HPGe detectors like the SeGa [3] or the MINI- BALL [4] spectrometer were build. With the segmented detectors another new operation mode evolved: γ-ray imaging [5]. Due to the Compton scattering process the position of an emitting source with known energy can be located. Combined with the high energy reso- lution of a HPGe detector and the huge amount of available nuclear decay data a position and element sensitive detector can be build.
Actually new 4π gamma-ray tracking spectrometers are developed
and constructed in order to cope with the demands introduced at
the beginning. In the U.S. it is the GRETA [6] spectrometer and in
Europe the Advanced Gamma Tracking Array (AGATA) [7, 8]. In
this work new developments for the γ-ray tracking technique were ad-
vanced in order to increase the performance of the AGATA detectors
and to achieve an improved position resolution of the new detector
array. The analysis of a first experiment with AGATA demonstrates
the successful implementation of these developments under demand-
ing experimental conditions. Details of the technical design of AGATA
are discussed in the following section.
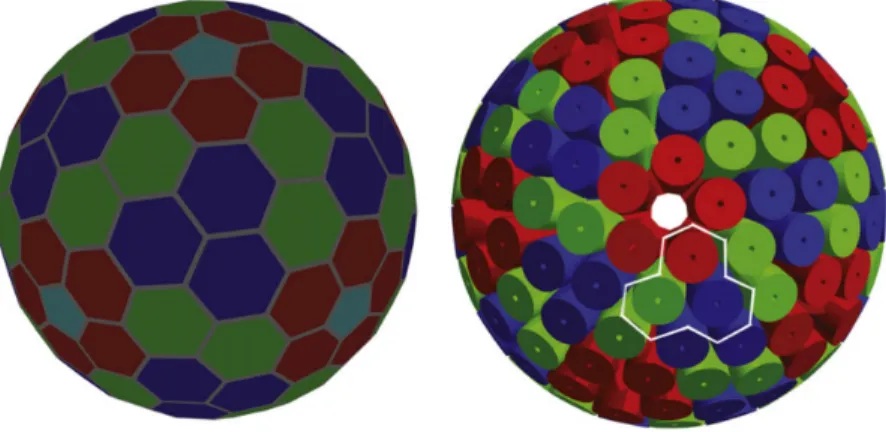
Figure 1: Design of the AGATA spectrometer. Computer aided de- sign images of the tiling of the sphere (left) and the 180 crystal configuration (right). The cyrostats and the detec- tor encapsulation are not shown. Taken from [8].
1.1. AGATA
AGATA is developed and financed by more than 40 institutions from 12 different countries and is based on the progress made within some precursor projects in Europe (e.g. EUROBALL and MINIBALL).
AGATA is a flexible and mobile instrument operated at different Eu- ropean laboratories. After a first campaign at the Laboratori Nazion- ali di Legnaro (LNL) in Italy it was moved to the GSI facility in Germany in spring 2012. The next destination will be the GANIL laboratory in France and the move is scheduled for spring 2014. In future the spectrometer will be operated at the new radioactive beam facilities such as FAIR, SPIRAL2, SPES and HIE-ISOLDE. AGATA will have a large impact on nuclear physics research and the develop- ment of the device already was a considerable achievement implying technical advances in a wide range of other applications.
An overview of the complete AGATA system is given in [8]. The
conceptual design of AGATA is described extensively in [9]. The
maximisation of the detection efficiency and resolving power is the
main goal of the new design. The result is an optimized configuration
consisting of 180 individual crystals with three different geometries resulting in nearly 4π solid angle coverage (figure 1). The inner radius is big enough to employ ancillary detector systems.
The AGATA detectors are based on encapsu- Segmented
HPGe detector
Analog to Digital
Front End Electronics
Pulse Shape Analysis
Event Building and Merging
Gamma Ray Tracking
analogue signals
digital signals 11100101
00110111 10111101
validated signals 11100101
00110111 10111101
energy and position (Eᵧ,x,y,z)
gamma and ancillary
Figure 2
lated and electrically segmented closed-end coax- ial n-type HPGe detectors. The crystals have a length of 90 mm, a rear diameter of 80 mm and a weight of about 2 kg. At the front they are tapered into a hexagonal shape with a slight asymmetry depending on the type of crystal ge- ometry. Each detector has 36 segments and one central core contact. One detector of each ge- ometry is housed in an AGATA triple cryostat [10]. The cryostat ensures the cooling to liquid nitrogen temperature of the detectors. To op- erate the detectors in reverse bias mode a high voltage of up to 5000 V is applied to the core electrode. The essential core electrode signal is read out by a so called dual core preamplifier[11]
that allows two different amplification gains, a high and a low gain. All segment electrodes are connected to individual low noise charge sen- sitive preamplifiers [12] with a cold first feed- back stage consisting of a field effect transistor (FET) situated nearby the cooled detector cap- sule. In its final configuration the number of signals will result in 6480 high resolution spec- troscopy channels for the final stage of AGATA.
The excellent performance of the first detectors is summarized in [13].
The data acquisition and processing scheme of
AGATA is shown in figure 2. After reading
out the analogue signals of the AGATA detec-
tors they are sampled in custom made digitizers
and transferred to the pre-processing electron-
ics, where the trigger and the evaluation of good events reduces the
amount of data. First timing, multiplicity and energy filters are ap-
plied to the digital signals. The complete data, including the signal trace, are transferred via optical links to a computer farm. Here the signals are calibrated and analyzed using PSA algorithms to determine the position of each interaction point with a higher precision. Latest investigations show a position resolution of 4 mm FWHM [14]. After the PSA an event builder consolidates the γ-ray and ancillary events.
Finally a tracking algorithm reconstructs the initial γ-ray event. The algorithm is based on the probability for an interaction at a certain energy, its scattering angle and the penetration depth.Therefore the PSA is at the core of the new detection scheme and directly consti- tutes the over-all performance of the adjacent tracking algorithm. At the moment all the data of the experiments are written to disk in order to profit from future developments.
Within this thesis a software package for a realistic calculation of the signals of highly segmented HPGe detectors for γ-ray spectroscopy was developed. The input of the calculations is partially based on experimental measurements of the detector characteristics. The cal- culations are essential for AGATA, as the results are directly used to create signal databases for the PSA. The presented signal databases of AGATA detectors are exploited for in-beam spectroscopy experiments with AGATA.
One of the first experiments with the AGATA demonstrator coupled
to the magnetic spectrometer PRISMA was analyzed within this the-
sis. The experiment aimed for the in-beam spectroscopy of neutron
rich Thorium and Uranium nuclei after multi-nucleon reactions. As
this was one of the first analysis done for an AGATA experiment, the
performance of the PSA and the complete AGATA array was a major
aspect and focus of the present work. Finally experimental results
from in-beam spectroscopy of various Uranium and Xenon isotopes
after multi-nucleon transfer reaction are presented.
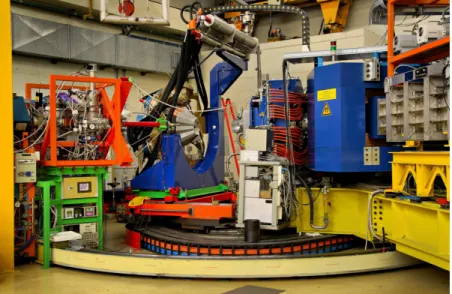
Figure 3: Picture of the AGATA demonstrator mounted at the Lab-
oratori Nazionali die Legnaro (LNL) in Italy. The HPGe
detectors are located in the triple canister with hexagonal
shapes inside the grey Aluminium end caps. The first cold
amplification stage is also sitting inside the end caps. Af-
ter the commissioning phase of the new spectometer a se-
ries of experiments were performed in combination with the
PRISMA spectrometer in the period from 2010 to 2012.
2. Characterisation of highly segmented HPGe detectors
2.1. Pulse shape analysis in AGATA
The AGATA spectrometer employs PSA to determine the positions of the interaction points with a much higher position resolution than the physical segmentation of the detector volume. A γ-ray will normally have a chain of interactions in the Germanium detectors (e.g. 3-4 at 1.3 MeV). There can be more than one interaction in one segment of a detector and / or the γ-ray can be scattered to another segment of the same crystal or to an adjacent detector. A high precision of the interaction positions is required in order to perform the gamma ray tracking process with high efficiency. The signals of every detector after the pre amplifier are digitized using a 14-bit analogue to digital converter with a rate of 100 MHz. This large dataset must be com- pared to an existing set of signal pulses. This comparison includes the signal of the core electrode, the signal of the hit segment electrode and the signals from the neighbouring segment electrodes for every inter- action. This is needed because the transient signals induced in the neighbouring segment electrodes give important information for the angular and z position of the interaction.
As the PSA runs online and must be fast, a set of algorithms were developed, such as grid search [15], genetic algorithms [16], wavelet decomposition, a matrix method [17] and a particle swarm algorithm [18]. All algorithms compare the recorded pulses with a database that holds signal pulses of defined positions in the detector. At the moment only the grid search algorithm is implemented in the online analysis.
The signal library includes all signal traces over a 2 mm grid. Before the search algorithm is applied the transfer function of the acquisition electronics and the differential crosstalk is folded in the signals of the library. The algorithm calculates for the nearest neighbours of the hit segment a figure of merit.
F OM = X
segments i
X
timesteps j
|v
mi,j− v
i,jd|
pv
mare the measured signals and v
dare the signals within the database.
p is a distance parameter defining a metric. For a gaussian distribu- tion p = 2 would be the best choice. Investigations of the algorithm report a best position resolution with a p = 0.3 that is now used as a standard. The adaptive grid search is only capable of identifying single interactions within one segment of a crystal. Other algorithms, like the particle swarm algorithm [18], could identify more interactions within the same segment.
In order to generate a database for looking up the different positions different detector characterisation methods are used.
2.2. Characterisation methods
To characterise an AGATA like detector requires, that sets of core and segment signals for all the interaction points on a defined grid within the detector volume are determined. This vast amount of sig- nals and the corresponding position information is stored in a library readable for the PSA algorithms. This can be achieved experimentally by measuring signals of defined positions. The technique developed at the University of Liverpool is a coincidence system [19, 20, 8], that puts a heavily collimated source 137 Cs (662 keV) in front of the detector. The x and y coordinate is defined by the position of the source, whereas the z coordinate is measured using a secondary colli- mation system perpendicular to the xy plane equipped with NaI(Tl) detectors. γ-rays that Compton scatter under 90
◦with an energy of 288 keV are measured in coincidence and determine the z position of the interaction. Another system based on the same principle but with a different secondary collimation and detector system was de- veloped at the University of Orsay [21][8]. A third system based on the coincidence principle is build at the University of Salamanca [8].
Using the pulse shape comparison scan (PSCS) method [22] a new scanning system is developed at Strasbourg [8]. In this case only a collimated source is needed. The detector is rotated and the position is determined by comparing the pulse shapes of crossing beam lines.
At GSI-Darmstadt the PSCS principle is extended with γ-ray imaging
techniques based on positron annihilation [23][24][8].
A new method was proposed, in which the geometry of the crystals and the homogeneous distribution of γ-ray interactions from a source run is used to generate a dataset [25].
All scanning systems have in common, that every individual crystal needs to be scanned and that it takes time to prepare the measure- ment, to take and analyse the data. A complete different approach is on a calculated library of datasets which is based on the properties of the individual detectors. For this reason computer programs were developed to simulate and calculate the detector responses. Up to now three codes are available, the Multi Geometry Simulation (MGS) code [26], the Java AGATA Signal Simulation (JASS) toolkit [27] and the AGATA Data Library ADL which is part of this thesis.
2.3. The AGATA Detector Library ADL
The AGATA Detector Library (ADL) was developed to calculate sig- nal databases for the PSA algorithms of the AGATA spectrometer.
The library is written in the computer language C and is used for real- istic simulations of semiconductor detectors in nuclear physics. In the following discussions the focus lies on highly segmented HPGe coax- ial detectors, although many points can be transferred to different geometries or semiconductor materials.
2.3.1. Layout of the ADL software
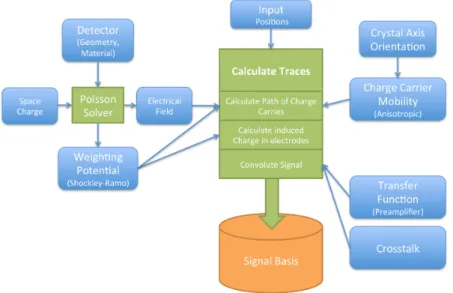
In figure 4 a block diagram of the ADL is shown. The routines are
coloured in green and the user provided input is coloured blue. The
main routine called Calculate Traces consists of three subroutines
and takes the interaction position as input. The first subroutine cal-
culates the path of the charge carriers through the detector material
for every time step. It needs the electrical field and a mobility model
of the charge carriers as an input. The second subroutine calculates
for every time step the induced charges in all electrodes. It needs
the weighting potentials to do this. The last subroutine convolutes
the signal with pre defined functions. The routines and their input
parameters will be described in detail within the next sections.
Figure 4: Block diagram of the routines (green) and the input (blue) for an ADL simulation
ADL intents to be flexible and extendible. The library has a spe- cial registration of the routines and input parameters controlled by template files. An overview of the parts of ADL is given in table 1.
To illustrate the working principle of the library the input and out-
put (IO) of data is discussed. Three different possibilities are pro-
vided listed in table 2. To change the used IO routine the tem-
plate file Template_READWRITE.txt has to be changed. The rou-
tine ADL_Setup_READWRITE implemented in ADL_ReadWrite.c reads
in the template file and sets the right routines by linking the according
function pointers. The ADL_Status_READWRITE routine implemented
in ADL_ReadWrite.c reports the current status of this part of the li-
brary. The real work, like writing text files, is then implemented in the
according source file. When adding routines, they have to implement
the interface defined in ADL_ReadWrite.h and in ADL_ReadWrite.c
the registration of the interface has to be added. In this way the com-
plete library is structured. Routine implementation and definition are
Parts Description
ADL Main file setting up all other templates used in for the simu- lation
CONVOLUTION Controls how to convolute the signals with a transfer function DRIFT Set up the drift process of the
charge carriers inside the detec- tor
EVENT Basic event information
FIELDS Geometries, weighting and elec- trical fields are set up
READWRITE Input and output
TIME Settings for the filter times and other timing
TRACES Conditions and settings for the trace calculation
TRAPPING Correction parameters for neu- tron correction
Table 1: Parts of the ADL controlled by template files
File Description
ADL_ReadWrite.h Header file describing routines for setting up IO routines ADL_ReadWrite.c Source file implementing rou-
tines for setting up IO routines ADL_ReadWrite_BIN.h Header file describing IO rou-
tines for binary data
ADL_ReadWrite_BIN.c Source file implementing IO rou- tines for binary data
ADL_ReadWrite_TXT.h Header file describing IO rou- tines for text data
ADL_ReadWrite_TXT.c Source file implementing IO rou- tines text data
ADL_ReadWrite_TKT.h Header file describing IO rou- tines for TKT
ADL_ReadWrite_TKT.c Source file implementing IO rou- tines for TkT
Template_READWRITE.txt Template file controlling which routines to use
Table 2: ADL files implementing the in and output of data
written in the source and header files, control of the behaviour of the according routines is set up in the template files.
The important template files and routines, especially for HPGe de-
tectors, will be discussed. A simple example program with its corre-
sponding template files can be found in the appendix A.
2.3.2. Pulse shapes of HPGe detector signals
Radiation interacts with the active detector material by creating elec- tron hole pairs. Depending on the type and the energy of the radiation the volume of the created charge cloud changes. For example a single interaction of a 1 MeV γ-ray in Germanium knocks out fast electrons that loose their energy by creating electron hole pairs resulting in a charge cloud with a radius of 0.5 mm [27]. Whereas cosmic muons interacting with the detector material form a line track of charges.
Once the charges are created inside the active Ge material, they travel along the electric field of the reversed biased semiconductor detector and induce a signal in the electrodes. In general semiconductors are described by the Van Roosbroek equations [28][29], that aside from the poisson equation for the electrical field, also comprise continuity equations for the electron and hole densities. The equations already assume a quasi static field approximation, such that the induced sig- nals at all electrodes of the detector are instantaneously created. This approximation is valid, as the time needed to spread this information is the small distance in the detector divided by the speed of light.
In our case of large volume detectors more valid approximations are applied to simplify the problem. A point like interaction for γ-ray spectroscopy is assumed, as the radius of the charge cloud is small and full photo events with energies above 1 MeV are unlikely. A par- tial shielding from the external field occurs in the detector, that causes a tiny time delay required to separate the electrons and holes. This shielding effect significantly affects the PSA for particle identification in Silicon detectors [30]. It roughly scales with the stopping power along the particle track and is inverse proportional to the external applied field. The time delay is small compared to the collection time of the charge carriers. The stopping power for electrons in Germanium is two orders of magnitude smaller than for alpha particles. Therefore this effect is neglected.
Depending on the geometry of the detector, the applied voltage and
the impurity concentration of the semiconductor material the time
until all charge carriers are collected changes. The initially formed
charge clouds could change their shape as diffusion causes a transfor-
mation of a delta distribution into a Gaussian distribution. However
also this effect will be small and could be neglected in our case, al- though diffusion could play a small role at the segmentation lines of the segmented detectors. The two charge carriers have differ- ent anisotropic mobilities resulting in different collection times for electrons and holes depending on the orientation of the crystal axis [31, 32].
The two signals at the electrodes of a simple semiconductor detector, for example a planar Germanium detector, are identical despite from being inverted and small differences caused by the electronic noise.
The requirement hereto is that the sum of both weighting potentials is one.
Segmentation of detectors is done by dividing the electrodes. This could be either just the cathode, like in AGATA, or both electrodes like in a double sided silicon strip detector. In these systems the sig- nals of the hit segments look different depending on the position. Non hit segments show so called transient charge signals. While the ampli- tude of the hit segments is integrated over the feed back capacity, the transient charge signal vanishes after the collection process. Summing up anode segments and cathode segments to two signals results in the signals of a non segmented detector.
Different types of detectors need different processing of their signals for a good position resolution. A planar double sided strip detector has segments in the size of a few millimetres and it is sufficient for a good position resolution to use the segmentation information. How- ever a large volume coaxial HPGe detector, like the AGATA detectors [10], needs pulse shape analysis to achieve a position resolution of a few millimetres.
2.3.3. The Ramo theorem
To calculate the induced charge Q
iin an electrode i for a unit charge placed at position ~ x inside the active detector material the weighting potential φ
i(~ x) is used. It is defined by the following definition:
Q
i= −qφ
i(~ x)
The Ramo theorem [33] is used to calculate the weighting potentials
for all electrodes and positions inside the detector. The assumption of
a quasi static field is mandatory. As shown in [34] the Ramo theorem does not depend on the presence of space charge. The solution for the weighting potentials are obtained as a solution to the Laplace equation
∇ 2 φ(~ x) = 0 with the condition
φ
i|S
j= δ
i,jfor the boundary S
j. With the solution of the equation it is enough to evaluate the weighting potential at a given time and position of the charges for every electrode.
Q
i(t) = − X
q
qφ
i( x
q~ (t)) (1) An example of the weighting potential calculated with ADL is shown in figure 6.
2.3.4. Calculating the weighting potentials and the electrical field First the weighting potentials [33] and the electrical field have to be calculated. Depending on the geometry of the detector, this can be done analytical or numerical. An analytical example is the true coax- ial detector 1 . The Possion equation
∆φ = − ρ
(2)
in cylindrical coordinates becomes d 2 φ dr 2 + 1
r dφ dr = − ρ
The core electrode of a true coaxial detector defines the inner radius r 1
and the outer electrode the outer radius r 2 . The boundary condition is the applied voltage V between the two electrodes φ(r 2 )−φ(r1) = V . Solving the equation for E(r) = − dφ
dr results in
−E(r) = − ρ
2 + V + 4
ρ(r 2 2 − r 2 1 ) r ln
rr21 1
See for example [1] page 422
Assuming the space charge as constant.
The ADL library provides basic geometries like the true coaxial or a planar detector. More complex geometries are provided as SIMION 2 potential arrays. The user can easily add new geometries as SIMION potential arrays or implement new routines to add different formats.
The weighting potentials could be solved by any program. However a 3D Poisson solver is implemented in the library to calculate the fields.
It is based on the established technique of successive over relaxation [35]. In principle the detector is split into many small cubes called voxels. Each voxel ν
iis either an electrode or active detector material.
To calculate the weighing potential for one electrode, this electrode is set to 1 V and all other electrodes are set to 0 V. The solver now iterates over all voxels. If the voxel is active material, it takes the average of the values of the 6 neighbouring voxels as its new value plus some over relaxation parameter for faster convergence.
ν
inew = ν top + ν bottom + ν left + ν right + ν front + ν back 6
+ Ξ ·
ν top + ν bottom + ν left + ν right + ν front + ν back
6 − ν
iThe value of Ξ is changed after 10 iterations from 0.67 to 0.9. If the voxel is an electrode, it is not changed. The value change is monitored and if it becomes small enough the calculation stops.
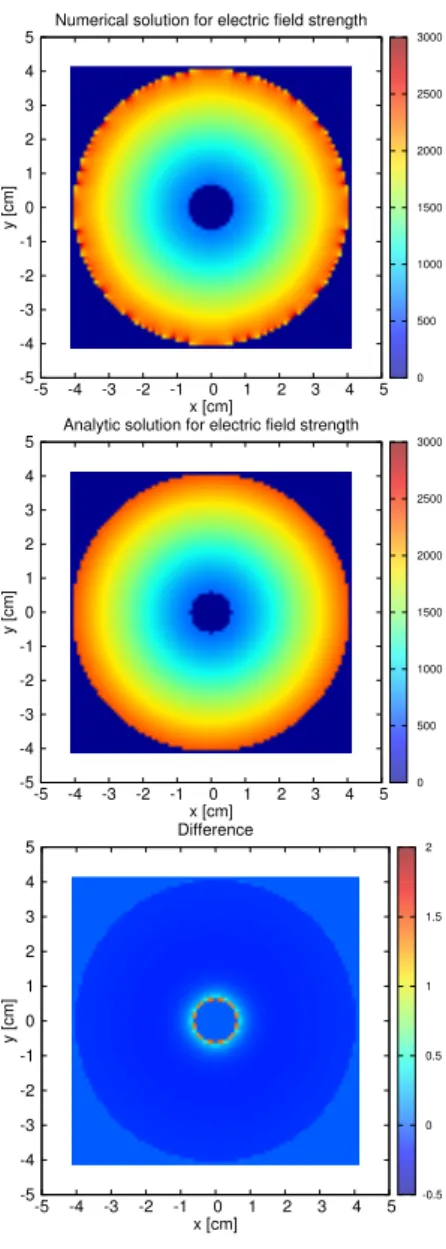
The numerical solution of the solver is compared with the analytic one. Both simulations were calculate and the differences checked.
The results are shown in figure 5. Only small deviations occur at the boundaries and are in the per mille range.
Different parameters can be adjusted in the template files depending on the type of input. For the analytical solvable geometries the applied high voltage, the impurity concentration, geometric details and the relative permittivity of the medium are set. For the SIMION files the different weighting potentials for all electrodes and the contribution of the impurity concentration must be set as file input.
2
Documentation of and tools for the SIMION potential arrays can be found at
http://simion.com/sl/
Figure 5: Electric field strength for a true coaxial HPGe detector. The
numerical simulation (top) and the analytical (middle) show
a good agreement, as indicated in the difference (bottom)
between them. Only at the boundaries small deviations oc-
For all AGATA geometries SIMION files were calculated and are avail- able from the IKP AGATA webpage 3 . In figure 6 the weighting po- tential of the core and of the segment A4 are shown. To create a full simulation of an AGATA detector the weighting potential for all 36 segment and the core electrode were calculated.
The electrical field is the weighting potential of the core electrode scaled by the applied bias voltage plus the space charge contribution.
The space charge is the uncompensated impurity of the germanium material and can be measured [36][37]. The contribution of the space charge to the electrical field is the calculated electrical field of the distribution for the boundary electrodes set to 0 V.
For the AGATA detectors the manufacturer 4 provides information on the impurity profile of the detectors. These information were verified by independent pulser measurements for the first asymmetric detector systems [38]. The analysis described in [39] was adapted for asym- metric detector systems by changing the mean radii of the cylindrical approximation depending on the asymmetry of the detector.
2.3.5. Calculation of the signals
The simulation is based on the interaction positions and the deposited energy as an input. This is implemented in a simple event structure that is controlled by the event template. Here the maximum number of simultaneous interactions per event and the number of segments has to be set. Furthermore the number of time steps and the time resolution is controlled by the template. It is also possible to read events from text or binary files.
At the interaction position two point like charges (the electrons and the holes) are generated and travel along the electric field depending on their mobility. Different models are provided by the library for the mobility. A basic model assumes a constant mobility. Another imple- mented model, see [1] p. 434, assumes an empirical dependence of the drift velocities with the electrical field strength. However, recent pub- lications [31, 32] show that the mobilities of electrons and holes in the
3
http://www.ikp.uni-koeln.de/agata
4
CANBERRA Industries Inc.
Figure 6: Weighting potentials for the core electrode (top) and seg-
ment electrode A4 (bottom) of detector A001. The complete
region outside the active Germanium material are marked
as electrodes with a fix potential of 1 V. The units of the
z-scale are Volt.
Crystal axis orientation φ 0.7853981633
θ 0.0
ψ 0.0
Electron mobility parameters
Mobility in h100i Inter valley scattering rate
E 0 507.7 E 0 1200
β 0.80422 ν 0 0.459
µ 0 0.0371654 ν 1 0.0294
µ
n-0.0001447 ν 2 0.000054
Hole mobility parameters Mobility in h100i Mobility in h111i
E 0 181.9 E 0 143.9
β 0.73526 β 0.7488
µ 0.062934 µ 0.062383
Table 3: Parameters for the mobility of electrons and holes in Germa- nium according to the parametrization given in [31].
Germanium material are not isotropic, but depend on the orientation of the crystallographic axis of the cubic centred Ge crystal structure with respect to the electric field . This realistic description of the mo- bility inside Germanium crystals is implemented in ADL_Drift_Ge.c and set up with the template file Template_DRIFT_GE.txt. Here the orientation of the crystal axis and the parameters described in [31]
are configured. The used parameters are listed in table 3. The axis orientation is given as the orientation of the h100i axis in Euler angles.
The orientation of the asymmetric AGATA crystals were measured
[40]. The method is based on the use of a collimated 400 kBq 241 Am
source emitting 60 keV γ-rays in combination with a small lead col-
limator of 1.5 mm radius and 1 cm length. The low energy γ-rays
deposit their energy within a few millimetres of the active detector
material. The created holes are collected immediately and only the
drifting electrons form the signal. The crystal is scanned from the
front over a circle with a fixed radius of 2.35 cm. The differences in
Figure 7: Aligned masks for scanning the crystal axis
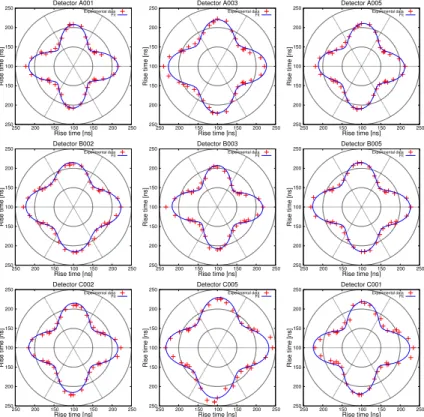
rise time between different angles result mainly from the crystal in- ternal structure. The impact of the hexagonal shape of the crystals is reduced. A mask, see figure 7, indicating 32 different scanning angles was placed at the front face of the detector. The mask was aligned by requesting that the count rates of two neighbouring segments are equal when the collimated source is placed on the corresponding seg- mentation line and that at the centre of the mask all front segments showed nearly equal count rates. The data acquisition recorded the energy and the full trace signals of every event. In the analysis the signals were filtered for total energy deposition and an average trace was build for every scan position. The resulting 10 % to 90 % rise times are summarized in figure 8. The applied fit function is
T 10 90 (θ) = A · (1 + R 4 · cos(4 · (θ − θ 4 ))) · (1 + R 2 · cos(2 · (θ − θ 2 ))) with A, R 4 , R 2 , θ 4 and θ 2 as fit parameters. The largest contribution comes from the second factor that models the 4 fold symmetry of the anisotropic mobility. θ 4 describes the crystal orientation. The third factor was added to correct for observed deviations of the 4 fold symmetry. The results show clearly the orientation of the axis, especially that it is constant through all detectors.
In figure 9 the magnitude of the electron drift velocity is shown for
the analytical solved true coaxial detector. The left plot assumes an
250 200 150 100 150 200 250
250 200 150 100 150 200 250
Rise time [ns]
Rise time [ns]
Detector A001
Experimental data Fit
250 200 150 100 150 200 250
250 200 150 100 150 200 250
Rise time [ns]
Rise time [ns]
Detector A003
Experimental data Fit
250 200 150 100 150 200 250
250 200 150 100 150 200 250
Rise time [ns]
Rise time [ns]
Detector A005
Experimental data Fit
250 200 150 100 150 200 250
250 200 150 100 150 200 250
Rise time [ns]
Rise time [ns]
Detector B002
Experimental data Fit
250 200 150 100 150 200 250
250 200 150 100 150 200 250
Rise time [ns]
Rise time [ns]
Detector B003
Experimental data Fit
250 200 150 100 150 200 250
250 200 150 100 150 200 250
Rise time [ns]
Rise time [ns]
Detector B005
Experimental data Fit
250 200 150 100 150 200 250
250 200 150 100 150 200 250
Rise time [ns]
Rise time [ns]
Detector C002
Experimental data Fit
250 200 150 100 150 200 250
250 200 150 100 150 200 250
Rise time [ns]
Rise time [ns]
Detector C005
Experimental data Fit
250 200 150 100 150 200 250
250 200 150 100 150 200 250
Rise time [ns]
Rise time [ns]
Detector C001
Experimental data Fit
Figure 8: Rise times depending on the angle of the interaction for nine
asymmetric AGATA detectors.
-5 -4 -3 -2 -1 0 1 2 3 4 5
-5 -4 -3 -2 -1 0 1 2 3 4 5
y [cm]
x [cm]
Electron velocity with istropic mobility
0 2 4 6 8 10 12 14 16
-5 -4 -3 -2 -1 0 1 2 3 4 5
-5 -4 -3 -2 -1 0 1 2 3 4 5
y [cm]
x [cm]
Electron velocity with anistropic mobility
0 2 4 6 8 10 12 14 16
Figure 9: Simulation with isotropic (left) and anisotropic (right) mo- bility for the analytic solution of the true coaxial detector
isotropic drift mobility. The right plot an anisotropic mobility. The four fold symmetry of the velocity results in different rise times of the signals and reproduces the measured behaviour.
The routines that calculate the path of the charge carriers along the electrical field are implemented in ADL_Traces_NUMRES.c and config- ured in the according template Template_TRACES_NUMRES.txt. The calculation is based on the 5th-order Runge Kutta integration method with adaptive step size control 5 . The induced signals for every elec- trode of the detector are calculated depending on the drift of the electrons and holes to the electrodes. For every time step and for each interaction the weighting field evaluated at the position of the electrons is subtracted from the weighting field evaluated at the po- sition of the holes. These differences are multiplied by the charge produced at the individual interaction, see formula (1). The sum of all interactions results in the signal set for the given event.
Finally these traces are convoluted with realistic behaviour of the detector system. The different polarity of the pre amplifiers are set up as a convolution function. The transfer function of the pre amplifier or the cross talk of segmented crystals could be taken into account.
5
from [35] (Chapter 16.2 p.714)
Actually in the online analysis of AGATA these functions are folded in the signals of the library, as they could vary for different detector and digitizer configurations.
Additionally the library provides routines to calculate the trapping rates relevant for neutron damage correction as described in [41]. The rates are added to the PSA bases and are used in the neutron damage correction of the AGATA online analysis.
2.3.6. Simulations for AGATA PSA bases
The computer program that calculates a PSA base for AGATA iter- ates over the active detector volume with a defined grid size. The latest PSA bases for the AGATA detectors are available through the AGATA web page of the IKP 6 .
In the following example a simulation for the detector A001 is de- scribed. In AGATA a 3D grid size of 2 mm is used. For an A type detector 47156 positions inside the detector volume are calculated.
The template files with the precise values for all routines are summa- rized in appendix B. The potential arrays for the different geometries are available at the AGATA web page of the IKP. The complete set consists of 36 segment weighting potentials and one core weighting potential. Furthermore 5 files for the electrical field are given. The first one is the weighting potential for the core and represents the electric field in the detector without any space charge. It is scaled by the applied voltage, that is for detector A001 5000 V. The other files include refined space charge distributions that must be scaled accord- ing to the data reported by the manufacturer. To calculate the charge collection process the anisotropic mobility model is used including the measured axis orientation. Single interactions are calculated with an energy deposition of 1 keV. The trace length is set to 600 ns with a 5 ns step width. In addition to the trace signals the trapping rates for the online neutron damage correction are calculated for every position.
In figure 10 the simulated traces for this AGATA detector are shown.
In the top plot the core signal for different interaction radii are shown.
The effect of the different mobilities of electrons and holes is clearly
6
http://www.ikp.uni-koeln.de/agata
0 20 40 60 80 100 Time [5 ns]
0 0.2 0.4 0.6 0.8 1
Normalised Amplitude
5.75 9.75 13.75 17.75 21.75 25.75 29.75 33.75 37.75
Figure 10: Simulated traces for an AGATA detector. Top shows the core signal for different radii and bottom shows the tran- sient signals induced in a non hit neighbouring segment.
Colour code as indicated in the bottom graph.
visible. For small radii the faster electrons are collected immediately while the slower holes still have to drift to the segment electrode.
The shortest rise time occurs at an intermediate position, where the collection process for both signals is equal. Then for larger radii the time of the electrons to be collected is longer than for the holes, as they have to drift to the core electrode. In the bottom plot of figure 10 the transient signals in a segment next to the hit segment are shown.
Depending on the distance of the interaction to the non hit electrode, the amplitude of the transient signal varies.
The PSA bases sets used in the AGATA online and offline analysis are generated by simulations based on ADL. In figure 11 the simulated traces are compared to a measurement with a 60 Co source after the PSA. The top of the plot shows an event with a γ-ray energy of 1172 keV deposited in segment A1. The middle of the plot shows an event with a γ-ray energy of 1332 keV. The energy was distributed over the segments C3, E1 and E3. In the two bottom graph the distribution of hits for different z slices are shown.
The position resolution depends on the quality of the calculated signal bases. To obtain a position resolution different techniques were em- ployed and up to now a final position resolution below 5 mm (FWHM) is obtained for a gamma energy above 1 MeV. The first result is de- scribed in [42]. The technique compares a Monte Carlo simulations of the detector response with an experiment performed at the IKP Cologne. In the experiment a 48 Ti beam with 100 MeV impinged on a deuterated titanium target. The reaction 48 Ti(d, p) 49 Ti was inves- tigated in inverse kinematics. The γ-rays were measured with the first symmetric AGATA triple. To reconstruct the velocity vector of the scattered nucleus a double-sided silicon strip detector (DSSSD) was used to detect the emitted proton. The performance of the Doppler correction was compared to simulations taking into account the dif- ferent contributions that cause a broadening of the peak. The final position resolution is of the order of 5 mm at an energy of 1382 keV.
This result is adequate to reach the design performance of AGATA.
Another technique uses the imaging capability of AGATA to deter-
mine the position resolution of a single AGATA detector [43] and
assesses a mean position resolution of 5 mm in an energy range from
300 keV to 1 MeV.
Figure 11: Simulated signals (black) compared to measured signals (red) of a 60 Co source for two events with a γ-ray energy of 1172 keV and 1332 keV. The induced charge of all seg- ments (A-F) and the core (CC). Distribution of hits in the detector (bottom) for different z slices.
A third approach uses the annihilation of the positron emitted by a
22 Na source to extract the position resolution [44]. As the two γ-
rays emitted by the annihilation process have opposite directions two
AGATA detectors at different positions were used to perform a source
measurement. The collected and analysed data was then compared
to Monte Carlo simulations and position resolution of 3.5 mm was
determined for an energy of 511 keV . The latest publication uses a
comparable method to the first one [14]. The experiment was one of
the first commissioning experiments performed at the AGATA setup
at LNL. The results show that the FWHM of the interaction position
resolution varies roughly linearly as a function of γ-ray energy. For
a γ-ray with 250 keV the position resolution is 8.5 mm going down
to 4 mm at 1.5 MeV. Above 1.5 MeV the value stays constant up to
4 MeV.
3. Spectroscopy of neutron rich Th and U nuclei after multi-nucleon reactions
During the AGATA campaign from February 2010 to December 2011 a variety of physics experiments were performed at the LNL (INFN Legnaro, Italy)[45]. A complete list of experiments can be found in the appendix, page 235. The experiment on spectroscopy of neutron rich actinides was performed and analysed as part of this thesis.
3.1. Introduction
The heavy nuclei beyond the last double magic nucleus 208 Pb in the actinide region from Radium to Nobelium show a variety of shapes in the ground state and at higher excitation energies. The experimental results from in-beam γ-ray spectroscopy on excited states are either obtained in the vicinity of the few isotopes suited as target material in this mass region or have been measured after fusion evaporation reactions. In both cases mainly neutron deficient actinide nuclei were investigated. Another more recent approach is based on multi-nucleon transfer reactions as a tool for spectroscopy of heavy nuclei. These experiments rely on the high resolving power of a powerful γ-ray de- tector array to separate the γ-rays from the multitude of reaction products [46].
Th216 Th217 Pa217
Th218 Pa218
218U Th219 Pa219
219U Th220 Pa220
220U Th221 Pa221 U221
Th222 Pa222 U222
Th223 Pa223 U223
Th224 Pa224 U224
Th225 Pa225 U225
Np225
Th226 Pa226 U226
Np226
Th227 Pa227 U227
Np227
Th228 Pa228 U228
Np228 Pu228
Th229 Pa229 U229
Np229 Pu229
Th230 Pa230 U230
Np230 Pu230
Th231 Pa231 U231
Np231 Pu231
Th232 Pa232 U232
Np232 Pu232
Th233 Pa233 U233
Np233 Pu233
Th234 Pa234 U234
Np234 Pu234
Th235 Pa235 U235
Np235 Pu235
Th236 Pa236 U236
Np236 Pu236
Th237 Pa237 U237
Np237 Pu237
Th238 Pa238 U238
Np238 Pu238
Pa239 U239
Np239 Pu239
Pa240 U240
Np240 Pu240
U241
Np241 Pu241
U242
Np242 Pu242
Np243 Pu243
Np244 Pu244 Pu245 Pu246 Pu247
Unknown β β- +
Alpha Stable EC 94
91 92
90 93 94
91 92
90
93