Pulse-Shape Analysis and Position Resolution in highly segmented HPGe Detectors
I n a u g u r a l - D i s s e r t a t i o n
zur
Erlangung des Doktorgrades
der Mathematisch-Naturwissenschaftlichen Fakultät der Universität zu Köln
vorgelegt von
Lars Lewandowski aus Langenfeld
Köln 2020
Berichterstatter: Prof. Dr. Peter Reiter
Prof. Dr. Jan Jolie
Tag der letzten mündlichen Prüfung: 13.05.2020
Abstract
The Advanced GAmma Tracking Array (AGATA) is a position sensitive γ -ray spectrometer, consisting of highly segmented High Purity Germanium (HPGe) detectors. It relies on the Gamma-Ray Tracking (GRT), which reconstructs the path of the individual γ rays through the array. The GRT enables the detection of γ rays with highest efficiency and provides γ -ray spectra with a Peak-to-Total ratio P / T which is comparable to Compton suppressed spectra. The tracking requires information on the deposited energies and interaction positions of the γ rays. The interaction positions are derived via Pulse-Shape Analysis (PSA).
The PSA utilizes the measured pre-amplified signals of the 36 segments and of the core electrode.
These signals are characteristic for each interaction position. The comparison of the measured pulse shapes with reference signals provides the interaction positions of the γ rays. The reference signals are simulated with the AGATA Detector Library (ADL) and the measured and simulated signals are compared with the AGATA adaptive grid search.
In this thesis the distributions of hits, which are obtained by employing ADL and the adaptive grid search, were investigated. An unexpected clustering of hits and a surplus of hits at certain single interaction positions, which can not be explained by statistical fluctuation, were observed. In the frame of this work quantities were introduced which describe the homogeneity of the hit distributions as well as the correlation of the number of hits of neighboring grid points. The obtained results confirm that the hit distributions are less homogeneous than expected and that the number of hits in neighboring grid points are correlated. These observations motivated an in-depth study of the PSA and its results.
The pulse shapes simulated with ADL were analyzed in detail and compared with the corresponding measured signals. Systematic deviations of measured and simulated signals were determined and possible solutions are discussed. In particular, the T 10 − 90 rise times of the pulse shapes and the evolution of the difference of measured and simulated signals during the process of charge collection were inspected.
The adaptive grid search determines the best fitting reference signal by minimizing a figure of merit.
The working principle of the adaptive grid search and its results were investigated in detail. The impact of employing different figures of merit on the PSA is discussed. Results regarding the position sensitivity, which were extracted from an inspection of the figure of merit landscape, are presented.
The strong position dependence of the pulse shapes affects the determination of the starting time T 0 , when using leading edge or Constant-Fraction Discriminator (CFD) algorithms. An energy and position independent T 0 -determination method is discussed and compared to the CFD timing.
In the second part of this thesis the β + decay of 22 Na was utilized to determine the PSA performance.
The emitted positron annihilates with an electron at the source position and the two created 511 keV γ rays were detected with the AGATA spectrometer. The agreement of the measured interaction positions with the expected 180 ◦ correlation was used to assess the PSA performance and to estimate the position resolution.
Parameters which are relevant for the shape of the reference signals or the working principle of the
grid-search algorithm were investigated and optimized in a systematic study. These parameters were
optimized by maximizing the agreement of the determined interaction positions of the 511 keV γ rays
with the expectation. In particular the distance of the lines, which connect the 511 keV coincidences,
to the source position was minimized.
The important input quantities for the pulse shapes are the transfer function of the preamplifiers, the
hole mobility and the electron mobility. The working principle of the grid search was improved by
determining the optimal distance metric and introducing weighting coefficients which increase the
contribution of the transient signals in the figure of merit calculation.
Zusammenfassung
Das Advanced GAmma Tracking Array (AGATA) ist ein ortsauflösendes Spektrometer für Gammaquan- ten, welches aus hochsegmentierten, hochreinen Germaniumdetektoren besteht. Es basiert auf dem Gamma-Ray-Tracking (GRT), welches den Pfad der einzelnen Gammaquanten durch das Array re- konstruiert. Das GRT ermöglicht die Detektion von Gammaquanten mit höchster Effizienz und bietet Gammaspektren mit einem Peak-to-Total-Verhältnis P / T, welches vergleichbar mit Compton unterdrückten Spektren ist. Das Tracking benötigt Informationen über die Wechselwirkungsorte der Gammaquanten und die Höhe der dort deponierten Energien. Die Wechselwirkungsorte werden mit Hilfe von Pulse-Shape-Analyse (PSA) bestimmt.
Die PSA verwendet die gemessenen Vorverstärker-Signale der 36 Segmente und der Core-Elektrode.
Diese Signale sind charakteristisch für jeden Wechselwirkungsort. Der Vergleich der gemessenen Impulsformen mit Referenzsignalen liefert die Wechselwirkungsorte der Gammaquanten. Die Refe- renzsignale werden mit der AGATA-Detector-Library simuliert und die gemessenen und simulierten Signale werden mit dem AGATA Adaptive-Grid-Search verglichen.
In dieser Dissertation wurden die Verteilungen der Wechselwirkungsorte, welche mit ADL und dem Adaptive-Grid-Search erzeugt wurden, untersucht. Eine nicht erwartete Anhäufung von Wechselwir- kungen und ein Überschuss an Treffern an bestimmten einzelnen Wechselwirkungsorten, welcher nicht durch statistische Fluktuation erklärt werden kann, wurden beobachtet. Im Rahmen dieser Arbeit wurden Größen eingeführt, welche sowohl die Homogenität der Verteilungen der Wechselwir- kungsorte als auch die Korrelation der Anzahl der Treffer von benachbarten Wechselwirkungsorten beschreiben. Die Ergebnisse bestätigen, dass die Verteilungen der Wechselwirkungsorte weniger homogen sind als erwartet und dass eine Korrelation zwischen der Anzahl der Wechselwirkungen von benachbarten Wechselwirkungsorten besteht. Diese Beobachtungen motivierten eine detaillierte Studie der PSA und ihrer Ergebnisse.
Die mit ADL simulierten Impulsformen wurden im Detail analysiert und mit den entsprechenden gemessenen Signalen verglichen. Systematische Abweichungen zwischen gemessenen und simulierten Signalen wurden bestimmt und mögliche Lösungen werden diskutiert. Insbesondere wurden die T 10 − 90 Anstiegszeiten der Impulsformen und die Evolution der Differenz zwischen gemessenen und simulierten Signalen während der Ladungssammlung untersucht.
Der Adaptive-Grid-Search bestimmt die beste Übereinstimmung zwischen Referenz- und Messsi- gnal, indem für jeden Wechselwirkungsort eine Gütezahl berechnet und diese dann minimiert wird.
Die Funktionsweise des Adaptive-Grid-Search und seine Ergebnisse wurden im Detail untersucht.
Die Auswirkung der Verwendung von verschiedenen Methoden zur Berechnung der Gütezahl wird diskutiert. Ergebnisse bezüglich der Ortssensitivität, welche anhand einer Untersuchung der Gü- tezahlen für verschiedene Wechselwirkungsorte bestimmt wurde, werden präsentiert. Die starke Ortsabhängikeit der Impulsformen beeinflusst die Bestimmung der Startzeit T 0 eines Signals, wenn Leading-Edge- oder Constant-Fraction-Discriminator-Algorithmen (CFD) verwendet werden. Ein energie- und positionsunabhängiges Verfahren zur T 0 -Bestimmung wird diskutiert und mit einem CFD-Timing verglichen.
Im zweiten Teil dieser Dissertation wurde der β + -Zerfall von 22 Na genutzt, um die Leistungsfähigkeit
der PSA zu bestimmen. Das emittierte Positron annihiliert mit einem Elektron nahe der Quellposition
und die erzeugten 511 keV Gammaquanten wurden mit dem AGATA Spektrometer detektiert. Die
Übereinstimmung der gemessenen Interaktionspunkte mit der erwarteten 180 ◦ -Korrelation wurde genutzt, um die Leistungsfähigkeit der PSA zu evaluieren und die Ortsauflösung zu bestimmen.
Parameter, welche relevant für die Form der Referenzsignale oder für die Funktionsweise des Adaptive- Grid-Search sind, wurden in einer systematischen Studie untersucht und optimiert. Diese Parameter wurden optimiert, indem die Übereinstimmung der Wechselwirkungsorte der 511 keV Gammaquanten mit der Erwartung maximiert wurde. Im Speziellen wurde der Abstand der Linien, welche die 511 keV Koinzidenzen verbinden, zur Quellposition minimiert.
Die wichtigen Größen, welche in die Impulsformen eingehen, sind die Transferfunktion der Vorverstär-
ker, die Löchermobilität und die Elektronenmobilität. Die Funktionsweise des Adaptive-Grid-Search
wurde verbessert, indem die optimale Abstandsmetrik bestimmt und Gewichtungskoeffizienten einge-
führt wurden, welche den Beitrag der transienten Signale in der Berechnung der Gütezahl erhöhen.
Contents
1 Introduction . . . . 7
1.1 Motivation . . . . 7
1.2 AGATA . . . . 8
2 Pulse-Shape Analysis . . . . 9
2.1 Working principle of the PSA . . . . 9
2.1.1 Reference data bases . . . . 9
2.1.1.1 The AGATA detector library . . . . 10
2.1.2 Search algorithms . . . . 14
2.1.2.1 The adaptive grid search . . . . 15
2.2 Data acquisition with AGATA . . . . 17
2.3 Results of the Pulse-Shape Analysis . . . . 18
2.3.1 Hit distributions . . . . 19
2.3.2 Position resolution . . . . 27
3 Comparison of Measured and Simulated Pulses . . . . 29
3.1 Super trace, residuals and figure of merit . . . . 29
3.2 Figure of merit landscape . . . . 31
3.3 Time dependent difference of measurement and simulation . . . . 37
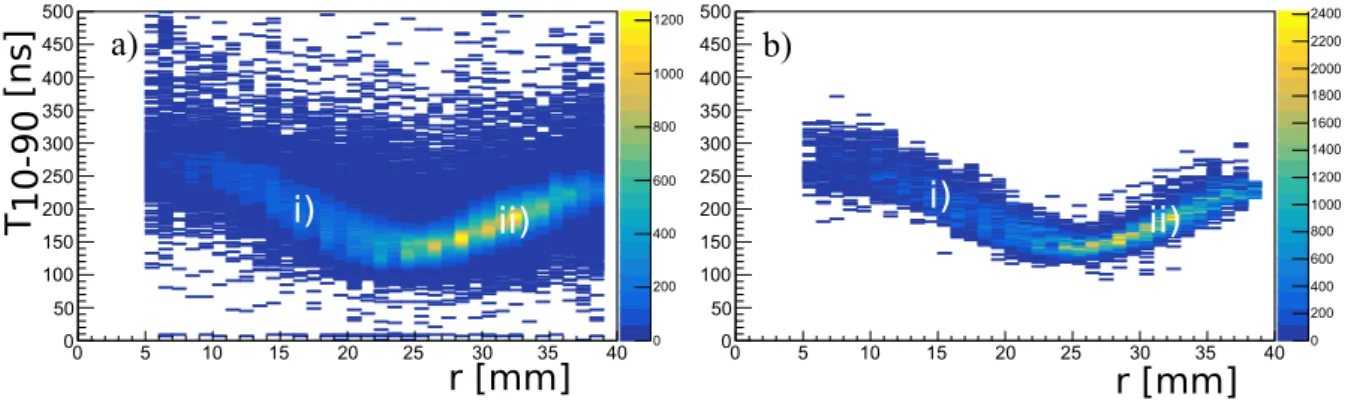
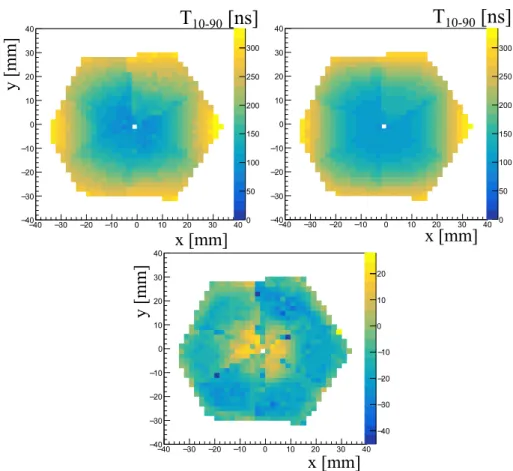
3.4 T 10−90 Rise times of measured and simulated pulses . . . . 43
3.5 T 0 Determination . . . . 48
4 Determination and Improvement of PSA performance . . . . 53
4.1 22 Na-coincidence method . . . . 53
4.1.1 Experimental setup . . . . 53
4.1.2 Reconstruction of coincident γ rays after e + / e − annihilation . . . . 56
4.1.3 Determination of the source position . . . . 60
4.1.4 Reconstruction of Compton scattered events . . . . 62
4.1.5 Estimation of position resolution . . . . 67
4.2 Estimation of PSA performance via comparison of determined and expected hit distributions . . . . 72
4.2.1 Correlation of neighboring grid points . . . . 72
4.2.2 Deviation from the expectation . . . . 74
4.2.3 High statistics grid points . . . . 76
4.3 Improvement of PSA performance employing a variation procedure . . . . 77
4.3.1 Weighting of transient signals . . . . 77
4.3.2 Distance metric . . . . 82
4.3.3 Weighting of individual segments based on the fluctuation of the baseline 87
4.3.4 Smearing of interaction positions . . . . 90
4.3.5 Transfer function . . . . 90
4.3.5.1 Transfer function with homogeneity criteria . . . . 93
4.3.6 Hole mobility . . . . 98
4.3.7 Electron mobility . . . 102
4.4 Comparison of results before and after optimization . . . 104
4.4.1 Comparison of 22 Na results . . . 104
4.4.2 Comparison of hit distributions . . . 108
4.4.3 Comparison of homogeneity criteria . . . 112
4.4.4 Summary of results before and after optimization . . . 113
5 Summary and Outlook . . . . 115
5.1 Summary . . . 115
5.2 Outlook . . . 119
5.2.1 Further developments and improvements with ADL . . . 120
5.2.1.1 Point-like charges . . . 120
5.2.1.2 Hole mobility . . . 121
5.2.1.3 Geometry of the crystals and dead layers . . . 121
5.2.2 Future developments of the search algorithm . . . 121
5.2.2.1 Improvements to the weighting of transient signals . . . 121
5.2.2.2 Two hits within a single segment . . . 123
5.2.2.3 New search algorithms . . . 124
5.2.3 New developments for position-sensitive HPGe-detectors . . . 125
Bibliography . . . . 125
Acknowledgments . . . . 143
Curriculum vitae . . . . 145
Erklärung zur Dissertation . . . . 146
1 Introduction
1.1 Motivation
Current nuclear physics research is concerned with understanding the structure and dynamics of nuclei. For this, the nuclear many-body system is investigated, especially the underlying fundamental forces, symmetries and effective interactions. For the understanding of these properties, the study of nuclei under extreme conditions is needed. These investigations concern nuclei far from stability, at highest spins and temperatures.
Currently, a new generation of radioactive ion beam (RIB) facilities is being build, which will provide a wide range of exotic nuclei. Among others, these are FAIR [ 1 ] , HIE-ISOLDE [ 2 ] , SPES [ 3 ] and SPIRAL2 [ 4 ] . The γ -ray spectroscopy of the produced exotic nuclei is key for understanding their underlying fundamental properties. The experimental conditions for γ -ray spectroscopy at these facilities are very challenging. The demands for a γ -ray spectrometer are highest efficiency, best peak-to-total ratio (P / T), high count-rate capabilities, a wide energy range and excellent energy resolution. Different detector systems excel at certain aspects of these specifications, e.g. NaI scintillators provide high efficiency but lack a good energy resolution. When combining the different experimental requirements High-Purity Germanium (HPGe) detectors emerge as the most promising solution.
In the past, the powerful and outstanding HPGe-detector arrays were GAMMASPHERE [ 5 ] and EUROBALL [ 6 ] , which are 4 π Compton-suppressed spectrometers. The usage of germanium causes a very good energy resolution, while the Compton suppression ensures a good P/T ratio. The 4π design leads to a decent overall efficiency, although the actual solid angle coverage is limited by the Compton-suppression detectors (BGO scintillators). The angular resolution, given by the size of the crystals, allows for a Doppler correction, limited by the detector opening angle. Since future experiments at the newly constructed facilities will typically provide nuclei with a high recoil velocity β , an excellent angular resolution is needed to overcome Doppler effects and to maintain the good energy resolution of the system.
The next step in the evolution of γ -ray spectrometers was the introduction of electronically segmented HPGe detectors, first MINIBALL [ 7 ] and EXOGAM [ 8 ] and then the current state-of-the-art 4 π tracking arrays GRETINA [ 9 ] and AGATA [ 10 ] . The electronic segmentation of HPGe detectors allows to determine the interaction position of γ rays by measuring the signals induced on the electrodes of the segments. This method, called Pulse-Shape Analysis (PSA), enables the Gamma-Ray Tracking (GRT) which reconstructs the path of a γ ray through the array.
The reconstruction is based on the determined interaction positions and the deposited energies. In
combination with the scattering angles calculated from the Compton-scattering formula the most
probable γ -ray path is assessed. The tracking also takes the energy dependent interaction cross sections and the penetration depth into account. This method allows to reject γ rays which did not deposit their full energy in the array, which would otherwise cause background in the γ-ray spectra.
In addition, γ rays which interact in different crystals of the array can be reconstructed, increasing the efficiency of the system ("add back"). The first interaction position of the γ ray is determined by the tracking, which enables a precise Doppler correction. The knowledge of the interaction positions also allows for a correction of neutron damage by calculating drift path and drift velocity of charge carriers for a given interaction position and estimating the loss due to trapping of charge carriers and thereby retaining the good energy resolution of the HPGe detector [ 11 ] . Neutron damage affects the measured pulse shapes, but simulations suggest that the impact on the position resolution is negligible [ 12 ] . This work is concerned with the position determination of γ -ray interactions with the γ -ray spectrometer AGATA, which will be introduced briefly in the next section.
1.2 AGATA
The Advanced GAmma Tracking Array (AGATA) is designed as 4 π γ -ray spectrometer. In its final configuration the array consists of 180 individual highly segmented HPGe detectors. Three different types of asymmetric, hexagonal crystals (A, B and C type) are mounted into triple cryostats [ 13 ] , forming nearly a full shell with an inner radius of 22.5 cm. The n-type HPGe crystals are encapsulated and the central electrode (core) extends from 13 mm to the back of the crystal. More details on the shape of the crystal and the tapering can be taken from Ref. [ 10 ] Fig. 4 and 5. Each crystal is 36 fold electrically segmented and the charges induced on the individual electrodes are pre-amplified and digitized with a 100 MHz sampling rate. More details on the data acquisition are given in section 2.2.
Simulations for the full 4 π array predict a photopeak efficiency of 43% and a P / T ratio of 59% for single 1 MeV interactions, as well as 28% photopeak efficiency and a 43% P / T ratio at a multiplicity of 30 [ 14 ] .
The measurement of the 37 preamplifier signals enables the determination of the individual interaction
positions of the γ ray. The working principle of the most commonly used PSA algorithms is discussed
in detail in section 2.1. Several tracking algorithms have been developed, the most commonly used
algorithms, the Orsay Forward Tracking (OFT) [15] and the Mars Gamma-Ray Tracking (MGT) [16],
are so called forward-tracking algorithms. Here, the individual interactions are grouped into clusters
by setting multiplicity dependent gates on the φ and θ angles (spherical coordinates). Within these
clusters different hypotheses regarding the number of γ rays and the interaction sequence are tested,
taking deposited energies, scattering angles and cross sections into account. For the testing and
validation of these hypotheses (synonymous to the rejection of some measured γ -ray interactions) an
optimum between achieved efficiency and desired P / T has to be found.
2 Pulse-Shape Analysis
2.1 Working principle of the PSA
The Pulse-Shape Analysis relies on the fact that the shape of the signals, which are induced on the segment and core electrodes, depends strongly on the interaction position of the γ ray. The measured signals therefore constitute a characteristic signature which can be used to determine the interaction position. For this, a link between measured pulse shapes and interaction position is needed. The most common approach is to simulate the electrical fields and the movement of the charges within the crystal. The obtained pulse shapes are stored in references bases. Within this section an overview of different reference bases and different search algorithms, which compare measured and simulated pulses, are presented. The ones used in this work (the AGATA Detector Library ADL [ 17 ] and the adaptive grid search [ 18 ] ) are introduced in more detail. Other approaches, e.g. creating references bases with scanning tables, are also discussed.
2.1.1 Reference data bases
For a precise reconstruction of the interaction position of a γ ray, the measured preamplifier signals have to be compared to reference signals, which are related to the position where charges are created by the γ-ray interaction. Several different approaches were made to create position dependent reference signals, for example characterizing the crystals via simulations with the Multi-Geometry Simulation (MGS) [ 19 ] code or with the Java AGATA Signal Simulation (JASS) [ 20 ] . There, the weighting potentials and the electrical field are obtained by solving the Poisson equation numerically.
Within the GRETINA collaboration the software packages "fieldgen" and "siggen" for the calculation of the fields and of the pulse shapes were developed [ 21 ] [ 22 ] . The general approach for all these simulations is similar. A detailed explanation of the simulations, based on the example of the AGATA Detector Library [ 17 ] is given in section 2.1.1.1.
Within the AGATA collaboration several scanning tables, which can provide measured signals with a
known interaction position, were constructed and are operating. Some of the scanning tables rely on
collimated γ -ray sources and the coincident detection of Compton scattered γ rays with an ancillary
detector to fix the interaction position [ 23 ] [ 24 ] . The precise knowledge of the interaction position
comes with the cost of very long measurement times. Therefore, a full characterization of a crystal
with these scanning tables is not realistically possible. The SAlamanca Lyso-based Scanning Array
(SALSA) is in developement and will provide information on the interaction position by using a source
which decays by β + emission and a position sensitive pixel detector [ 25 ] . Another approach is the so called Pulse Shape Comparison Scan (PSCS) [ 26 ] . When employing this technique, the crystal is scanned with simple collimated γ-ray sources from two perpendicular sides. The interaction position is then restricted to a single point by comparing the pulse shapes of two crossing collimated beams via χ 2 minimization. The advantage of this procedure is the strongly reduced measurement duration. In contrast to the scanning methods, which are based on collimated sources and the coincident detection of 90 ◦ Compton scattered γ rays, a full characterization of single crystals is feasible.
An additional approach, complementing the simulation and measurement of the pulse shapes, is the so called in-situ method [ 27 ] . This method is based on determining estimators for the coordinates (for example for the depth z of the interaction) using simple properties of the pulse shapes (for example the amplitude of the signals in the neighboring segments). These estimators are combined with the expected distribution of interactions from a source measurement, obtained from simulations. In this way a relationship between estimator and most likely coordinate is available. The relationship is used to assign interaction positions to measured pulse shapes. The pulse shapes for a given interaction position are averaged, resulting in a set of reference signals to be used for PSA. The advantage of this technique is the full characterization of all crystals mounted in the frame via a single source measurement. The obtained pulse shapes combine all relevant individual properties of the crystal and the electronics, like the transfer function, impurity concentration and so on. The drawback of this technique is that it has (apart from the simulated hit distribution) no physics input, it is a purely mathematical approach. Certain characteristics of the obtained pulse shapes cannot be traced back to individual physical properties of the crystal or the electronics. In addition, the obtained pulse shapes may have contributions from multiple interactions per segment, as these cannot be resolved by the simple estimators [28].
Since the scanning of all crystals is impracticable and the in-situ bases have not proven to be superior [ 28 ] , simulated reference bases are up to now the solution of choice. Within the AGATA collaboration the AGATA Detector Library is the most commonly used one and will be introduced in the next section.
2.1.1.1 The AGATA detector library
Within this work the AGATA Data Library was employed. It is described in detail in reference [17].
The basic concepts and the inputs of the simulation will be treated here, as some of these aspects will be investigated later in this thesis. Limitations and applied approximations will also be discussed in this section.
The procedure to obtain simulated pulse shapes, which are suited to be compared to measured traces (pulse shapes), can be divided in the following steps (which are subsequently treated in detail):
1. Calculation of the electrical field by solving the Poisson equation 2. Calculation of the charge-carrier trajectories
3. Calculation of the weighting potentials
4. Calculation of the induced charges on each electrode caused by the charge carriers in the crystal
−40 −30 −20 −10 0 10 20 30 40 40
− 30
− 20
− 10
− 0 10 20 30 40
0 5 10 15 20 25 30
y [mm]
x [mm]
a)
−040 −30 −20 −10 0 10 20 30 40 10
20 30 40 50 60 70 80 90
0 5 10 15 20 25
x [mm]
z [mm]
b)
Figure 1: The segmentation simulated with ADL of crystal A001 is shown for a) a fixed z of 40 mm to 42 mm and b) a fixed y of -2 mm to 0 mm. The color code represents the respective segment id (1-36, not all segments visible). Especially in the xz depiction the bending of the segments at small radii becomes apparent. This is caused by the position of the central contact which ends at z ≈ 13 mm. At the back of the crystal the approximation of a true coaxial detector is applicable.
5. Convolution of the obtained pulses with an electronic response function 1.) The electrical field E is obtained by solving the Poisson equation:
∆φ = − ρ
ε (2.1)
With ρ being the charge density originating from the space charges, which come from the impurities in the high-purity germanium (HPGe). The density of impurities is in the order of 10 cm
103. The equation is solved with the boundary condition that the difference of the potential at the inner electrode (core) and the segment electrode corresponds to the applied high voltage V .
The actual impurity distribution in the detection material is not known, only two values for the front- and for the backside of the crystal are provided by the manufacturer. The impurity profile in the crystal is modeled by a linear gradient between the front and back of the crystal, assuming a radial independence of the profile. Results of capacitance-voltage measurements indicate that these assumptions are valid [ 29 ] [ 30 ] . The form of the electrical field lines also determine the hit segment for a given interaction position. The shape of the segments is illustrated in Fig. 1. Note that all distributions referring to single crystals are plotted in the coordinate system of the individual crystal.
Here the origin is centered at the front of the crystal and the z coordinate is in parallel to the central contact, see Fig. 2.
2.) The charge carriers move along the electrical field lines. The full time dependent trajectory ~ r ( t ) is
crucial for the shape of the pulses. For this, the drift velocity v D , which depends on the charge-carrier
mobility and the electrical field strength, is needed. The mobility depends on the charge carrier type
(electrons or holes), direction of the drift, temperature and impurity concentration of the crystal. The
x y z
r
Figure 2: A sketch of an AGATA crystal is shown. The electronic segmentation divides the crystal in 36 segments, consisting of 6 rings and 6 slices. The segments are labeled by the corresponding slice A-F and by the ring number 1-6. The coordinate system of the crystal is chosen such that the origin is centered at the front of the crystal (ring 1). The z axis is in parallel to the core. The y axis goes along the segmentation border of slices B and C and slices E and F. Cylindrical coordinates in terms of r, φ and z are useful to describe the (approximate) cylindrical symmetry of the crystal. Depiction of the crystal adapted from [10].
mobility of holes and electrons is not isotropic due to the non-negligible electrical field of the lattice.
The drift velocity in the 〈 1 0 0 〉 direction is up to 30% faster than in the 〈 1 1 1 〉 direction. The models for the drift velocity and the mobility are discussed and investigated in more detail in section 4.3.6 and 4.3.7. For the simulations a constant temperature and a constant mobility in all parts of the crystal is assumed.
3.) The weighting potentials ϕ i contain the information on the charge Q i which is induced on the electrode i by a charge q which is located at a position ~ r. The induced charge is given by:
Q i (~ r) = qϕ i (~ r) (2.2)
The weighting potentials are obtained under application of the Shockley-Ramo theorem [ 31 ] by solving the Poisson equation in the absence of any charge (i.e. ρ = 0) and by setting the considered electrode to 1 V, while all other electrodes are grounded. The equation is solved with the boundary condition ϕ i (S j ) = δ i, j which ensures that a charge q located at the surface S j of electrode j will either induce the full charge Q i = q if i = j or Q i = 0 if i 6= j. An example for the weighting potential of the core and of a segment are given in Fig. 3.
For simplification purposes it is assumed that a single point-like charge is created for both electrons
and holes when a γ ray interacts in the germanium. This is a valid approximation for low-energy
interactions of a few hundred keV, which are the most likely ones to occur. For example a photo or
0 50 100 150 Y
0 25 50 75 100 125 150
X
50 100 150
Y 0
25 50 75 100 125 150
X
0 .0 0 .2 0 .4 0 .6 0 .8 1 .0
0 50 100 150
Y 0
25 50 75 100 125 150
X
0.0 0.2 0.4 0.6 0.8
core 1.0 segment
x [mm]
y [mm]
x [mm] 0
Figure 3: The ADL weighting potential for the core (left) and for segment A3 of an A-type crystal is shown at a detector depth z of 23.5 mm. For a given trajectory the charge induced on the respective electrode is given by the weighting potential. Both the charge of the electrons and of the holes contribute to the induced charge Q i , but with their respective opposite signs.
Compton electron with an energy of 100 keV has a range of 44 µ m [ 32 ] . A 1 MeV electron has a range of 1.2 mm, which is not insignificant, but still smaller than the expected achievable position resolution. Single 1 MeV interactions are rather unlikely due to the relative larger cross section for Compton scattering compared to a photo effect. In addition, for high energy γ rays forward scattering is more probable, leading to typical energy depositions of a few hundred keV. The diffusion of the charge cloud during the movement to the electrodes is neglected.
4.) The combination of the weighting potentials ϕ i and the time dependent trajectories of the charges
~ r (t) (using the electrical field E and the drift velocity v D ) enables the calculation of the induced charges Q i (t) on all electrodes i via eq. 2.2 and therefore the calculation of the complete time dependent pulse shapes.
5.) In order to compare the calculated pulses to the measured signals, the influence of the acquisition electronics has to be taken into account. Here, two aspects have to be accounted for: the measured signals are shaped by the preamplifiers. Therefore, the simulated signals have to be convoluted with the transfer function of the preamplifiers. The transfer function is measured by injecting a fast rectangular pulser signal into the preamplifier. Due to the high number of channels, the direct measurement of the transfer function of all channels is not feasible. Instead, the transfer function is described by an exponential decrease, with a time constant τ as parameter. The transfer function and the impact of different τ values on the results of the PSA was investigated within this work, more details are presented in section 4.3.5.
The second aspect is the crosstalk of segments and core. This is caused by the fact that - in contrast
to the assumptions of the Shockley-Ramo theorem - the electrodes are not grounded. The electrodes
are connected to preamplifiers. An adjustment of the Ramo theorem is given in [ 33 ] . The capacitive
coupling of segments and core causes a reduction of the measured energy in segment i if segment j is hit, depending on the energy of the interaction. This proportional crosstalk is well understood and described by a linear electronic model in refs. [34] and [35]. Additionally, in segments adjacent to the hit segment a crosstalk is observed, which is proportional to the derivative of the signal of the hit segment. It is therefore important for the PSA as the so called "derivative crosstalk" appears during the charge collection and has to be distinguished from the transient signals, which contain the information on the interaction position. A model was developed to correct for the derivative crosstalk based on the measured proportional crosstalk [ 36 ] [ 37 ] . Also a method was invented to distinguish derivative crosstalk and transient signals for measurements with a collimated source (see Ref. [ 38 ] section 2.3.2).
After including the complete electronic response, the simulated signals can be compared to the measurement to extract the interaction positions. The final results depend on the algorithm which is used for this comparison. An overview of different search algorithms and a discussion of their respective advantages and limitations is given in the next section. The adaptive grid search, which is used by the AGATA collaboration and which was also employed in this work, is introduced in more detail.
2.1.2 Search algorithms
PSA algorithms have to fulfill two main requirements: 1.) A position resolution within the specifica- tions of ∼ 5 mm Full Width at Half Maximum FWHM. 2.) A fast computing time (less than 1 ms for one event on a single CPU). Due to the high counting rate, the algorithm has to process events in a very efficient way while remaining stable and robust. The computing time of the algorithm becomes especially important in the case of multiple interactions in different segments of the detector and / or multiple interactions within a segment. For multiple interactions the number of degrees of freedom grows exponentially.
The position resolution is commonly specified as FWHM of a Gaussian distribution, assuming an identical resolution in each direction x , y, z. In fact, most PSA algorithms tend to allocate hits in a non-Gaussian distribution around the physical interaction [ 39 ] [ 20 ] . In reality the distributions have left and right tails, distorting the relation between standard deviation and FWHM. Other quantities to describe the position resolution, such as the median of the distribution, have been suggested [40].
This should be taken into account when comparing different quantities for the position resolution, e.g. the standard deviation σ and the FWHM, since the relation FWHM ≈ 2.35 σ applies only for Gaussian distributions.
To achieve the needed position resolution, a precise T 0 determination is needed (around ∆T 0 < 10 ns).
Therefore, T 0 is typically included in most search algorithms by introducing a variable time shift, which is determined along with the interaction position. Especially for low-energy interactions the small signal-to-noise ratio makes a precise T 0 determination very challenging.
PSA algorithms can be divided into two groups. The first group compares the measured signals with a
set of reference signals, while the second group extracts the interaction position from properties of the
pulse shape. An example for the latter one is a simple approach, which was developed and applied for MINIBALL, where the amplitude of the transient signals of neighboring segments is considered [ 41 ] . More elaborate approaches, like the in-situ method discussed in section 2.1.1, extract the interaction positions using estimators which are calculated from the pulse shape. The achieved position resolution was below the methods using reference signals [ 28 ] .
The most commonly used algorithms compare the measured signals with a previously calculated set of reference signals. For the determination of interaction positions in the γ -ray spectrometer GRETINA, which has very similar properties as AGATA, a signal decomposition is used on an irregular grid. Here the density of grid points depends on the relative change of the reference signals. The density is especially large at positions in the detector where the sensitivity is highest (see reference [ 42 ] on the sensitivity of different interaction positions). This leads to a high density of grid points for example at segment boundaries. Measured and simulated signals are first compared on a coarse grid, then on a fine grid. The GRETINA signal decomposition also looks for multiple interactions in single segments (see reference [ 43 ] ).
Another approach is the so called Fully-Informed Particle-Swarm (FIPS) algorithm [ 40 ] . Here, the comparison of measurement and simulation is not performed on a fixed grid. Instead, the search is divided in different iterations. At each iteration certain hypotheses regarding the final result (i.e. interaction positions, but also number of interactions per segment, energy ratio between those interactions) are tested. Each hypothesis corresponds to the position of the respective member of the
"swarm". At the next iteration step the new hypotheses to be tested are derived from the previous iteration by considering the agreement of the different hypotheses with the measurement. In this way a fast convergence of the algorithm is ensured, which allows to test for more "complex" results, especially multiple interactions per segment.
2.1.2.1 The adaptive grid search
Within the AGATA collaboration the adaptive grid search is used for the comparison of the ADL reference signals and the measurement. The comparison is done by minimizing the following figure of merit:
Figure of Merit = X
i
X
t
j| A i,s ( t j ) − A i,m ( t j )| p (2.3) Here A i,s (t j ) and A i,m (t j ) are simulated s and measured m pulse heights of segment i at time index t j . For the calculation the first 40 samples after the determined T 0 are considered. This corresponds to 400 ns, which is long enough to ensure that the charge collection is completed.
This search is done on an "adaptive" grid which means that first an interaction position is determined on a coarse grid of 6 mm and then on a fine grid of 2 mm around the determined interaction position.
This is necessary to reduce the number of operations which have to be computed. Depending on segment size a segment typically has around 10 3 grid points using the fine grid.
A precise alignment of simulation and measurement is crucial for achieving a good position resolution.
For the T 0 determination the strong dependence of the pulse shapes on the interaction position
has to be taken into account. Therefore, a T 0 determination via leading edge or via a (digital) Constant-Fraction Discriminator CFD is not sufficient. For a position independent timing the following characteristics of core and segment signals is exploited: The sum of all segment signals and of the core signal is in good approximation a linear pulse with a constant slope. This linear pulse is fitted with a first order polynomial to determine the starting time of the pulse. The differences of T 0 determined via CFD and this method is investigated in more detail in section 3.5.
In addition to the initial T 0 determination, the starting time is also included as a variable in the grid search. This is done by first determining an interaction position with the initial T 0 and then shifting the measured signals by a fixed time t s with respect to the found best fitting simulated signals. The time shift t s is chosen such that the agreement of measurement and simulation is maximized, by minimizing this adjusted figure of merit:
FOM T
0
= X
i 25
X
t
j= 0
| A i,s ( t j ) − A i,m (t j + t s )| 2 (2.4)
In contrast to the figure of merit in eq. 2.3 only the first 25 samples are used and the exponent is set to two (while p ≈ 0.3 in eq. 2.3). With the such determined time shift the grid search is performed again, leading to (possibly) different interaction positions. This procedure is repeated until the algorithms converges or a maximum number of iterations is reached (typically four due to time constraints).
If multiple interactions occur in different segments of the detector it is a priori not clear, which part of the measured pulse shapes is caused by each individual interaction, because transient signals from one interaction can overlap with transient signals or the net charge signal from another interaction. It is not trivial to disentangle the individual contributions to the final measured signals. To reduce the needed computing time the following simplifying approach is used: The interaction position of the interaction with the highest energy deposition is determined by treating it as a single interaction. The signals from the other hit segments are excluded from the figure of merit calculation. The obtained best fitting simulation for this single interaction is then subtracted from the initially measured signals.
The procedure is repeated with the 2nd highest energy deposition and so on. This approach simplifies the handling of multiple interactions drastically, although a systematic error is introduced which especially takes effect in the case of directly or diagonally neighboring hit segments.
It should be noted that, depending on the number of possible solutions, the problem of assigning an
interaction position is mathematically underdetermined. This means that the parameter space is very
large compared to the available information: A segment has about 1k grid points on a 2 mm grid, the
number of possible combinations of interaction positions for two hits in one segment therefore is in
the order of 10 6 , not taking the unknown ratio of energies into account. The variable T 0 (typically ± 5
ticks of 10 ns length) and multiple interactions in different segments increase the number of possible
solutions even more. On the other hand there are only 6 · 40 = 240 non-trivial numbers, coming from
the measured 40 samples (corresponding to 400 ns) of the hit segment, the core and the nearest
neighbors. The number of measured samples with usable information is even smaller: Depending on
interaction position the charge collection is finished within 150-350 ns and for interactions in the
front or back segments the transient signals of only three neighbors can be utilized.
Furthermore it was shown that, at sufficient high sampling rates, the PSA performance does not depend significantly on the rate of digitization. A down-sampling of 100 MHz to 50 MHz did not change the position resolution noticeably [ 44 ] . This means that the effective number of samples for fitting is even smaller.
Therefore it is necessary to reduce the complexity of the search algorithm by decreasing the number of possible solutions. One step in reducing the complexity of the problem is the already mentioned simplifications in the treatment of multiple interactions in different segments of a detector. A further simplification is achieved by assuming only single interactions within a segment. This assumption introduces a systematic error into the final PSA results. Two interactions inside a single segment are expected to be allocated as single interaction in between the two interactions. Therefore, an accumulation of hits in the center of the segment is qualitatively expected. Other algorithms, like the GRETINA signal decomposition and the "swarm search" do not use the assumptiom of single interactions within a segment, but have to cope with the large number of possible solutions. In the GRETINA signal decomposition so-called "penalty factors" had to be introduced which allow two-hit solutions only if a certain improvement in the figure of merit is achieved. Algorithms including multiple interactions per segment still have to proof their superiority compared with the adaptive grid search. Nevertheless, the assumption of single interactions per segment has to be kept in mind and future versions of the grid search should address this problem.
2.2 Data acquisition with AGATA
The process of data taking, starting from a certain number of interactions in one or more crystals and ending up with tracked γ rays including their respective energies and interaction positions, is best described via a flowchart, which is depicted in Fig. 4.
The measured signals are amplified by charge sensitive preamplifiers [ 45 ] [ 46 ] and sent to the front-
end electronics where they are digitized at a rate of 100 MHz using 14 bit ADCs (analog-to-digital
converter). A global clock running at 100 MHz generates a time stamp and distributes it to all
digitizer modules. The pre-processing electronics identify which segments comprise an interaction
and determine the deposited energies using a moving-window-deconvolution (MWD) algorithm
[ 47 ] [ 48 ] . For more details on the electronics, see reference [ 10 ] . The data from the core and from
the hit segments are send to the "PSA farm", which consists of high-performance computers, where
the interaction positions are determined. Optionally the traces are stored for later use. The events
from individual detectors are connected via their time stamps in the event building using a ± 2.5 µ s
(variable) time window. The linked events, consisting of interactions in the complete array, are then
tracked and the information is stored in a ROOT tree for further analysis.
Digitizer GTS
Preampliers 36 segment + 1 core signal
core triggering (validation)
Digitizer Digitizer Preampliers Preampliers
...
...
...
Traces, energies, time stamp Global
clock
Ancillary detectors
Storage
PSA farm
Traces, energies, time stamp
PSA farm
Traces, energies, time stamp
PSA farm
Event building energies, interaction
positions, time stamp, T
0Tracking Event merging
Storage and data analysis
First interaction positions, gamma-ray energies, T
0Figure 4: Flow chart of the AGATA data acquisition. The pre-amplified segment and core signals are digitized. The digitizer modules trigger on the core signal and determine the segment and core energies. The event is marked with a time stamp, which is distributed by a global clock. The digitizers also communicate with the Global-Triggering System (GTS), which can trigger the data taking of ancillary detectors. The trace data is send to the PSA farm, where interaction positions and a more accurate T 0 are determined. Using the assigned time stamps, events including multiple crystals are built. The energies and positions of simultaneous interactions are used to track the γ rays. If ancillary detectors are present, their data is merged with the information of the tracked γ rays.
2.3 Results of the Pulse-Shape Analysis
The results of the PSA can be studied in several ways. The most obvious and most qualitative way
is the inspection of the distribution of determined interaction positions. For simple geometries -
e.g. when γ rays are emitted from the center of the sphere which is formed by the AGATA crystals
z
D A
D A '
Figure 5: A schematic drawing of an AGATA crystal is shown. The section of the black circle marks the points which have the same distance to the source, which is placed at the center of AGATA. In good approximation grid points with a constant detector depth z have the same distance to the source (red marked area). The distances D A and D A 0 - which are relevant for absorption - are also equal in good approximation for γ rays emitted from the source.
Therefore, within statistical fluctuations the same number of hits is expected for grid points with identical detector depth z.
- the expected distribution of hits is known. Disagreement of the found hit distributions with the expectation indicates a deviation of the physical interaction positions and the interaction positions found by the PSA. A more quantitative value is the achieved position resolution, which is not easy to extract. Finally, the results of the tracking depend on the PSA results. The quality of the Doppler correction, the tracking efficiency and the peak-to-total ratio give insight to the achieved performance.
The results obtained with AGATA using ADL and the adaptive grid search will be discussed in the next sections.
2.3.1 Hit distributions
A source measurement was performed with AGATA at the Grand Accélérateur National d’Ions Lourds (GANIL) employing 29 AGATA crystals, set up in nine triple cluster and one double cluster detectors.
A 60 Co source was placed in the center of the sphere formed by the AGATA crystals, such that the distance of the source to each crystal is equal and every crystal is facing directly towards the source.
In this way the expected number of hits for a given detector depth z is approximately the same, which is illustrated and explained in Fig. 5. In this section the interaction positions obtained with ADL and the adaptive grid search are presented.
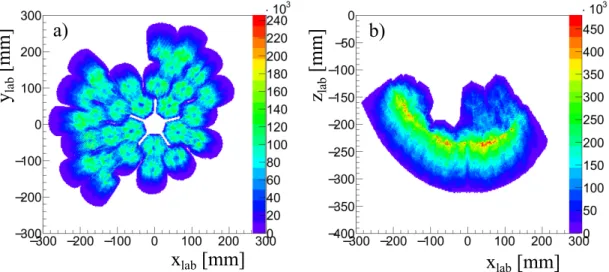
Hit distributions of the complete array (lab system) are shown in Fig. 6. Distributions for single
crystals (crystal coordinate system, see Fig. 2), gated on different detector depths z, are shown for
y lab [mm]
x lab [mm]
x lab [mm]
z lab [mm]
a) b)
Figure 6: The a) front view (projection on (x lab , y lab ) plane) and b) bottom view (projection on ( x lab , z lab ) plane) of the determined interaction positions is shown (no gates). The lab coordinate system is chosen such that the origin is in the center of the sphere formed by the AGATA crystals.
−40 −30 −20 −10 0 10 20 30 40
−40
−30
−20
−10 0 10 20 30 40
0 5000 10000 15000 20000 25000
−40 −30 −20 −10 0 10 20 30 40
−40
−30
−20
−10 0 10 20 30 40
0 2000 4000 6000 8000 10000 12000 14000 16000
x [mm]
x [mm]
y [mm]
a) b)
Figure 7: The distribution of hits of the 60 Co-source measurement for crystal A001 is shown for a) z = 2 − 4 mm and b) z = 14 − 16 mm. No further gates were set. A strong accumulation at the edge of the detector is observed. Certain grid points (red color) have up to ten times more statistics than comparable grid points in the center of the segment (see Fig. 1 a) for the segmentation of the crystal), which cannot be caused by statistical fluctuation. The distribution in a) has less hits in the segment centers and more at segment borders, while figure b) shows an accumulation of hits for intermediate radii. Note that there is a segment border in b) at a radius of r ≈ 20 mm (see also Fig. 1 b) for details).
the front part of a crystal in Fig. 7 and for the back part in Fig. 8. A strong discrepancy between the
expected homogeneous distribution with statistical fluctuation and the obtained hit distributions is
observed.
40
− −30 −20 −10 0 10 20 30 40
−40 30
−
−20 10
− 0 10 20 30 40
0 500 1000 1500 2000 2500 3000 3500
40
− −30 −20 −10 0 10 20 30 40 40
− 30
−
−20 10
− 0 10 20 30 40
0 2000 4000 6000 8000 10000 12000 14000 16000 18000 20000
x [mm]
x [mm]
y [mm]
a) b)
Figure 8: The distribution of hits for crystal A001 is shown for a) z = 46 − 48 mm and b) z = 86 − 88 mm. The distribution in a) corresponds to a part in the crystal, which can approximated by a cylindrical geometry. Even with the less complex electrical field a surplus of hits in single grid points at the edge of the detector is observed. In contrast to Fig. 7 a) an accumulation of hits in the segment centers is seen. The plot in b) corresponds to the second last plane of grid points, at the very back of the crystal. The number of hits at the edge of the detector is strongly reduced, but several aggregations in the segment centers are observed.
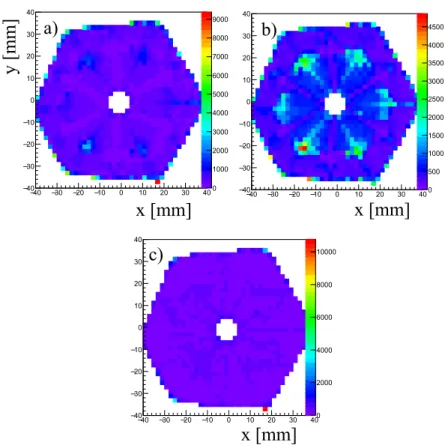
The 2D histogram from Fig. 8 a) is plotted with additional gates on energy and multiplicity in Fig. 9:
In picture a), where a gate on one hit segment in the crystal was set, an accumulation of hits in the lower right corner is observed. In relation to the number of hits in the complete histogram more hits are found in this lower right corner, compared to the histogram without gates in Fig. 8 a). The gates on energy depositions above 400 keV in b) and below 100 keV in c) reveal the strong energy dependence of the PSA performance. In b) still a clustering of hits in the segment centers is observed.
However, only a small surplus of hits is seen in the lower right corner. The opposite is the case for low energy interactions in c).
The deviation of the obtained distributions from a flat distribution with statistical fluctuations becomes especially apparent when transforming the found hit distribution into a surface plot, which is shown in Fig. 10.
An overview of slices with identical z for all crystals reveals a very similar behavior, especially for
identical crystal types A, B and C, see Fig. 11 and 12. The observed distribution of hits and the
deviation from the expectation are generally very similar for all crystals. Most of the plots shown in
this section depict crystal A001 for the easier comparison with the segmentation shown in Fig. 1.
40
− −30 −20 −10 0 10 20 30 40 40
− 30
− 20
− 10
− 0 10 20 30 40
0 1000 2000 3000 4000 5000 6000 7000 8000 9000
40
− −30 −20 −10 0 10 20 30 40
−40 30
−
−20 10
− 0 10 20 30 40
0 500 1000 1500 2000 2500 3000 3500 4000 4500
40
− −30 −20 −10 0 10 20 30 40
−40 30
− 20
−
−10 0 10 20 30 40
0 2000 4000 6000 8000 10000
x [mm]
y [mm]
x [mm]
x [mm]
a) b)
c)
Figure 9: The distribution of hits for crystal A001 is shown for z = 46 − 48 mm (corresponding to picture a) in Fig. 8). It is plotted with an additional gate on either a) exactly one triggered segment, b) E γ > 400 keV and c) E γ < 100 keV. The original plot consists of 1.87 · 10 6 individual interactions, the gated spectra comprise of a) 28.7% b) 36.4 % and c) 15.2% of the statistics. For more details see text.
−40 −30 −20 −10 0 10 20 30 40
−40
−30
−20
−10 10 0 30 20 400 2000 4000 6000 8000 10000 12000 14000 16000
x [mm]
y [mm]
Figure 10: A surface plot of crystal A001 at z = 26 − 28 mm is shown (no additional gates). The
height corresponds to the number of hits per grid point. The different heights of single
peaks and the rest of the surface illustrates the large deviation of the number of hits
allocated to the individual interaction positions, which differ by up to a factor of 10. The
average number of counts per grid point is 2350 and the standard deviation is 1545
counts.
40
− −30 −20 −10 0 10 20 30 40 40
− 30
− 20
− 10
− 0 10 20 30 40
0 2000 4000 6000 8000 10000
40
− −30 −20 −10 0 10 20 30 40 40
− 30
− 20
− 10
− 0 10 20 30 40
0 2000 4000 6000 8000 10000 12000 14000 16000
40
− −30 −20 −10 0 10 20 30 40 40
− 30
− 20
− 10
− 0 10 20 30 40
0 1000 2000 3000 4000 5000 6000 7000 8000
40
− −30 −20 −10 0 10 20 30 40 40
− 30
− 20
− 10
− 0 10 20 30 40
0 1000 2000 3000 4000 5000 6000 7000 8000 9000
40
− −30 −20 −10 0 10 20 30 40 40
− 30
− 20
− 10
− 0 10 20 30 40
0 2000 4000 6000 8000 10000
40
− −30 −20 −10 0 10 20 30 40 40
− 30
− 20
− 10
− 0 10 20 30 40
0 10000 20000 30000 40000 50000 60000
−40 −30 −20 −10 0 10 20 30 40 40
− 30
−
−20 10
− 0 10 20 30 40
0 2000 4000 6000 8000 10000
−40 −30 −20 −10 0 10 20 30 40 40
− 30
−
−20 10
− 0 10 20 30 40
0 2000 4000 6000 8000 10000 12000
−40 −30 −20 −10 0 10 20 30 40 40
− 30
−
−20 10
− 0 10 20 30 40
0 2000 4000 6000 8000 10000
40
− −30 −20 −10 0 10 20 30 40 40
− 30
− 20
− 10
− 0 10 20 30 40
0 2000 4000 6000 8000 10000
40
− −30 −20 −10 0 10 20 30 40 40
− 30
− 20
− 10
− 0 10 20 30 40
0 2000 4000 6000 8000 10000 12000 14000 16000 18000 20000 22000
40
− −30 −20 −10 0 10 20 30 40 40
− 30
− 20
− 10
− 0 10 20 30 40
0 1000 2000 3000 4000 5000 6000 7000 8000
40
− −30 −20 −10 0 10 20 30 40 40
− 30
− 20
− 10
− 0 10 20 30 40
0 1000 2000 3000 4000 5000 6000 7000 8000 9000
40
− −30 −20 −10 0 10 20 30 40 40
− 30
− 20
− 10
− 0 10 20 30 40
0 1000 2000 3000 4000 5000 6000 7000 8000 9000
40
− −30 −20 −10 0 10 20 30 40 40
− 30
− 20
− 10
− 0 10 20 30 40
0 1000 2000 3000 4000 5000 6000 7000 8000 9000