Systematic search for VHE gamma-ray emission from X-ray bright high-frequency BL Lac objects
J. Albert a , E. Aliu b , H. Anderhub c , P. Antoranz d , C. Baixeras e , J. A. Barrio d , H. Bartko f , D. Bastieri g , J. K. Becker h , W. Bednarek i , K. Berger a , C. Bigongiari g , A. Biland c , R. K. Bock f,g , P. Bordas j , V. Bosch-Ramon j , T. Bretz a , I. Britvitch c , M. Camara d ,
E. Carmona f , A. Chilingarian k , J. A. Coarasa f , S. Commichau c , J. L. Contreras d , J. Cortina b , M.T. Costado m,v , V. Curtef h , V. Danielyan k , F. Dazzi g , A. De Angelis n ,
C. Delgado m , R. de los Reyes d , B. De Lotto n , D. Dorner a , M. Doro g , M. Errando b , M. Fagiolini o , D. Ferenc p , E. Fern´ andez b , R. Firpo b , M. V. Fonseca d , L. Font e , M. Fuchs f ,
N. Galante f , R.J. Garc´ıa-L´ opez m,v , M. Garczarczyk f , M. Gaug m , M. Giller i , F. Goebel f , D. Hakobyan k , M. Hayashida f , T. Hengstebeck q , A. Herrero m,v , D. H¨ ohne a , J. Hose f ,
S. Huber a , C. C. Hsu f , P. Jacon i , T. Jogler f , R. Kosyra f , D. Kranich c , R. Kritzer a , A. Laille p , E. Lindfors l , S. Lombardi g , F. Longo n , M. L´ opez d , E. Lorenz c,f , P. Majumdar f ,
G. Maneva r , K. Mannheim a , M. Mariotti g , M. Mart´ınez b , D. Mazin b , C. Merck f , M. Meucci o , M. Meyer a, ∗ , J. M. Miranda d , R. Mirzoyan f , S. Mizobuchi f , A. Moralejo b ,
D. Nieto d , K. Nilsson l , J. Ninkovic f , E. O˜ na-Wilhelmi b , N. Otte f,q , I. Oya d , M. Panniello m,x , R. Paoletti o , J. M. Paredes j , M. Pasanen l , D. Pascoli g , F. Pauss c ,
R. Pegna o , M. Persic n,s , L. Peruzzo g , A. Piccioli o , E. Prandini g , N. Puchades b , A. Raymers k , W. Rhode h , M. Rib´ o j , J. Rico b , M. Rissi c , A. Robert e , S. R¨ ugamer a , A. Saggion g , T. Y. Saito f , A. S´ anchez e , P. Sartori g , V. Scalzotto g , V. Scapin n , R. Schmitt a ,
T. Schweizer f , M. Shayduk q,f , K. Shinozaki f , S. N. Shore t , N. Sidro b , A. Sillanp¨ a¨ a l , D. Sobczynska i , F. Spanier a , A. Stamerra o , L. S. Stark c , L. Takalo l , P. Temnikov r ,
D. Tescaro b , M. Teshima f , D. F. Torres u , N. Turini o , H. Vankov r , A. Venturini g , V. Vitale n , R. M. Wagner f , T. Wibig i , W. Wittek f , F. Zandanel g , R. Zanin b , J. Zapatero e
Received date / Accepted date
ABSTRACT
All but three (M87, BL Lac and 3C 279) extragalactic sources detected so far at very high energy (VHE) γ-rays belong to the class of high-frequency peaked BL Lac (HBL) objects. This suggested to us a systematic scan of candidate sources with the MAGIC telescope, based on the compilation of X-ray blazars by Donato et al. (2001). The observations took place from December 2004 to March 2006 and cover sources on the northern sky visible under small zenith distances zd < 30
◦at culmination, constraining the declination to values between − 2
◦and +58
◦. The sensitivity of the search was planned for detecting X-ray bright (F (1 keV) > 2 µJy) sources emitting at least the same energy flux at 200 GeV as at 1 keV. In order to avoid strong γ-ray attenuation close to the energy threshold, the redshift of the sources was constrained to values z < 0.3. Of the fourteen sources observed, 1ES 1218+304 (for the first time at very high energies) and 1ES 2344+514 (strong detection in a low flux state) have been detected in addition to the known bright TeV blazars Mrk 421 and Mrk 501. A marginal excess of 3.5σ from the position of 1ES 1011+496 was observed and has been confirmed as a source of VHE γ-rays by a second MAGIC observation triggered by a high optical state (Albert et al. 2007e). For the remaining sources, we present here the 99% confidence level upper limits (u.l.) on the integral flux above ∼ 200 GeV. We characterize the sample of HBLs (including all HBLs detected at VHE so far) by looking for correlations between their multi-frequency spectral indices determined from simultaneous optical, archival X-ray, and radio luminosities, finding that the VHE emitting HBLs do not seem to constitute a unique subclass. The absorption corrected γ-ray luminosities at 200 GeV of the HBLs are generally not higher than their X-ray luminosities at 1 keV.
Subject headings: gamma rays: observations – BL Lacertae objects: individual (1ES 0120+340,
1
1. Introduction
Blazars belong to the most extreme objects in astronomy. Dominated by a non-thermal contin- uum spectrum, covering up to twenty decades in energy, they show variability on time scales of years down to minutes (Albert et al. 2007f; Aha- ronian et al. 2007a), and apparent luminosities exceeding 10
49erg s
−1. Morphologically, blazars show strongly collimated jets extending from scales not much larger than the event horizon of a supermassive black hole (Biretta et al. 2002) up to megaparsec scales. Superluminal motion of knots in the radio jets indicates relativistic bulk motion (Ghisellini et al. 1993). X-ray knots at distances of more than the radiative cooling length from
a
Universit¨ at W¨ urzburg, D-97074 W¨ urzburg, Germany
b
IFAE, Edifici Cn., E-08193 Bellaterra (Barcelona), Spain
c
ETH Zurich, CH-8093 Switzerland
d
Universidad Complutense, E-28040 Madrid, Spain
e
Universitat Aut` onoma de Barcelona, E-08193 Bel- laterra, Spain
f
Max-Planck-Institut f¨ ur Physik, D-80805 M¨ unchen, Germany
g
Universit` a di Padova and INFN, I-35131 Padova, Italy
h
Universit¨ at Dortmund, D-44227 Dortmund, Germany
i
University of L´ od´ z, PL-90236 Lodz, Poland
j
Universitat de Barcelona, E-08028 Barcelona, Spain
k
Yerevan Physics Institute, AM-375036 Yerevan, Arme- nia
l
Tuorla Observatory, Turku University, FI-21500 Pi- ikki¨ o, Finland
m
Inst. de Astrofisica de Canarias, E-38200, La Laguna, Tenerife, Spain
n
Universit` a di Udine, and INFN Trieste, I-33100 Udine, Italy
o
Universit` a di Siena, and INFN Pisa, I-53100 Siena, Italy
p
University of California, Davis, CA-95616-8677, USA
q
Humboldt-Universit¨ at zu Berlin, D-12489 Berlin, Ger- many
r
Inst. for Nucl. Research and Nucl. Energy, BG-1784 Sofia, Bulgaria
s
INAF/Osservatorio Astronomico and INFN, I-34131 Trieste, Italy
t
Universit` a di Pisa, and INFN Pisa, I-56126 Pisa, Italy
u
ICREA & Institut de Cienci` es de l’Espai (IEEC-CSIC), E-08193 Bellaterra, Spain
v
Depto. de Astrofisica, Universidad, E-38206 La La- guna, Tenerife, Spain
x
deceased
*
correspondence: meyer@astro.uni-wuerzburg.de
the nucleus indicate in situ particle acceleration (Biretta et al. 1991), occuring at traveling and stationary shocks in the jet. According to the uni- fied scheme (e.g. Urry & Padovani 1995), blazars are accreting supermassive black holes expelling a relativistic plasma jet at a small angle between the jet axis and the line of sight, with strong boost- ing of the observed emission due to relativistic bulk motion of the emitting plasma. BL Lacer- tae objects differ from the generally more lumi- nous quasars by showing only faint or even absent emission lines, the absence of thermal big blue bump emission, and by not showing the otherwise typical luminosity evolution.
The Spectral Energy Distribution (SED) of blazars shows two pronounced peaks, the first be- tween IR and hard X-rays, which is commonly be- lieved to be synchrotron radiation of highly rel- ativistic electrons, and the second one at γ-rays.
Depending on the location of the first peak, BL Lac objects are further divided into low-frequency peaked BL Lacs (LBL, IR to optical) and high- frequency peaked BL Lacs (HBL, UV to X-rays) (Giommi & Padovani 1994). The second peak at high energies can be explained by inverse Compton scattering of low energy photons, produced as syn- chrotron radiation by the same population of elec- trons (Synchrotron Self Compton, SSC, Maraschi et al. (1992)), or from ambient thermal photon fields, which could enter directly into the emission region (Dermer & Schlickeiser 1993) or by scatter- ing on material surrounding the jet (Sikora et al.
1994). The origin could also be due to hadronic processes associated with proton and ion acceler- ation which leads to electromagnetic cascades and proton synchrotron radiation (Mannheim 1993;
Aharonian 2000; Muecke & Protheroe 2001). We cautiously remark, that the SED is probed at a sufficient level of sensitivity only in a limited range, there are still large gaps, in particular be- tween 50 keV and 100 MeV where further peaks could show up.
In December 2004, when the regular observa- tions with the Major Atmospheric Gamma-ray Imaging Cherenkov (MAGIC) telescope started, the number of known VHE blazars was six, all of them X-ray bright HBL objects. At the time of writing, the number has increased to 19
1, includ-
1
For an up-to-date list of VHE blazars, see
ing one LBL object (BL Lacertae, Albert et al.
2007d), one Flat Spectrum Radio Quasar (3C 279, Teshima et al. 2007) and the giant radio galaxy M87 (Aharonian et al. 2006b).
The detection of VHE γ-rays from cosmologi- cal distances is made difficult, due to absorption of γ-rays by photon-photon interactions with low energy photons from the evolving metagalactic ra- diation field (MRF). In the 100 GeV to 10 TeV range, far-infrared to optical photons are most im- portant for the attenuation. It has been realized that this leads to a relation between the γ-ray cutoff energy and the source redshift known as the Fazio-Stecker relation (Fazio & Stecker 1979;
Kneiske et al. 2004). The fact that the so-far detected VHE sources have much lower redshifts compared with the EGRET γ-ray sources is in line with the expected effect of γ-ray attenuation, al- though the lack of curvature in the observed spec- tra is a source of serious doubts (Aharonian et al.
2006a).
Due to the small field-of-view of an Imaging Air Cherenkov Telescope (IACT) and the limited duty cycle of ∼ 1000 hrs per year, promising can- ditates for VHE emission have to be selected care- fully. All established TeV sources are bright X-ray sources, most of them with comparable luminosi- ties in both regimes, which renders a systematic scan of the X-ray brightest HBL objects a reason- able approach.
Here we report on the results of such an ap- proach pursued with the MAGIC telescope for a sample of 14 HBLs. In Sect. 2 the selection criteria for the sample are discussed, while the description of the observations can be found in Sect. 3. The data analysis technique is described in Sect. 4, and the analysis results are summarized in Sect. 5. A brief explanation of how the SEDs were obtained from the data (using archival radio and X-ray data as well as simultaneous optical data) can be found in Sect. 6. Finally, the resulting properties of the SED of HBLs and inferences on their luminosity function are discussed in Sect. 7.
2. HBL sample
We used the compilation from Donato et al.
(2001), which provides 421 X-ray fluxes with spec-
http://www.mppmu.mpg.de/ rwagner/sources/
tral information for 268 blazars (136 of them HBL objects) together with average radio (at 5 GHz) and optical (V-band) fluxes. The selection cri- teria were (i) redshift z < 0.3, (ii) X-ray flux F
x(1 keV) > 2 µJy, and (iii) zenith distance (zd <
30
◦during culmination, a total of fifteen sources remained after cuts.
The selection was made to avoid strong γ-ray attenuation at the energy threshold. At z = 0.3, the expected cut-off energy is still above 200 GeV, where MAGIC has its highest sensitivity. As the energy threshold increases with the zenith dis- tance, all observations were carried out below 40
◦, where the analysis energy threshold is around 200 GeV. As most of the established TeV sources show comparable luminosities in X-rays and in γ- rays, only the X-ray brightest HBLs were selected, leading to a cut at 2 µJy. Assuming the same lu- minosity at ∼ 200 GeV, it corresponds to ∼ 7% of the flux of the Crab Nebula, which would be de- tectable for MAGIC within 15 hrs.
The goal was to observe them for at least 15 hrs in order to establish new VHE sources and to put constraints on the SED of HBLs in a systematic fashion. The complete set is listed in Table 1.
3. Observations
The MAGIC telescope is a single dish IACT, lo- cated on the Canary island of La Palma (28.8
◦N, 17.8
◦W, 2200 m a.s.l.). A 17 m diameter tes- sellated parabolic mirror with a total surface of 234 m
2, mounted on a light-weight space frame made from carbon fiber reinforced plastic tubes, focuses Cherenkov light from air showers, initi- ated by γ-rays or charged cosmic rays, onto a 576- pixel photomultiplier camera with a field-of-view of 3.5
◦. The analogue signals are transported via optical fibers to the trigger electronics and each channel is read out by a 300 Msample/s FADC.
Further details on the telescope can be found in Baixeras et al. (2004) and Cortina et al. (2005).
Note that the readout system has been upgraded to a 2GSample/s FADC in February 2007 (Goebel et al. 2007). A second telescope of the same size for observations in stereo mode is currently under construction.
The observations took place from December
2004 to March 2006 in moonless nights. The data
are taken in different observation modes. If the
List of targets.
Source RA dec z flux
aΓ
bseason Time [h]
c1ES 0120+340 01 23 08.9 +34 20 50 0.272 4.34 1.93 2005 Aug-Sep 14.9 RX J0319.8+1845 03 19 51.8 +18 45 35 0.190 1.76
d2.07 2004 Dec-2005 Feb 6.9
2005 Sep-2006 Jan 4.7 1ES 0323+022 03 26 14.0 +02 25 15 0.147 3.24 2.46 2005 Sep-Dec 11.4 1ES 0414+009 04 16 53 +01 04 54 0.287 5.00 2.49 2005 Dec-2006 Jan 17.8 1ES 0806+524 08 09 49.2 +52 18 58 0.138 4.91 2.93 2005 Oct-Dec 17.5 1ES 0927+500 09 30 37.6 +49 50 24 0.188 4.00 1.88 2005 Dec-2006 Mar 16.1 1ES 1011+496 10 15 04.2 +49 26 01 0.212
e2.15 2.49 2006 Mar-Apr 14.5 Mrk 421 11 04 27.3 +38 12 31.8 0.030 39.4 2.96 2004 Nov-2005 Mar 25.6
f1ES 1218+304 12 21 21.9 +30 10 37 0.182 8.78 2.34 2005 Jan 8.2
g2006 Jan-Mar 14.6
RX J1417.9+2543 14 17 56.6 +25 43 25 0.237 3.58 2.25 2005 Apr-Jun 13.0 1ES 1426+428 14 28 32.5 +42 40 25 0.129 7.63 2.09 2005 Mar-Dec 6.1 Mrk 501 16 53 52.2 +39 45 36.6 0.034 20.9 2.25 2005 May-Jul 32.2
hRX J1725.0+1152 17 25 04.4 +11 52 16 > 0.17
i3.60 2.65 2005 Apr 5.3
1ES 1727+502 17 28 18.6 +50 13 11 0.055 3.68 2.61 -
j0
j1ES 2344+514 23 47 04.9 +51 42 18 0.044 4.98 2.18 2005 Aug-2006 Jan 23.1
ka
F(1 keV) [µJy], average value from different measurements, taken from Donato et al. (2001).
b
Γ is the spectral index for the differential spectrum (dN/dE) at 1 keV, assuming a power law
c
Effective observation time after quality selection
d
Two measurements are above 3 µJy, one below 1 µJy
e
The earlier reported redshift of 0.200 was recently revised by Albert et al. (2007e)
f
Results published in Albert et al. (2007c)
g
Results published in Albert et al. (2006b)
h
Results published in Albert et al. (2007f)
i
The earlier reported redshift of 0.018 was recently revised by a lower limit (Sbarufatti et al. 2006)
j
Proposed but not observed due to bad weather
k
Results published in Albert et al. (2007b)
telescope is pointing to the source (on-mode), the background has to be determined by so-called off- data, where the telescope points to a nearby sky region where no γ-ray source is expected. The off-data cover the same zd range with a similar night-sky background light intensity. The larger fraction of the source sample was observed in the so-called wobble mode, where the pointing of the telescope wobbles every 20 minutes between two symmetric sky locations with an angular distance of 0.4
◦to the source. The background in the signal region can be estimated from sky locations placed at the same distance from the camera center as the candidate source.
Except 1ES 0927+500 and 1ES 0414+009, all objects were monitored by the KVA telescope (http://users.utu.fi/kani/1m/index.html ) on La Palma in the optical R-band. None of the sources showed flaring activity in the optical during the MAGIC observations. The host galaxy corrected fluxes (Nilsson et al. 2007), taken simultaneously, averaged over the time of the MAGIC observa- tions, are listed in Table 5.
4. Data analysis technique
The data are processed using the MAGIC Anal- ysis and Reconstruction Software (MARS) (Bretz 2005a). A description of the different analysis steps can be found in Gaug et al. (2005) (including the calibration) and Bretz (2005b).
As the trigger rate strongly depends on the weather condition, only data with a rate above 160 Hz are used to ensure a high data quality.
The moments up to third order of the light dis- tribution are used to characterise each event by a set of image parameters (Hillas 1985). For back- ground suppression, a SIZE-dependent parabolic cut in WIDTH × LENGTH is applied (Riegel 2005). To reconstruct the origin of the shower in the camera plane, the DISP method is employed (Lessard et al. 2001) to estimate the distance be- tween the centre of gravity of the shower and its origin. The third moment determines the direc- tion of the shower development. The constant coefficient ξ from the parametrisation of DISP in the original approach is replaced in this analysis by ξ
0+ ξ
1· (LEAKAGE)
ξ2, LEAKAGE being the fraction of light contained in the outermost cam- era pixels. Thereby the truncation of the shower
images at the camera border is taken into account.
These coefficients are determined separately for on-off and wobble data using simulated γ-showers, which are produced by CORSIKA, version 6.023 (Heck et al. 1998; Majumdar et al. 2005) for zd be- low 40
◦and energies between 10 GeV and 30 TeV, following a power law with a spectral index -2.6.
The cut coefficients for the background suppres- sion are optimised using Crab Nebula data, taken at similar zd. One set of cut coefficients is derived for data taken in on-off mode and one for wob- ble mode. The significance of a possible signal is determined from the distribution of the squared angular distance (θ
2) between the shower origin and the source position. The signal region is de- termined as θ < 0.23
◦, corresponding to slightly more than two times the γ point-spread function of the MAGIC telescope.
For observation in on-off mode, the off-data have to be scaled to match the on-data. This is done in the region 0.37
◦< θ < 0.80
◦, where no bias from the source is expected. For wobble ob- servations three regions, located symmetrically on a ring around the camera centre with the same dis- tance from the centre as the source position, are defined as background regions. The scale factor is fixed to 1/3.
For every source the statistical significance ac- cording to equation 17 from Li & Ma (1983) is calculated. The upper limit on the excess rate is derived with a confidence level (c.l.) of 99%, using the method from Rolke et al. (2005), which takes also the scaling factor of the background into ac- count. The upper limit for the excess rate is then compared to the excess rate of the Crab Nebula, which leads to an upper limit of the flux in units of the Crab Nebula flux above a certain energy threshold, assuming a Crab like spectrum. The en- ergy threshold is here defined as the energy where the differential distribution (dN/dE vs. E) of simu- lated γ-ray events, surviving all cuts, peaks. Note that this threshold depends also on the spectral shape.
A large sample of data from the Crab Nebula in on-off as well as in wobble mode is used, spread over the entire observation campaign (see Table 2).
This analysis shows, that the excess rate of the
Crab Nebula is correlated to the background rate
(after γ-hadron separation). Therefore, depend-
ing on the background rate of the AGN, a refer-
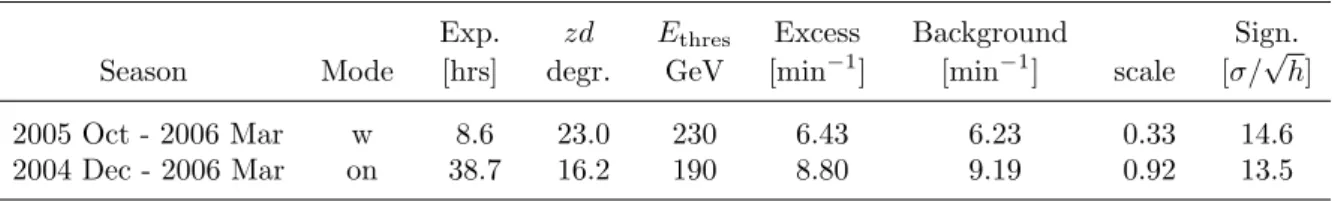
Observations of the Crab Nebula used for the upper limit calculation
Exp. zd E
thresExcess Background Sign.
Season Mode [hrs] degr. GeV [min
−1] [min
−1] scale [σ/ √ h]
2005 Oct - 2006 Mar w 8.6 23.0 230 6.43 6.23 0.33 14.6
2004 Dec - 2006 Mar on 38.7 16.2 190 8.80 9.19 0.92 13.5
background evts/min
8 9 10 11 12
excess evts/min
7 8 9 10 11 12
Fig. 1.— Excess rate (excess) vs. background rate (bgd) for the Crab Nebula (on-off mode). A linear fit yields (0.95 ± 0.10) · bgd + 0.2 = excess.
ence value for the excess rate of Crab has to be calculated. This can be understood when taking into account that even after quality selection the rates fluctuate up to 20%, depending on weather conditions. In Fig. 1 and Fig. 2 the rate of excess events vs. the background rate of different subsam- ples of the Crab Nebula is shown. A linear regres- sion to the on-off samples results in an acceptable fit (χ
2/d.o.f. = 26/14), showing a clear correla- tion. The fit for the wobble data is quite poor (χ
2/d.o.f. = 13.5/3). As a constant fit gives even a worse result and the fit on the on-data shows a correlation between background- and excess rate, the linear fit for the wobble data is also used to calculate the reference values for the comparison of the excess rates. The Crab units are converted into a flux of photons cm
−2s
−1using the spectrum of the Crab Nebula from Albert et al. (2007g).
The systematic error for the flux is estimated to be ∼ 30% (see Albert et al. (2007g) and discus- sion therein). For the u.l. determination there is
background evts/min
4 4.5 5 5.5 6 6.5 7 7.5 8 8.5
excess evts/min
5 5.5 6 6.5 7 7.5 8 8.5 9
Fig. 2.— Excess rate (excess) vs. background rate (bgd) for the Crab Nebula (wobble mode). A linear fit yields (1.26 ± 0.3) · bgd − 1.5 = excess.
also the uncertainty of the correct energy thresh- old (which depends on the source spectrum).
5. Results of the MAGIC observations Within this observation program, VHE γ-rays were discovered from 1ES 1218+304 (Albert et al. 2006b) and 1ES 2344+515 was observed in a low flux state with high significance (Albert et al. 2007b). Mrk 421 was observed for more than 25 hrs in 2005. The results are discussed in detail in Albert et al. (2007c). Mrk 501 was observed from May to July 2005 with more than 30 hrs, re- vealing a high precision lightcurve on a day-by-day basis as well a two exceptionally short-time flares (see Albert et al. (2007f) for more details). For ten sources of the sample, no significant signal is seen.
The 2006 observation of 1ES 1218+304 results in
a weak signal of 4.6 σ (see Sect. 5.2). A slightly re-
fined analysis of 1ES 1011+496 yields a hint of a
signal with a 3.5 σ significance (see Sect. 5.3). The
results are listed in Table 3. Observations of 1ES
1727+502 are still pending.
5.1. Upper limits
The u.l.s are between 2.3% and 8.6% of the Crab Nebula flux. For a Crab-like spectrum the energy thresholds vary between (190 ± 15) GeV and (230 ± 15) GeV, depending on the zd of the obser- vation. For the threshold calculation the exact zd distribution of every observation is taken into account. As the Crab spectrum at ∼ 200 GeV is quite hard (spectral slope -2.26 for the differen- tial energy spectrum), the u.l.s are also calculated for an -3.0 power law spectrum, which represents quite well the average slope of all HBLs detected at VHE so far. In Table 5 the energy threshold as well as the flux u.l. at 200 GeV are given under the assumption of a -3.0 power law.
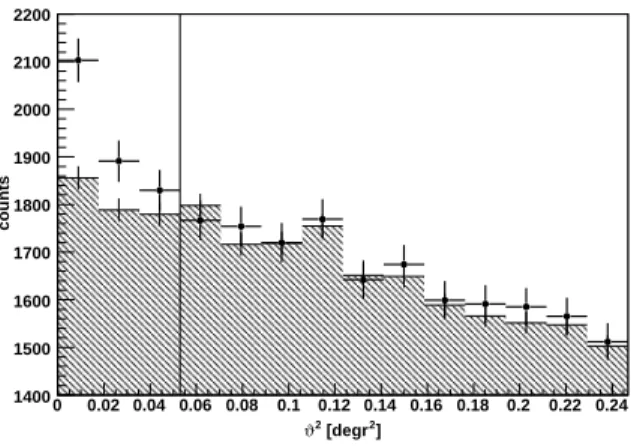
5.2. 1ES 1218+304
The source was observed in 2006 from January the 29th to March the 5th during 15 nights with in total 14.6 hrs. Figure 3 shows the distribution of the squared angular distance between the recon- structed shower origin of each event and the as- sumed source position. The vertical line indicates the signal region. The background is determined by three off-regions in the camera. The excess has a statistical significance of 4.6 σ (see also Table 3).
2] [degr ϑ2
0 0.02 0.04 0.06 0.08 0.1 0.12 0.14 0.16 0.18 0.2 0.22 0.24
counts
1400 1500 1600 1700 1800 1900 2000 2100 2200
Proj Entries 132084 Mean 0.5387 RMS 0.3711
Fig. 3.— Distribution of the squared angular dis- tance with respect to the position of 1ES 1218+304 (dots) and to three off-regions (scaled by 1/3, gray shaded area).
Under the assumption of a power law spectrum
with spectral slope of -3.0 as measured in 2005 (Al- bert et al. 2006b), the energy threshold decreases with respect to a Crab like spectrum to 190 GeV.
The average integral flux above 180 GeV for the complete sample is F(> 180 GeV) = (1.48 ± 0.48) × 10
−11photons cm
−2s
−1.
The search for flux variability on time scales from days ( ∼ 1 h observation time per night) to weeks (sample with several consecutive nights) yielded no significant variability.
The integral flux above 180 GeV indicates a
∼ 30% lower flux than the one measured in 2005, even though they are consistent within their er- rors. The average optical flux in 2006 was ∼ 20%
lower than in 2005, which is already significant compared to the statistical error of ∼ 2%. During the observations in 2006 the optical flux decreased continuously from (1.144 ± 0.036) mJy on the 3rd of February to (0.947 ± 0.038) mJy on the 7th of March (all optical fluxes are host galaxy sub- tracted). This trend continued until June, where the source remained in a low optical state. Unfor- tunately with six nights the sampling of the opti- cal light curve during the MAGIC observations is quite low, hence an increase of the optical activity on a time scale of days can not be excluded.
5.3. 1ES 1011+496
The standard analysis performed for the whole source sample yields a significance of 2.5 σ, which gives already a hint for a possible signal. In a more refined analysis, the cut in θ
2, which determines the signal region, was reduced to θ = 0.20
◦. In case of a weak signal the increased signal to back- ground ratio would lead to a higher significance.
Also the SIZE-dependent cut for the background suppression is changed to a slightly higher value.
The same analysis, performed on a data sample of the Crab Nebula, results in almost the same significance as with the standard coefficients, but with a ∼ 13% lower γ-rate due to the reduced γ acceptance and a 37% lower background rate.
This analysis yields 3.5 σ for 1ES 1011+496
which - if interpreted as a detection - corresponds
to an integral flux of F (> 180 GeV) = (1.26 ±
0.40) × 10
−11photons cm
−2s
−1. Further observa-
tions with the MAGIC telescope, triggered by an
optical outburst in March 2007, shows a clear sig-
nal of 6.2 σ within 18.7 hrs of observation, result-
Results of the analysis.
Exp. Zd
aE
thresbSig. UL UL
Source Mode [hrs] [degr.] [GeV] Excess
cBackgr. Scale σ c.u.
df.u.
e1ES 0120+340 w 14.9 12.2 190 -48 5358 0.33 -0.6 0.032 0.75
RX J0319.8+1845 w 4.7 14.3 190 9 2225 0.33 0.2 0.049 1.15
RX J0319.8+1845 on 6.5 14.2 190 -95 3257 0.86 -1.2 0.033 0.78
1ES 0323+022 w 11.4 29.0 230 55 5262 0.33 0.7 0.064 1.16
1ES 0414+009 w 17.8 29.7 230 176 7309 0.33 1.8 0.057 1.03
1ES 0806+524 w 17.5 26.8 230 111 6174 0.33 1.2 0.056 1.01
1ES 0927+500 w 16.1 22.1 230 72 5721 0.33 0.8 0.052 0.94
1ES 1011+496 w 14.5 23.6 230 200 4857 0.33 2.5 0.086 1.55
1ES 1218+304 w 14.6 26.6 230 400 5423 0.33 4.6 0.073
f1.31
fRX J1417.9+2543 on 13.0 9.7 190 -137 9007 1.03 -1.0 0.023 0.54
1ES 1426+428 on 6.1 16.6 190 -7 2561 0.24 -0.1 0.050 1.18
RX J1725.0+1152 on 5.3 17.4 190 -69 2001 0.98 -1.1 0.046 1.08
a
Mean zenith angle of the observation
b
Peak response energy for a Crab like spectrum
c
Background subtracted signal events for θ < 0.23
◦d
Integral flux above the threshold given in units of the flux of the Crab Nebula (crab units, c.u.)
e
Integral flux above the threshold given in flux units (f.u.) of 10
−11photons cm
−2s
−1f
Integral flux above threshold in cu. and f.u. corresponding to the 4.6 σ excess
ing in flux ∼ 50% higher than in 2006 (Albert et al. 2007e).
5.4. 1ES 1426+428
The VERITAS collaboration reported a steep spectrum above 300 GeV for their observations in 2001, well fitted by a power law with spectral in- dex − (3.50 ± 0.35) (Petry et al. 2002). Extrapolat- ing the spectral fit to 200 GeV, it yields an integral flux of 0.50 Crab above 200 GeV, which is by a fac- tor of 10 larger than the u.l. presented in this work.
Previous measurements yield a marginal detection in 2000 and upper limits for the data taken from 1995 to 1999 (Horan et al. 2002) with the most stringent one of 0.08 Crab above 350 GeV.
The HEGRA collaboration published a much harder spectrum at higher energies (above ∼ 800 GeV) for their combined 1999 and 2000 data, which were well fitted by a power law with spectral in- dex − (2.6 ± 0.6) (Aharonian et al. 2002). An extrapolation of the power law yields an integral flux above 200 GeV of 0.075 Crab. Due to the large extrapolated energy range, combined with the large statistical error of 0.6 for the slope, the uncertainty is a factor of two. Further measure- ments in 2002 with the HEGRA telescopes showed the source in a 2.5 times lower flux state (Aharo- nian et al. 2003).
The u.l. for the flux above 200 GeV presented in this work, indicates a lower flux than measured from 1999 to 2001 during several campaigns with different telescopes, whereas it is consistent with the low flux level observed in 2002.
6. Spectral Energy Distribution
The complete set of sources, described in Sect. 2, amounts to 14 objects (without 1ES 1727+502) and includes the five established TeV sources Mrk 501, 1ES 1218+304, 1ES 1426+428, Mrk 421 and 1ES 2344+514. To better understand the spectral energy distribution of VHE gamma ray emitting blazars, the sample is enlarged by including ten more sources which fullfill the same selection criteria in X-ray flux and redshift, but which deviate only in the zenith angle cut. This means, they can only be observed under large zenith distances from the MAGIC site or not at all, in which case there is still information avail- able from corresponding H.E.S.S. observations.
An exception is PG 1553+113 where the redshift is not known. For the total, enlarged sample of 24 HBLs, multi-wavelength data are collected in the following bands: radio (5 GHz, Donato et al.
(2001)), optical (R-band, 640 nm, simultaneous data from KVA or, if not available from Donato et al. (2001)), X-rays (1 keV, Donato et al. (2001)), and γ-rays (200 GeV, see Table 4, Table 5 and ref.
in Table 1). For 1ES 1426+428, in addition to the upper limit derived in this work, the extrap- olation of the spectrum, as measured by HEGRA in 1999/2000, is used to mark the detected flux.
The optical data were corrected for galactic ex- tinction, using the coefficients from the NASA Extragalactic Database (NED), which are calcu- lated according to Schlegel et al. (1998).
For the γ-ray flux, sizeable attenuation is ex- pected from current models of the MRF (Hauser
& Dwek 2001; Kneiske et al. 2004). Therefore all u.l. at 200 GeV as well as the measured fluxes of the detected HBLs are corrected for the ab- sorption by multiplying with exp(τ(200 GeV, z)) where τ denotes the pair production optical depth.
The ”best-fit 2006” MRF-model (Kneiske 2007, in preparation) is employed. This model is based on the ”best fit” model from Kneiske et al. (2004), but with a lower star formation rate to keep the en- ergy density in the optical band closer to the lower limits, derived from the galaxy number counts and consistent with the u.l. derived by Aharonian et al. (2006a) from the VHE spectrum of 1ES 1101- 233 (z = 0.186). The optical depth values for 200 GeV photons for all sources of this sample are listed in Table 5.
All fluxes are K-corrected. Radio spectral in- dices
2of ten of the sources can be found in Landt (2003). For the other 14 objects the average value α
R= 0.23 of the ten sources is used. For the opti- cal data, the spectral indices of nine sources, cal- culated at slightly higher wavelengths, are taken from Bersanelli et al. (1992). For the other 15 ob- jects, the average value α
O= 0.65 of the nine sources is used. At 1 keV, the spectral indices are taken from Donato et al. (2001), except for 1ES 0229+200, which is not included in this com- pilation. Instead, the flux is taken from Costa- mante & Ghisellini (2002) together with the aver-
2
Spectral index defined by the photon flux F ∝ ν
−α[pho-
tons cm
−2s
−1]
age value for the spectral index α
X= 1.36 of all other sources. At 200 GeV the measured spectral indices are used for the detected sources, while for the non-detected ones the average value α
γ= 2.0 is used. To take into account the energy depen- dent attenuation at VHE, which causes a harden- ing of the spectrum, the measured spectral indices are changed by -0.4 for 0.1 < z < 0.2, -0.8 for 0.2 < z < 0.3 and remain unchanged for z < 0.1.
A special treatment is necessary to derive the flux at 200 GeV from 1ES 0229+200, recently dis- covered at VHE γ-rays (Aharonian et al. 2007c).
The spectrum is measured above 580 GeV, well fit- ted by a power law with spectral index − (2.51 ± 0.19). As the source is located at z = 0.1396, strong absorption is expected at these energies.
Therefore the spectrum is first deabsorbed and afterwards extrapolated to lower energies (Ta- ble 4). The resulting intrinsic spectrum is well de- scribed by a power law with a spectral index of
− (1.09 ± 0.25) (flux normalisation: (4.24 ± 0.81) × 10
−12cm
−2s
−1TeV
−1at 1 TeV). This result is in good agreement with the results from Stecker &
Scully (2007), yielding model dependent intrin- sic spectral indices in the range from 1.1 ± 0.3 to 1.5 ± 0.3.
After these corrections, the broad-band spec- tral indices
3α
1−2between the different energy regimes are calculated. Also the luminosities νL
νare calculated assuming isotropic emission and with the use of the following cosmological param- eters: H
0= 71 km s
−1Mpc
−1, Ω
Λ= 0.73, and Ω
m= 0.27.
7. Discussion
7.1. Gamma ray emitting HBLs?
One may ask whether the gamma ray emitting HBLs can be distinguished from other HBLs based on their spectral energy distributions. Finding the answer is hampered by a number of problems. The variable peak frequencies, which cannot be easily detected in fixed energy bands, the gamma ray at- tenuation due to pair production in the metagalac- tic radiation field, and the flux variability. From Donato et al. (2001), the amplitude of the flux variability at 1 keV amounts to a factor of six for the sources with multiple entries in the catalogue.
3
α
1−2= − log(F
1/F
2)/ log(ν
1/ν
2) , ν
1< ν
2Similar or larger amplitudes can be expected at VHE. However, our sample is not triggered by flux variability, the duty cycle of flares generally seems to be rather low, and the observed fluxes or flux upper limits may therefore be characteristic of the quiescent average fluxes.
Figure 4 shows the broad-band spectral index α
ROvs. α
OXfor all 24 HBLs as described in the previous section. The distribution is quite ho- mogeneous. As the data are not simultaneously taken, the uncertainties due to flux variations have to be taken into account. In the case of α
OXa flux variability of a factor six at 1 keV coresponds to a change in the spectral index of 0.29 (if the op- tical flux remains the same). This is still below the difference of 0.6 between the lowest and high- est values of α
OXfor the detected VHE sources.
Thus there are significant differences in the SED among the HBLs studied here. As the variability in the radio and optical band for HBLs is lower than at X-rays or VHE γ-rays and the change of the spectral index α
ROis smaller for different flux ratios, the variation of α
ROis much lower than for α
OX. However, it is not possible to distinguish be- tween sources detected at VHE and non-detected ones based on spectral indices.
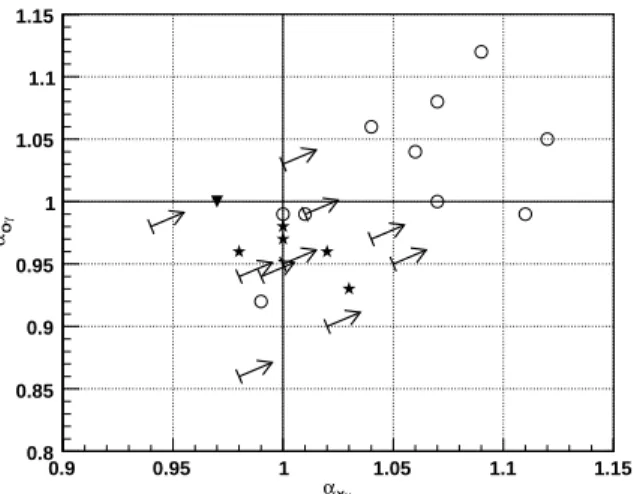
7.2. Gamma-to-X-ray spectral index To unveil the physical state of the emitting plasma, we seek to find the characteristic ratio of the two peaks in the spectral energy distri- bution of HBLs which is related to the ratio of photon and magnetic field energy densities. Fig- ure 5 shows the broad-band spectral index α
Oγvs.
α
Xγ. Both indices are distributed in a narrow
band around unity for all detected sources, where
α = 1 represents the case that the energy output
in both frequency bands is the same. The con-
straints from the u.l.s on the γ-ray flux can not ex-
clude the region which is spanned by the detected
TeV sources. In the framework of SSC models,
the optical and X-ray band belong to synchrotron
emission of highly relativistic electrons (first peak
in the SED), while the VHE γ-rays are produced
by inverse Compton scattering (second peak in the
SED). If the magnetic energy density u
Bis equal
to the photon energy density u
ph, the energy out-
put for the synchrotron and the Inverse Compton
emission as well as the peak luminosities are the
same. In case of HBLs, the peak frequency of the
Table 4
HBLs detected at VHE which do not belong to the sample described in Sect. 2 .
Source F
γaRef.
1ES 0229+200 1.6
bAharonian et al. (2007c) 1ES 0347-121 4.25 Aharonian et al. (2007b) PKS 0548-322 1.9 Superina et al. (2007) 1ES 1101-232 2.93 Aharonian et al. (2006a) Mrk 180 11.0 Albert et al. (2006c) PG 1553+113 11.5 Albert et al. (2007a) 1ES 1959+650 17.4 Albert et al. (2006a) PKS 2005-304 6.63 Aharonian et al. (2005a) PKS 2155-489 26.3 Aharonian et al. (2005b) H 2356-309 2.78 Aharonian et al. (2006a)
a
νF
ν(200 GeV) in units of 10
−12erg cm
−2s
−1b
This value comes from an extrapolation as de- scribed in the text
αOX
0.4 0.5 0.6 0.7 0.8 0.9 1 1.1 1.2 1.3
ROα
0 0.1 0.2 0.3 0.4 0.5 0.6 0.7
Fig. 4.— The broad-band spectral index α
ROvs.
α
OX. The filled symbols mark the spectral in- dices of the sources which belong to the sample described in Sect. 2. They are further divided into detected (stars) and non-detected sources (trian- gles). The open circles represent all other HBLs detected at VHE γ-rays so far.
synchrotron emission is always at higher frequen- cies than the optical band and below 1 keV for most of them (except the extreme blazars with a hard spectrum at 1 keV). At VHE energies, most of the detected sources show a soft spectrum above
∼ 200 GeV, indicating observed peak energies be- low 100 GeV. Due to absorption of VHE γ-rays in the MRF, the intrinsic peak energies could also reach several TeV for sources located at higher red- shifts. In that context, the scattering of α
Oγand α
Xγaround unity could be explained by a con- tinuous distribution of peak frequencies for HBLs, measured with fixed bandwidth.
Figure 6 shows the broad-band spectral index α
Xγvs. X-ray luminosity ν
XL
X. The average en- ergy output at 1 keV never exceeds significantly the one at 200 GeV (α
Xγ> 0.97). For half of the detected sources, the energy output in these bands is almost the same (α
Xγ∼ = 1), while for the other ones the energy output at 200 GeV is significantly lower. There is a tendency that this effect shows up at higher X-ray luminosities. For four of the ten u.l., α
Xγ= 1 can not be excluded, whereas for the other six sources α
Xγhas to be larger than unity.
For the non-detected sources of the sample, fur-
ther observations with longer exposures are needed
to reach the α
Xγ= 1.12–line (corresponding to a
nine times lower output at 200 GeV compared to
Upper limits on the γ -ray flux at 200 GeV under the assumption of a -3.0 power law spectrum togehter with the optical depth and the simultaneous optical data.
E
thresaSource Mode GeV F
γbz τ
cF
odF
Xe1ES 0120+340 w 170 4.0 0.272 0.53 0.47 ± 0.05 10.5
RX J0319.8+1845 w 170 4.2 0.190 0.32 0.48 ± 0.10 4.3 RX J0319.8+1845 on 170 6.2 0.190 0.32 0.14 ± 0.10 4.3
1ES 0323+022 w 190 8.7 0.147 0.22 1.82 ± 0.19 7.8
1ES 0414+009 w 190 7.7 0.287 0.57 · · · 12.1
1ES 0806+524 w 190 7.6 0.138 0.21 8.00 ± 0.23 11.9
1ES 0927+500 w 170 7.1 0.188 0.31 · · · 9.7
1ES 1011+496 w 170 10.9/6.5
f0.212 0.37 11.49 ± 0.13 5.2 1ES 1218+304
gon 120 10.1 0.182 0.29 6.13 ± 0.13 21.2
1ES 1218+304 w 190 7.7 0.182 0.29 4.99 ± 0.11 21.2
RX J1417.9+2543 on 140 2.5 0.237 0.43 2.11 ± 0.29 8.7
1ES 1426+428 on 140 5.5 0.129 0.19 1.87 ± 0.15 18.5
RX J1725.0+1152 on 190 6.3 > 0.17 0.27
h13.27 ± 0.09 8.7 1ES 2344+514
iw 180 11.5 0.044 0.05 3.37 ± 0.25 12.0
a
Peak response energy for a power law spectrum with index -3.0
b
νF
ν(200 GeV) in units of 10
−12erg cm
−2s
−1c
optical depth τ(z) at 200 GeV
d
νF
ν(640 nm) in units of 10
−12erg cm
−2s
−1(Host galaxy substracted)
e
νF
ν(1 keV) in units of 10
−12erg cm
−2s
−1taken from Donato et al. (2001)
f
Flux under the assumption of a detection
g
Values from Albert et al. (2006b)
h
For a redshift of 0.17
i
Values from Albert et al. (2007b)
γ
αX
0.9 0.95 1 1.05 1.1 1.15
γOα
0.8 0.85 0.9 0.95 1 1.05 1.1 1.15
Fig. 5.— The broad-band spectral index α
Oγvs. α
Xγ. The arrows mark the upper limits for the spectral indices, as calculated in this work, whereas the stars indicate the spectral indices of the detected sources that belong to the sample de- scribed in Sect. 2. The open circles mark all are other HBL objects detected a VHE γ-rays so far.
1 keV), which includes all HBLs detected at VHE so far. Note that if α
Xγ= 1 for the peak frequen- cies is valid, the tendency of increasing α
Xγvalues with increasing luminosities at 1 keV could be in- terpreted as a shift of the inverse Compton peak to lower values.
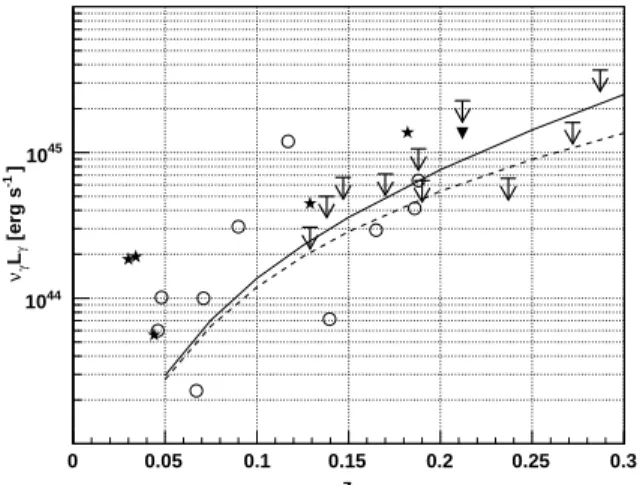
7.3. Constraints on the luminosity func- tion of γ -ray emitting HBLs
Figure 7 shows the luminosity ν
γL
γat 200 GeV vs. the redshift. All detected sources are above or within the line that marks the corresponding lumi- nosity to a flux of 2 µJy at 1 keV. The absorption of γ-rays by the MRF increases with redshift, so that at a redshift of z = 0.3, the emitted luminos- ity becomes twice larger than the measured one.
The luminosity function at γ-ray energies of HBLs is poorly known, since there has not been a complete survey and the number of detected sources is still rather low. Nevertheless, we can try to constrain the VHE luminosity function from our observations. To this end we derive upper limits on the cumulative omnidirectional flux at 200 GeV from X-ray bright HBLs below z = 0.3, noting that GLAST will measure the diffuse ex-
-1 ] [erg s LX
νX
1044 1045 1046
γXα
0.9 0.95 1 1.05 1.1 1.15
Fig. 6.— The broad-band spectral index α
Xγvs.
the X-ray luminosity ν
XL
X. The arrows mark the upper limits for the spectral indices, as calculated in this work, while the stars indicate the values for the detected sources that belong to the sample described in Sect. 2. The open circles mark all other HBL objects detected at VHE γ-rays so far.
tragalactic background up to 200 GeV. The se- lection criterion for the declination of the sam- ple corresponds the a patch of the sky with a size of 5.55 sr (or 44% of the sky). The sum over all 14 sources of the sample divided by the 5.55 sr patch results in an upper limit on the to- tal intensity at 200 GeV of I
VHE(200 GeV) = ε · 2.76 × 10
−9GeV cm
−2sr
−1s
−1, where ε accounts for the incompleteness of the sample. Assuming an isotropic distribution of HBLs, ε should be larger than unity. We know about two sources, not in- cluded in this calculation (1ES 1727+502 and 1ES 0229+200). There are also 5 HBLs from Donato et al. (2001) that fullfill the criteria of declina- tion and X-ray flux, but are located at higher red- shifts. Including these sources the sample would increase to 21 sources. With respect to the ∼ 50%
sky coverage of the Einstein Slew Survey, where most of the sources belong to, ε = 3 seems to be a reasonable assumption (factor 1.5 to take the
”known” sources into account and a factor 2 for
the assumed sky coverage of 50% for the extended
sample of 21 sources). This would lead to an
upper limit for the total intensity at 200 GeV of
I
VHE(200 GeV) = 8.3 × 10
−8GeV cm
−2sr
−1s
−1.
Not that this u.l. is already conservative as also
z
0 0.05 0.1 0.15 0.2 0.25 0.3
]-1 [erg sγLγν
1044
1045