29th International Cosmic Ray Conference Pune (2005)00, 101–106
Observations of the Crab nebula with the MAGIC telescope
R. M. Wagner
a, M. Lopez
b, K. Mase
a,f, E. Domingo–Santamaria
c, F. Goebel
a, J. Flix
c, P. Majumdar
a, D.Mazin
b, A. Moralejo
d, D. Paneque
a, J. Rico
c, and T. Schweizer
eon behalf of the MAGIC collaboration
(a) Max-Planck-Institut f¨ur Physik, F¨ohringer Ring 6, D-80805 M¨unchen, Germany
(b) Universidad Complutense de Madrid, Facultad de Ciencias Fisicas, E-28040 Madrid, Spain (c) Institut de Fisica d’Altes Energies, E-08193 Bellaterra, Spain
(d) Dipartimento di Fisica Galileo Galilei and INFN Padova, Via Marzolo 8, I-35131 Padova, Italy (e) Humboldt-Universit¨at zu Berlin, Institut f¨ur Physik, Newtonstrasse 15, D-12489 Berlin, Germany
(f) now at Chiba University, Department of Physics, Yayoi-tyo 1-33, Inage-ku, Chiba-shi, Chiba-ken, Japan 263-8522
Presenter: R. M. Wagner (robert.wagner@mppmu.mpg.de), ger-wagner-R-abs1-og22-oral
During and shortly after the telescope commissioning the MAGIC collaboration observed the Crab nebula.
Its steady flux of gamma rays provides good means for studying the telescope performance. Here we present results obtained from these observations. Emphasis is put on the stability of the flux determination during periods with different telescope performances and on describing new analysis methods used to extract signals in the low energy region. The analysis is restricted to energies above 100 GeV, since details in theγ/hadron separation in the low energy region and the telescope performance require more studies.
1. Introduction
The 17 m diameter MAGIC telescope[1, 2], located on the Canary island of La Palma (28.8◦North, 17.8◦West, 2200 m a.s.l.), is a new generation, high performance air Cerenkov telescope for very high energy (VHE)γ–
astronomy. The main design goal was to achieve a very low (∼30 GeV) trigger threshold in order to bridge the energy gap between the satellite borneγ–detectors and ground-based Cerenkov telescopes of the last decade.
MAGIC was commissioned in 2004 and started first observations in the same year. Emphasis was put on the verification of established sources in order to study the telescope performance in detail [3]. As the MAGIC telescope construction is based on many novel elements, untried up to now, the current analysis is restricted to the energy range above approx. 100 GeV, e.g. to shower images of at least 150–200 photoelectrons. MAGIC has already detected four well-establishedγ-sources, namely the Crab nebula, the AGN Mkn 421 [4], Mkn 501 [1], and 1ES1959+650 [5], and has seen evidence for a few more sources [1].
2. The Crab Nebula
The Crab nebula is the remnant of a supernova explosion that occurred in 1054. In 1989, VHEγemission was reported by the Whipple collaboration [6]. It was the first source detected at TeV energies employing the IACT technique and it exhibits a stable and strongγ-emission. It therefore is frequently used as the “standard candle” in VHEγ-astronomy. The Crab nebula has been observed extensively in the past over a wide range of wavelengths, covering the radio, optical and X-ray bands, as well as high-energy regions up to nearly 100 TeV [7]. Nevertheless, quite some new physics results are expected in the VHE domain, namely the spectrum showing an Inverse Compton (IC) peak close to 100 GeV, a cut-off of the pulsedγ-emission somewhere between 10 and 100 GeV, and the verification of true flux stability down to the percent level. Currently the VHEγ-emission is very well described by electron acceleration followed by the IC scattering of photons generated by synchrotron radiation (SSC model [8]). Probing the presence/absence of a small contribution of VHEγs produced in hadronic interactions is a challenge for experimenters.
2 R. M. Wagner et al.
3. Data Analysis
Data Sample. The data analyzed here were taken during September and October 2004 and in January 2005. A total of 2.8M events in 2004 and 4.5M events from the 2005 observations were used. The analysis is restricted to a sample of low zenith angle observations (ZA<30◦). Quality checks were performed in order to reject runs with unstable trigger rates due to variable atmospheric conditions. The overall observation time of the sample analyzed corresponds to 13 hours on-source.
Calibration, Flatfielding and Event Reconstruction. The camera has been flatfielded and the gains of the PMTs calibrated on a run-by-run basis using a fast UV LED pulser [9]. For obtaining the conversion factor from ADC counts to photoelectrons the excess noise factor method [10] was used. The telescope QE was calculated from the optical parameters of the different components and verified from Muon ring data [11].
After calibration, a cleaning algorithm was applied to the shower images to remove the contribution of the night sky light background, using a cut in the number of photoelectrons per PMT pixel. Finally, the images were parameterized in terms of the well-known Hillas parameters [12].
Rejection of the Hadronic Background. Forγ/hadron separation we used a technique based on the Ran- dom Forest (RF) method [13, 14]. The conceptual difference compared to dynamical or scaled cuts in image parameters is that instead of applying an independent cut to each image parameter, the RF method uses all the parameters simultaneously, taking into account interdependencies and scaling of the image parameters, e.g.
with energy, impact parameter, and zenith angle automatically. Monte Carloγs and real hadronic background data have been used as training samples. The Hillas parametersSize,Dist,Width,Length,ConcandAsymhave been used in the training. The RF method tags each event with the so-called hadronness (h), which is related to the event’s probability to be of hadronic origin. An appropriate cut inhyields a sample retaining most of theγ-candidates while suppressing a large fraction of the hadronic background. Finally, a cut inAlpha, the angle between the shower major axis and the line connecting the shower COG with the source location in the FOV, allows to further suppress background (overall cut efficiency:≈60%). At lower energies the discrim- ination power betweenγs and hadrons degrades, becauseγand hadron images look more and more similar.
In addition, theAlphadistributions broaden, since the shower images contain fewer PMT pixels and thus the reconstruction of the shower direction degrades. The cuts inhandAlphaare therefore chosen as a function of energy. Below 100 GeVγ-background separation becomes more difficult because the Earth’s magnetic field gradually distorts the shower images, the fluctuations of the shower structure increase, more compact and smaller images occur and contributions from cosmic electrons andπ0induced showers from hadronic interac- tions increase where all other secondary particles are below the Cerenkov threshold. All these effects require many more studies for a goodγ-background rejection below 100 GeV. It should also be mentioned that the majority of muon-induced images could easily be rejected, but quantitative numbers are not yet available.
Alpha distribution and Sky Map. In Fig. 1 we show twoAlphadistributions for the data subsample of October 10, 2004, one above aSizeof 360 photoelectrons (ph.e.), yielding a signal of20.4σ/√
h, and a second distribution above a Size of 2000 ph.e. Note that the latterγ-sample is nearly background free. Fig. 2 shows an excess sky map of the corresponding sky region obtained with theDisp–Method [15].
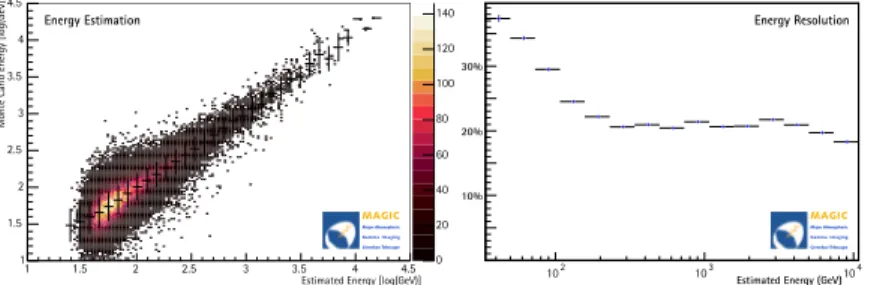
Energy estimation. The recorded light content ofγ-showers with an impact parameter.120m (Dist<1◦) is in first order proportional to the initial energy. In order to estimate the energy of each event, we trained RFs for each energy bin using log(Size),Dist,Width,Length, log(Size/(LengthxWidth)),Conc,Leakage, and the zenith angle. After training, for each event and each energy bin a quantity analogous to the hadronness is computed, yielding the probability of this event being in the respective bin. By weighting all possible energies with these probabilities one gets a continuous energy estimation (cf. fig. 3).
Observations of the Crab nebula with the MAGIC telescope 3
|Alpha| [˚]
0 10 20 30 40 50 60 70 80 90
Counts
0 50 100 150 200 250 300
350 Alpha Plot MAGIC
Major Atmospheric Gamma Imaging Cerenkov Telescope
T = 64 min Zenith Angle = 7-17˚
Significance = 21.10 σ Size > 360 ph. e.
obs Crab Nebula 2004-10-10
|Alpha| [˚]
0 10 20 30 40 50 60 70 80 90
Alpha Plot MAGIC
Major Atmospheric Gamma Imaging Cerenkov Telescope
T = 64 min Zenith Angle = 7-17˚
Significance = 15.99 σ Size > 2000 ph. e.
obs Crab Nebula 2004-10-10
Counts
0 20 40 60 80 100 120
Figure 1.Alphadistribution for 64 minutes of observation time.
RA [˚]
82.8 83 83.2 83.4 83.6 83.8 84 84.2 84.4 84.6
Dec [˚]
21.2 21.4 21.6 21.8 22 22.2 22.4 22.6 22.8 23
0 2 4 6 8 10 12
Counts
MAGIC
Major Atmospheric Gamma Imaging Cerenkov Telescope
Crab Nebula Sky Map, Sept. 21/22, 2004
Figure 2.Disp–Sky map for the Crab nebula.
Estimated Energy [log(GeV)]
1 1.5 2 2.5 3 3.5 4 4.5
Monte Carlo Energy [log(GeV)]
1 1.5 2 2.5 3 3.5 4 4.5
0 20 40 60 80 100 120 Energy Estimation 140
Estimated Energy (GeV) MAGIC
Major Atmospheric Gamma Imaging Cerenkov Telescope
Energy Resolution
10%
20%
30%
102 103 104
MAGIC
Major Atmospheric Gamma Imaging Cerenkov Telescope
Figure 3. Left: Estimated energy vs. true energy, for Monte Carlo events. Right: Energy resolution as a function of (estimated) energy.
Flux stability and Spectrum. For calculating the true energies from the estimated energies, we apply a robust “spillover correction”: We compute the ratio ci = Nγ(Etrue∈Bi)/Nγ(Eestimated∈Bi) for each binBi in estimated energy. When multiplied with the number of excess eventsNi, it yields the numberNitrueof events belonging to the respective bin in true energy. For the final flux calculation the data have to be corrected for various losses, such as for different detector inefficiencies, dead–time effects, atmospheric transmission corrections etc. Still, not all corrections could be taken into account. We estimate the systematic uncertainty in the flux to be≈35%.
Fig. 4 shows the integral flux of the Crab nebula above 200 GeV for the individual days of this analysis. Fig.
5 shows the differential spectrum of the Crab nebula. A power–law fit between 300 and 3000 GeV yielded a spectral index of2.58±0.16. In agreement with expectance, the measured data points below 300 GeV lie below the extrapolated power law.
53260 53270 53280 53290 53300
Time [MJD]
53375 53380 53385 χ²/ndof = 1.06
MAGIC
Major Atmospheric Gamma Imaging Cerenkov Telescope
Crab Nebula
Light Curve, E>200 GeV
-1-2Integral flux (E>200 GeV) [cm s ]
0.1 0.2 0.3 0.4 x10⁻⁹
Figure 4. Integral flux of the Crab nebula for all days considered in this analysis. A fit assuming a constant flux gave a χ2/ndof= 1.06.
4 R. M. Wagner et al.
E [GeV]
102 103 104
]-1 s-2 cm-1 dF/dE [TeV
10-13 10-12 10-11 10-10 10-9 10-8 10-7
HEGRA
Whipple
MAGIC 2005 MAGIC 2004 power law fit
0.16
± -2.58
= (1.50±0.18) 10-3
dE dF
GeV
( )
E[ ]
cm2ph s TeVMAGIC
Major Atmospheric Gamma Imaging Cerenkov Telescope
Crab Nebula ⋅ Differential Spectrum, 5.50 + 7.05 hrs
Figure 5. Observed differential crab spectra for the 2004 and 2005 datasets. We show a power–law fit to the combined data between 300 GeV and 2 TeV as well as the fit to HEGRA data [7] and the parametrization of Whipple data [12].
4. Conclusions
The MAGIC telescope has been taking data since mid 2004. As a first target of observation the Crab nebula was observed to test the gross performance of the telescope. An analysis between 100 and 4000 GeV confirmed expectations and gave good agreement with observations of other groups. We determined an energy resolution of≈20% at energies in the above quoted energy range. Although run–in data were used for this analysis, we observed good flux stability. The next steps in analysis will focus on the region below 100 GeV and on the reduction of the many systematic errors.
Acknowledgments
We would like to thank the Instituto de Astrof´ısica de Canarias for excellent working conditions. The support of the German BMBF and MPG, the Italian INFN and the Spanish CICYT is gratefully acknowledged.
References
[1] R. Mirzoyanet al., these proceedings.
[2] E. Lorenz, New Astron. Rev. 48 (2004) 339.
[3] J. Cortinaet al., these proceedings.
[4] D. Mazinet al., these proceedings.
[5] N. Tonelloet al., these proceedings.
[6] T. Weekeset al., Astrophys. J. 342 (1998) 379.
[7] F. A. Aharonianet al, Astrophys. J. 614 (2004) 897.
[8] O. C. de Jager and A. K. Harding, Astrophys. J. 396 (1992) 161.
[9] M. Gauget al., these proceedings.
[10] T. Schweizeret al., IEEE Trans. Nucl. Sci. 49 (2002) 2497.
[11] F. Goebelet al., these proceedings.
[12] A. M. Hillaset al, Astrophys. J. 503 (1988) 744.
[13] L. Breiman, Machine Learning 45 (2001) 5.
[14] R. K. Bocket al., Nucl. Instr. & Meth. A 516 (2004) 511.
[15] E. Domingo–Santamariaet al., these proceedings.
![Figure 5. Observed differential crab spectra for the 2004 and 2005 datasets. We show a power–law fit to the combined data between 300 GeV and 2 TeV as well as the fit to HEGRA data [7] and the parametrization of Whipple data [12].](https://thumb-eu.123doks.com/thumbv2/1library_info/4003802.1540690/4.892.284.689.130.385/figure-observed-differential-spectra-datasets-combined-parametrization-whipple.webp)
