29th International Cosmic Ray Conference Pune (2005) 00, 101–106
Observations of Mrk 421 with the MAGIC Telescope
D. Mazin
a, J. Flix
, F. Goebel
a, E. Lindfors
b, J. Lopez Munoz
, M. Lopez Moya
d, A. Moralejo
e, V. Scalzotto
e, T. Schweizer
f, and R.M. Wagner
afor the MAGIC Collaboration
(a) Max-Planck-Institut f¨ur Physik, F¨ohringer Ring 6, 80805 M¨unchen, Germany (b) Tuorla Observatory, V¨ais¨al¨antie 20, 21500 Piikki¨o, Finland
(c) Institut de Fisica d’Altes Energies, 08193 Bellaterra (Barcelona), Spain
(d) Universidad Complutense de Madrid, Facultad de Ciencias Fisicas, 28040 Madrid, Spain
(e) Dipartimento di Fisica, Universita di Padova and INFN sez. di Padova, Via Marzolo 8, 35131 Padova, Italy (f) Humboldt Universit¨at zu Berlin, Institut f¨ur Physik, Newtonstraße 15, 12489 Berlin, Germany
Presenter: D. Mazin (mazin@mppmu.mpg.de), ger-mazin-D-abs1-Oral
The AGN Mrk 421 was observed during moderately high flux states between November 2004 and April 2005 with the MAGIC telescope shortly after the end of its commissioning phase. Here we present a combined analysis of a large data sample recorded under different observational conditions. The integrated flux level is observed to vary by more than a factor of 2 on different time scales. The energy spectrum between 100 GeV and 2 TeV is well described by a power-law with a photon index
=2:6independent of the flux level.
1. Introduction
The 17 m diameter MAGIC telescope [1], located on the Canary Island La Palma (2200 m a.s.l.) has completed its commissioning phase in September 2004. The main design goal was to explore the low energy range, eventually down to 30 GeV. The first physics observations in Winter 2004/05 and in Spring 2005 included observations of the well established TeV blazar Mrk 421. In total, 19 nights of data have been taken on this source, the observation times per night ranging from 30 minutes to 4 hours.
Mrk 421 is the closest known TeV blazar (redshift
z= 0.031). It was the first extragalactic
-ray source discovered in the TeV energy range using Imaging Air Cherenkov Telescopes [2, 3]. Mrk 421 is the source with the fastest observed flux variations reported among TeV
-ray emitters, with variations up to one order of magnitude and occasional flux doubling times as short as 15 min [4]. Variations in the hardness of the TeV
-ray spectrum during flares have been reported in [5, 6]. Simultaneous observations in the X-ray and GeV- TeV bands show a significant correlation of the fluxes. This supports the hypothesis that the same population of electrons generates X-ray photons via synchrotron radiation and GeV-TeV photons via inverse-Compton scattering.
2. Data sample
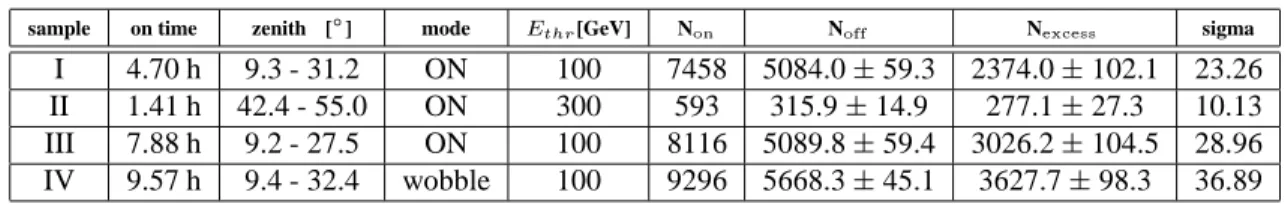
The data taken on Mrk 421 between November 2004 and April 2005 was divided into 4 samples. Due to
changes in the hardware the data before and after February 2005 were treated separately. Most of the data
was taken at small zenith angles (
ZA < 30Æ), resulting in a low analysis energy threshold. Only 1.5 h in
December 2005 were taken at
42Æ<ZA<55Æduring simultaneous observations with the H.E.S.S. telescope
system [7]. The standard operation mode for MAGIC is the ON-observation, where the source is in the center
of the camera. In April 2005 part of the data was taken in wobble mode. In this mode the source is tracked
alternately in two opposite positions 0.4
Æoff the center. The definition of the 4 data samples is summarized in
2 D. Mazin et al.
sample on time zenith [Æ] mode Ethr[GeV] Non Noff Nexess sigma
I 4.70 h 9.3 - 31.2 ON 100 7458 5084.0
59.3 2374.0
102.1 23.26
II 1.41 h 42.4 - 55.0 ON 300 593 315.9
14.9 277.1
27.3 10.13
III 7.88 h 9.2 - 27.5 ON 100 8116 5089.8
59.4 3026.2
104.5 28.96 IV 9.57 h 9.4 - 32.4 wobble 100 9296 5668.3
45.1 3627.7
98.3 36.89 Table 1. Results of the Mrk 421 data. Samples I+II were recorded in November 2004 - January 2005, while Samples III+IV were taken in April 2005
Table 1. For each data sample a separate Monte-Carlo sample was simulated taking into account the particular observation conditions.
The full data set consists of 29.0 hours. Runs with problems in the hardware or unusual trigger rates have been rejected in order to ensure a stable performance and good atmospheric conditions. The total observation time amounts to 23.2 h after cuts.
3. Analysis
For calibration, image cleaning, cut optimization and energy reconstruction the standard analysis techniques of the MAGIC telescope were applied (see [9]). For the
/hadron separation a multidimensional classification technique based on the Random Forest method [10] was used, with classical Hillas parameters [11] like
Width,
Length
and
Sizebut excluding
Alphaas input parameters.
For the ON-mode data the remaining background was estimated by performing a second order polynomial fit to the
Alphadistribution (see Fig. 1) in the range between 30
Æand 90
Æ, where no
events were expected.
The signal was then determined as the number of observed events in the range
Alpha<0exceeding the fit extrapolated to small
Alpha, where
0is energy dependent and has a typical value of 12
Æ. For the wobble- mode data the image parameters were calculated both with respect to the position of the source (ON) and with respect to an OFF position on the opposite side of the camera. The background was then estimated comparing the two
Alphadistributions. In order to avoid an unwanted contribution of
-events in the OFF sample an anti
Alphacut was applied viz.
-candidates (i.e.
Alpha<0) from the ON sample were excluded from the OFF sample and vice versa.
The energy spectra were obtained using spillover correction factors to compensate for instrumental effects.
This analysis aims at producing solid results above 100 GeV. The lower energy regime requires additional studies especially concerning the background rejection.
4. Results
During the whole observation period Mrk 421 was found to be in a moderate to high flux state resulting in clear signals in all four data samples. Fig. 1 shows the
Alphadistribution of the
-candidates of the combined samples I and III with an energy threshold of 200 GeV. An excess of 2100 events was found, which corre- sponds, for the given background, to more than 40 standard deviations. The number of excess events and the significances for the individual samples are summarized in Table 1. Fig. 2 shows a sky map produced with the DISP method [12] using sample IV after applying the same cuts as for the
Alphadistribution.
The integral fluxes above 300 GeV averaged over each night of observation are shown in the upper part of
Observations of Mrk 421 with the MAGIC Telescope 3
°]
|alpha| [ 0 10 20 30 40 50 60 70 80 90
events
0 200 400 600 800 1000 1200 1400 1600
Markarian 421 (z=0.030) 2004/2005
observation time: 13.6 h mean zenith angle: 23 deg
analysis threshold: ~200 GeV 50.9
± number of excess events: 2098
σ significance: 41.22
Figure 1.
Al phadistribution for the combined data samples I+II+III with
E>200GeV.
DEC [deg]
36.5 37 37.5 38 38.5 39 39.5 40
RA [h]
10.95 11 11.05 11.1 11.15 11.2
Figure 2. Sky map of Mrk 421 using the DISP method [12].
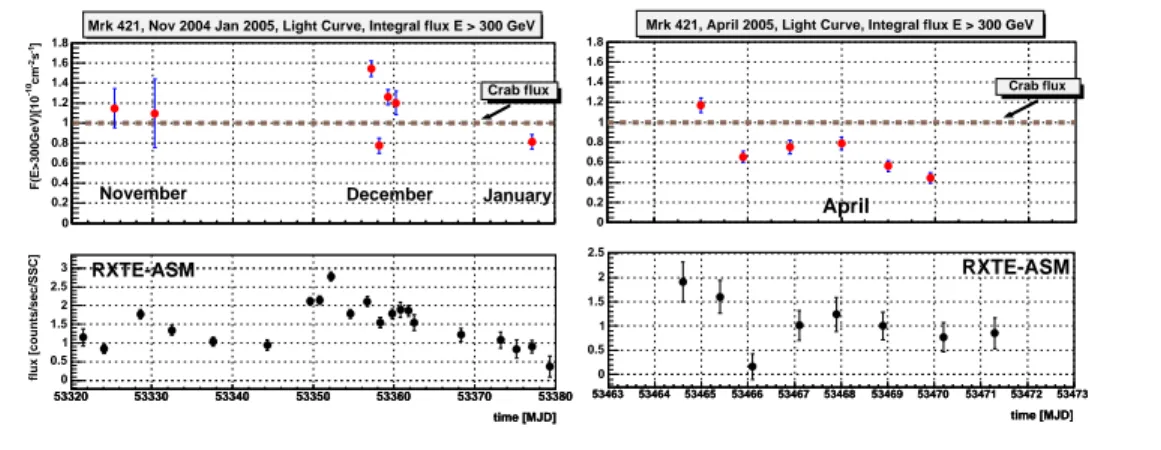
Fig. 3. Significant variations of up to a factor of 3 can be seen. In order to avoid systematic effects resulting from different observation conditions the light-curve was produced using only samples I and III. The relatively high energy threshold of 300 GeV ensures that the results are independent of the actual thresholds during each night. In the lower part of Fig. 3 the corresponding flux in the X-ray band as observed by the ASM detector [8]
on-board the RXTE satellite are shown for the analyzed observation period. Particularly for the April data a clear correlation between the X-ray and the GeV-TeV
-ray activity can be observed.
]-1s-2cm-10F(E>300GeV)[10
0 0.2 0.4 0.6 0.8 1 1.2 1.4 1.6 1.8
Mrk 421, Nov 2004 Jan 2005, Light Curve, Integral flux E > 300 GeV
Crab flux
November December January
0 0.2 0.4 0.6 0.8 1 1.2 1.4 1.6 1.8
Mrk 421, April 2005, Light Curve, Integral flux E > 300 GeV
Crab flux
April
time [MJD]
53320 53330 53340 53350 53360 53370 53380
time [MJD]
53320 53330 53340 53350 53360 53370 53380
flux [counts/sec/SSC] 0 0.5 1 1.5 2 2.5
3 RXTE-ASM
time [MJD]
53463 53464 53465 53466 53467 53468 53469 53470 53471 53472 53473 time [MJD]
53463 53464 53465 53466 53467 53468 53469 53470 53471 53472 53473 0
0.5 1 1.5 2 2.5
RXTE-ASM
Figure 3. Light curve of Mrk 421 between November 2004 and April 2005 above 300 GeV (upper plots) and the corre- sponding X-ray flux as observd by ASM.
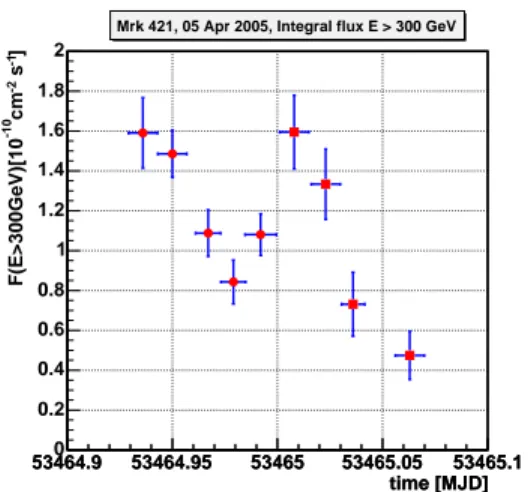
For the day of highest activity in April the intra-night variability is shown in Fig. 4 in bins of 20 minutes. In order to extend the time coverage as much as possible data sample III (before midnight) and sample IV (after midnight) have been combined. The observation suggests doubling times of less than 1 h.
For the spectrum calculation the data taken between December 2004 and April 2005 (samples I+III only) have
been divided into a high and a low flux state (highest 4 and lowest 7 nights in Fig. 3). The corresponding
4 D. Mazin et al.
time [MJD]
53464.9 53464.95 53465 53465.05 53465.1 time [MJD]
53464.9 53464.95 53465 53465.05 53465.1 ]-1 s-2cm-10 F(E>300GeV)[10
0 0.2 0.4 0.6 0.8 1 1.2 1.4 1.6 1.8 2
Mrk 421, 05 Apr 2005, Integral flux E > 300 GeV
Figure 4. Light-curve for the night MJD 53465 in bins of 20 minutes (sample III: circles, sample IV: squares)
Energy [GeV]
102 103
]-1 s-2 cm-1dN/dE [TeV
10-13
10-12
10-11
10-10
10-9
10-8 High state
Low state Mrk 421, November 2004 - April 2005
Figure 5. Differential energy distribution for Mrk 421 for high and low flux samples as described in the text.
energy spectra (see Fig. 5) have been fitted with a power-law (d
N/d
E=N0(E=
TeV
)) in the energy range between 100 GeV and 2 TeV yielding
=2:610:05(stat:)for the low flux sample in good agreement with
=2:650:06(stat:)