FIRST OBSERVATIONS OF THE AGN 1ES1959+650 WITH THE MAGIC TELESCOPE AND COMPARISON WITH THE CRAB NEBULA AT 40◦ ZA
N. TONELLO, on behalf of the MAGIC collaboration Max-Planck-Institut f¨ur Physik,
D-80805 M¨unchen, Germany
The AGN 1ES1959+650 has been observed with the MAGIC Cherenkov telescope for few hours during September and October 2004. At that time the source showed low activity in optical and X-rays wavelength domain. Observations have been performed at relatively high zenith angle (40◦) alternating with observations of the TeV standard candle, the Crab Nebula.
The two sources have been analyzed simultaneously such to have a direct flux comparison.
Here we present the preliminary results of the data analysis. A detection of gamma-ray emission of 1ES1959 with∼7σsignificance will be reported, as well as an attempt to derive the spectral features of the AGN. A coarse integral flux estimate yielded a value around 11%
of the Crab flux above 300 GeV.
1 Introduction
1.1 The VHE gamma-ray source 1ES1959+650
The Active Galactic Nucleus (AGN) 1ES1959+650 is hosted by an elliptical galaxy at a redshift distance of z = 0.047, comparable to (but higher than) the well-known AGNs Mkn 421 (z=0.031) and Mkn 501(z= 0.034). The first detection of a signal in VHE gamma-rays from 1ES1959+650 was reported in 1998 by the Seven Telescope Array in Utah, with a 3.9 σ significance1. After that first detection, other collaborations started observing the source, but it appeared to be weak both in gamma-rays and in X-rays. The HEGRA collaboration reported only a marginal signal form measurements until early 20026.
In May 2002, the X-ray emissions of the source had increased. Both the Whipple3 and HEGRA7 collaborations then confirmed higher VHE gamma-ray emission with well over 5 σ significance.
Further periods of high gamma-ray activity followed in the same year. The most interesting aspect of the flaring activities in 2002 was the observation of a so-called orphan flare recorded in
June with the Whipple telescope4,5, also seen by HEGRA. The name oforphan flarewas chosen because of the absence of high activity in X-rays in the same time interval. The absence of a significant X-ray activity could naturally be explained by the absence of electron acceleration and inverse Compton scattering as production mechanism for VHE gamma-rays. The models regarding the acceleration of a hadronic component in the 1ES1959 jet (see for example10) induced us to look also for neutrino emissions coming from the source, with southern hemisphere neutrino telescopes. No claim of any detection has been made yet by the AMANDA collaboration
a. The absence of neutrino detection, however, can not rule out the hadronic model used to explain the gamma-ray emission, the predicted neutrino flux being below the sensitivity of present neutrino detectors12.
1.2 The observational technique and the MAGIC Cherenkov telescope
VHE gamma-rays or charged CR particles, upon impact at the top layers of the atmosphere, pro- duce so-called extended air showers. The fast charged particles of the shower produce Cherenkov light, showing up as a flash of a few ns duration at ground over a disc of typically 200 m di- ameter. If the telescope, aligned with the source, is located inside the Cherenkov light pool, a shower image is recorded and digitized. The image shape is different for showers induced by hadrons and electromagnetic particles, and thus permits to discriminate, in most cases, between showers initiated by charged cosmic rays and by gamma-rays. Typically, the image is described by several typical parameters, among them the so-called Hillas parameters described in13, i.e.
WIDTH , LENGTH, SIZE (in number of photons entering the camera, to first order propor- tional to the energy), DIST (distance from the image center of gravity to the source position in the camera, to first order proportional to the impact parameter), and ALPHA (angle between the image major axis and the source direction). These and other image parameters are used to reconstruct also the arrival direction and the energy of the original gamma-ray.
MAGIC is a new generation imaging Cherenkov telescope (IACT) for gamma-ray astronomy.
With its∼240 m2 of mirror surface it has the largest reflector and lowest threshold worldwide.
The MAGIC telescope is located in the Canary Island of La Palma (28.2◦N, 17.8◦W, 2225 m asl). From this location, 1ES1959 is visible from May to October under a zenith angle of 36◦ at culmination. The MAGIC camera comprises 576 hemispherical PMTs with specially shaped light collectors and diffuse lacquer coating for enhanced quantum efficiency. The camera has a field of view (FOV) of 3.5◦.
The design of MAGIC has been optimized to achieve a low energy trigger threshold (down to 30 GeV at zenith), never reached with previous IACTs for the study of faint VHE gamma-ray sources such as pulsars, medium redshift AGNs, etc.
2 Analysis of the recorded data
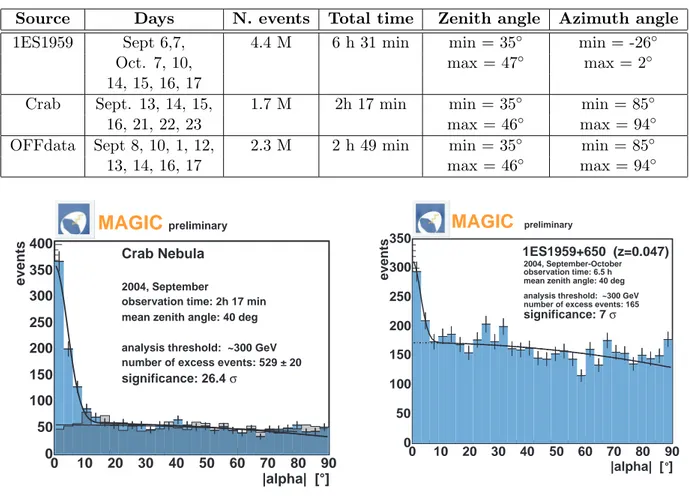
Table 1 shows the summary of the data collected from 1ES1959 and Crab for the present analysis.
Generally, the Crab Nebula with its very stable flux is considered as the standard candle for VHE gamma-ray astronomy. For that reason, Crab data observed in MAGIC have been selected to match the same telescope operation conditions (in time and zenith angle) as for the observation of 1ES1959. So called OFF-source data are collected by pointing the telescope to a sky section near the source, where no gamma-ray signal is expected in the FOV. These data are used as crosscheck of the recorded cosmic ray background.
aNote added during writing: At the recent Cherenkov 2005 meeting at Palaiseau the AMANDA group did report the observation of two neutrino events coinciding with 1ES1959 flares. One neutrino event is coincident with the orphan flare11.
Table 1: Statistics of the raw data analyzed.
Source Days N. events Total time Zenith angle Azimuth angle 1ES1959 Sept 6,7, 4.4 M 6 h 31 min min = 35◦ min = -26◦
Oct. 7, 10, max = 47◦ max = 2◦
14, 15, 16, 17
Crab Sept. 13, 14, 15, 1.7 M 2h 17 min min = 35◦ min = 85◦
16, 21, 22, 23 max = 46◦ max = 94◦
OFFdata Sept 8, 10, 1, 12, 2.3 M 2 h 49 min min = 35◦ min = 85◦
13, 14, 16, 17 max = 46◦ max = 94◦
]
|alpha| [°
0 10 20 30 40 50 60 70 80 90
events
0 50 100 150 200 250 300 350
400 Crab Nebula
2004, September
observation time: 2h 17 min mean zenith angle: 40 deg
analysis threshold: ~300 GeV number of excess events: 529 ± 20
σ significance: 26.4
MAGIC preliminary
]
|alpha| [ 0 10 20 30 40 50 60 70 80 90
events
0 50 100 150 200 250 300 350
1ES1959+650 (z=0.047)
2004, September-October observation time: 6.5 h mean zenith angle: 40 deg analysis threshold: ~300 GeV number of excess events: 165
σ significance: 7
MAGIC preliminary
°
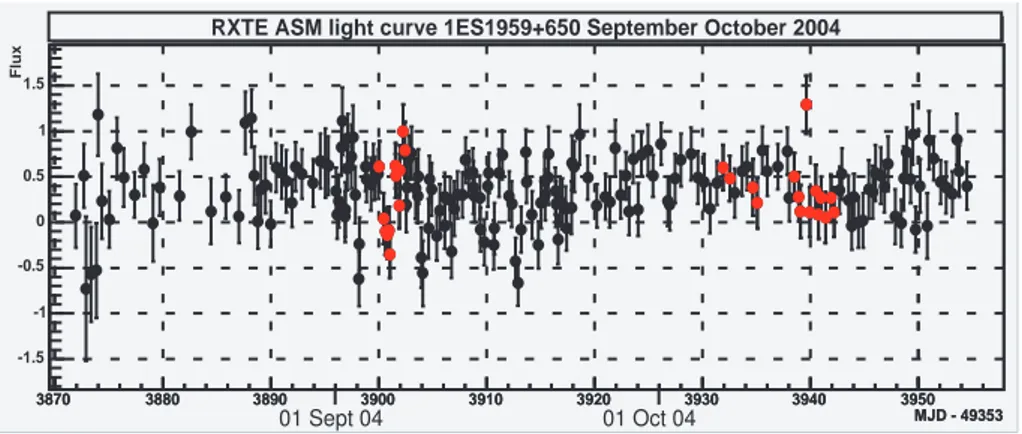
Figure 1: ALPHA plots of Crab (OFF data plot superimposed) and 1ES1959 after parameter cuts.
After quality cuts,∼6.5 hours of observation data from 1ES1959 were analyzed. The optimal subspace of image parameters for the gamma-hadron separation (parameter cuts) have been obtained using Monte Carlo data, and the cut values were ’trained’ to obtain a signal with the maximum significance from ∼2 hours of Crab Nebula data observed at the same zenith angle.
These optimized cuts have been applied to the entire 1ES1959 data sample, without any further optimization. Finally, these data were cut at ∼10◦ in the ALPHA parameter, thus selecting only showers that point to towards the source position. From the ALPHA plot we derive the significance of the signal, according to14, formula 17.
3 Results
3.1 Alpha plot and comparison with Crab
In figure 1 (left) we show the distribution of the image parameter ALPHA for the Crab Neb- ula together with the normalized distribution of the OFF-data, after a selection of events with SIZE>2000 photons (energy threshold∼300 GeV). In the right diagram, the ALPHA distribu- tion of the 1ES1959 data sample is shown, after the same parameter cuts.
The significance of the 1ES1959 detection is 7σ, with 165 excess events in∼6.5 hours, while the signal from Crab Nebula corresponds to∼26 sigma and 529 excess events in∼2.25 hours for the same analysis. Due to the lack of precise Monte Carlo simulations of the effective collection area (not all telescope parameters were precisely calibrated and were also subject to changes
during the commissioning phase), it is not possible to quote a precise flux estimate. A coarse estimate yields a flux of 0.11 crab units. Using the published Crab flux8,9 and extrapolating with the same power law coefficient to 300 GeV we got an integral VHE gamma-ray flux from 1ES1959 above 300 GeV of ∼1.15±0.30 photons cm−2 s−1 in the ’low state’. The systematic error is at least 25%.
3.2 The light curve
Table 2: Results of the time analysis of 1ES1959 data.
Days Obs. time Significance Excess events Rate (phot/min)
Sept 6,7 121 min 3.6σ 42.8 ±11.8 0.35 ±0.09
Oct. 7, 10,15 110 min 4.0σ 49.5 ±12.5 0.45 ±0.11
Oct. 16,17 137 min 5.0σ 64.0 ±12.8 0.46 ±0.09
AGNs emit normally VHE gamma-rays during high flaring activities. With 6 hours obser- vation time, only modest tests of the flux variation are possible. The data sample of 1ES1959 has been subdivided into 3 sub-samples of∼2 hours each, one sample in September and two in October. The results, presented in Table 2, did not show any significant flux differences during these 3 periods, indicating that the source was in the same state during the time covered by our observation.
3.3 Comparison with simultaneous observations at other wavelengths
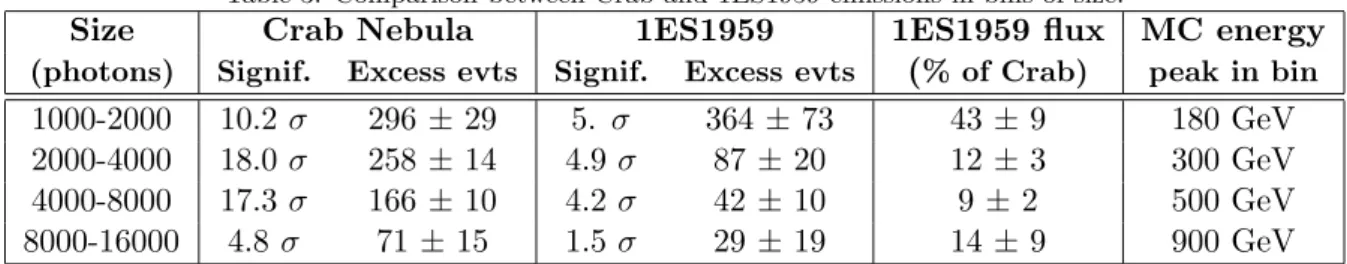
MJD - 49353
3870 3880 3890 3900 3910 3920 3930 3940 3950
MJD - 49353
3870 3880 3890 3900 3910 3920 3930 3940 3950
Flux
-1.5 -1 -0.5 0 0.5 1 1.5
RXTE ASM light curve 1ES1959+650 September October 2004
01 Sept 04 01 Oct 04
Figure 2: Light curve in X-rays for 1ES1959+650 during the months of September and October 2004. The points marked in red are the ones recorded during the gamma-rays observations with MAGIC.
A strong gamma-ray emission from an AGN leads to the question whether the source was active in other wavelengths. In case of electron acceleration and the validity of the Syn- chrotron Self Compton model (see for example15,16) one should also observe significant ac- tivity in the X-ray domain and, in turn, time correlations of the fluxes, a case normally seen in other gamma-ray emitting AGNs. Figures 2 and 3 show the light curves of 1ES1959 in the X-ray and optical domain, based on published RXTE-ASM X-ray flux data (http : //heasarc.gsf c.nasa.gov/xte weather/), while the optical light curve were provided by the Tuorla Observatory Blazar Monitoring Program (http : //users.utu.f i/kani/1m/1ES1959 + 650.html). No strong activity in X-ray or optical has been observed during the period of our VHE gamma-ray studies. This and the absence of significant time variability leads to the con- clusion that the reported VHE gamma-ray emission of 1ES 1959 does not follow the pattern
Figure 3: In red: light curve in optical for 1ES1959+650 from July 2002 to January 2005. The luminosity of a reference star is reported in green. During the gamma-rays observations with MAGIC (Sept-Oct 04, inside the
rectangle) the optical activity was particularly low.
observed in other AGNs. The short observation period and the still rather large errors do not allow us to conclude if the VHE emission is really due to hadronic production or not linked to the jet activities in the AGNs. It is of utmost importance to monitor the source also by future large neutrino observatories and clarify if 1ES 1959 is indeed also an efficient hadron accelerator.
3.4 A first attempt to study the VHE spectrum and comparison with the Crab spectrum
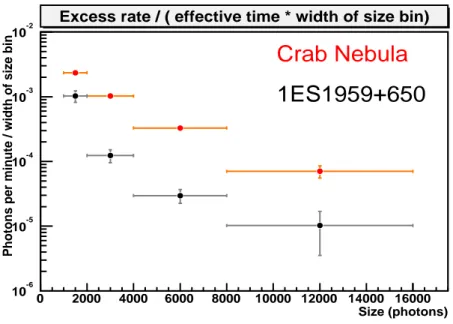
Table 3: Comparison between Crab and 1ES1959 emissions in bins of size.
Size Crab Nebula 1ES1959 1ES1959 flux MC energy (photons) Signif. Excess evts Signif. Excess evts (% of Crab) peak in bin
1000-2000 10.2σ 296 ±29 5. σ 364± 73 43 ±9 180 GeV
2000-4000 18.0σ 258 ±14 4.9 σ 87 ±20 12 ±3 300 GeV
4000-8000 17.3σ 166 ±10 4.2 σ 42 ±10 9 ±2 500 GeV
8000-16000 4.8σ 71 ±15 1.5 σ 29 ±19 14 ±9 900 GeV
As pointed out previously, these data were taken during the commissioning phase of MAGIC, when detector parameters were still slightly changed or not fully known. Correspondingly, also the Monte Carlo simulations have not yet reached the desirable precision. It is, therefore, not possible to calculate fluxes or spectra to the precision a fully understood detector will permit.
For the spectral flux determination, we used a simple approach of comparing the spectrum of 1ES1959 with that of the Crab nebula, which has been measured by many experiments from data above 400 to 500 GeV, and with MAGIC down to 70 GeV. For this comparison, we binned both the 1ES1959 and Crab data as a function of the SIZE parameter, which is a good estimator of the energy (restricting to DIST parameters between 0.3◦ to 1.2◦). For each SIZE bin of the Crab Nebula and 1ES1959, we computed the number of excess events, as reported in Table 3.
The corresponding approximate energy of each bin has been estimated using MC gamma-rays in the same range of SIZE and assuming a spectral slope of 2.7. The mean energy per SIZE bin does not significantly depend on the spectral slope.
The comparison of the data in figure 4 takes into account also the observation time, and permits a comparison of the relative flux of 1ES1959 with respect to the Crab (note that only statistical errors are shown). There is strong evidence that the spectrum of the AGN is steeper than that of the Crab in the same energy range. In the first SIZE bin, 1ES1959 is at ∼40% of the Crab level, while at larger size events, i.e at higher energies, the flux drops to∼10-14% Crab.
Size (photons) 0 2000 4000 6000 8000 10000 12000 14000 16000
Photons per minute / width of size bin
10-6 10-5 10-4 10-3 10-2
Excess rate / ( effective time * width of size bin)
Crab Nebula 1ES1959+650
Figure 4: Comparison of differential flux between Crab Nebula and 1ES1959, the horizontal bar notes the size bin. No acceptance correction has been applied.
This observation is not in contradiction with the results of the HEGRA System measurement of the gamma-ray emissions of 1ES1959 in its steady state (but in a different energy range)7. However, our results are still preliminary, a full spectral analysis will be published later.
4 Conclusions
The AGN 1ES1959 has been detected with the MAGIC telescope after few hours of observation in September - October 2004. During that period the AGN was in quiescent state both in X-rays and at optical wavelengths. In the same period Crab Nebula and OFF data have been recorded under the same observational conditions. The mean zenith angle of such observations is 40◦ degrees, with a minimum of 36◦. Cuts for the gamma/hadron separation were optimized using Crab Nebula data and then applied to the 1ES1959 data sample. For a lower energy cut of 300 GeV, the preliminary results yielded a VHE gamma-ray signal from 1ES1959 with a significance of 7σ.
A crude variability analysis has been carried out. No variation of activity in gamma-ray flux could be detected. A simple flux comparison with Crab in different size (energy) bins indicates that 1ES1959 drops from ∼40% at around 350 GeV to ∼10% Crab flux at around 1 TeV. The full spectral analysis is in progress and will be presented in a later publication.
The lack of strong time variability, the presence of a significant VHE gamma-ray emission in the absence of a strong X-ray and optical emission can naturally be explained by a dominant hadronic production of the VHE gamma-rays. This experimental result can be seen as another confirmation of the conclusion that the so-called orphan flare seen in 2002 is a real effect.
The short observation time and the limited knowledge of the telescope parameters during the commissioning phase do not permit to make solid conclusions and more data are needed to lend support to the interpretation that 1ES1959 is (also) a powerful hadronic accelerator.
Acknowledgments
We would like to thank the IAC for the excellent working conditions on the La Palma Ob- servatory Roque de los Muchachos. The ASM results were obtained through the High Energy
Astrophysics Science Archival Research Center Online Service, provided by the NASA/Goddard Space Flight Center.
References
1. Nishiyama et al., the Utah Seven Telescope Array coll., Detection of a new TeV gamma- ray source of BL Lac object 1ES1959+650, in AIP Conf. Proc., 516, Proc. 26th ICRC, ed B.Dingus, D.B. Kieda, M. H. Salamon (Melville:AIP)370 (OG.2.1.21) (2002)
2. T.Weekes et al., 1ES1959+650, In Central Bureau for Astronomical Telegrams, INTER- NATIONAL ASTRONOMICAL UNION, Circular No. 7903, 17 May 2002
3. J. Holder et al., 2003 ApJ, 583, 9
4. H. Krawczynski et al., 2004, Astrophys.J. 601, 151-164
5. M. K. Daniel, for the VERITAS collaboration, Spectrum of Very High Energy Gamma- Rays from the blazar 1ES1959+650 during Flaring Activity in 2002, Astrophys.J. 621 (2005) 181
6. D. Horns et al., Observation of 1ES1959+650 with the HEGRA System of Imaging Air Cherenkov telescopes, contr. to International Symposium Tokio, 2002
7. F. Aharonian et al., A&A, 406, L9 (2003) 8. F.Aharonian et al, ApJ 614 (2004) 897-913 9. A.M.Hillas et al, ApJ 503 (1988) 744
10. M. Boettcher, A Hadronic Synchrotron Model for the ”orphan” TeV flare in 1ES 1959+650, astro-ph/0411248, accepted for pubblication in The Astrophysical Journal
11. E. Bernardini for the AMANDA/IceCube Collaboration, Presentation at Toward a Net- work of Atmospheric Cherenkov Detectors VII April 27-29, 2005, Ecole Polytechnique, Palaiseau (France), in press.
12. F. Halzen and D. Hooper, High Energy Neutrinos from the TeV Blazar 1ES 1959+650, astro-ph/0502449
13. A. Hillas, ”Cherenkov light images of EAS produced by primary gamma”, in NASA, Goddard Space Flight Center 19th International Cosmic Ray Conference, Vol 3, 445-448, August 1985
14. Li and Ma, Astroph. Journ. 272 (1983) 314-324
15. H. Krawczynski, 2003,http://jelley.wustl.edu/multiwave 16. S.Inoue and F. Takahara, 1996, ApJ, 463, 555