Broad-band study of selected Gamma-ray active blazars
INAUGURAL-DISSERTATION
zur
Erlangung des Doktorgrades
der Mathematisch-Naturwissenschaftlichen Fakult¨at der Universit¨at zu K¨oln
vorgelegt von
Bindu Rani
aus Mukandpur Jhajjar Haryana, India
K¨ oln 2014
Berichterstatter: Prof. Dr. J. Anton Zensus Prof. Dr. Andreas Eckart
Tag der letzten m¨ undlichen Pr¨ ufung: 24.01.2014
Abstract
The analysis presented in this thesis is aimed to provide a more detailed under- standing of the relation between flux density outbursts seen at radio, optical, and γ-ray frequencies and the subsequent structural variability as seen by VLBI. Setting tighter observational constraints on parameters required for the synchrotron self-Compton and inverse-Compton modeling of the high-energy radiation is the prime target. A special attention is given to the parsec scale jet kinematics of the BL Lac object S5 0716+714 using mm-VLBI with an angular resolution up to ∼50 µas. The aim of the broad-band variability study reported in this thesis is to provide a general physical scenario, which allows to put the observed variation of the source across several decades of frequencies in a coherent context.
The densely sampled multi-frequency observations of S5 0716+714 over the past 5 years allow us to study its broad-band flaring behavior from radio to γ-rays and probe into the physical processes, location and size of the emission regions for the source, which is ultra-compact and known to be one of the fastest variable blazars. The combination of the broad-band variability characteristics with the VLBI measurements provides new insights into the core region and at the jet base, a view which was not possible in earlier studies at lower VLBI observing frequencies. More explicitly, the correlation of the γ-ray flaring activity with the emission at optical to radio frequencies is investigated focusing on some prominent flares observed between April 2007 and April 2012. The time evolution of radio (cm and mm) spectra is tested in the context of a standard shock-in-jet model. The broad-band spectral energy distribution (SED) of the source is investigated using a one-zone synchrotron self-Compton (SSC) model and also with a hybrid model, which involves a SSC and an external Compton (EC) component.
The intense optical monitoring of the source reveals fast quasi-periodic variations
superimposed on a long-term variability trend at a time scale of ∼360 days. Episodes
of fast variability recur on time scales of ∼60–70 days. The prominent and simultane-
ous flaring activity at optical and γ-ray frequencies favors the SSC mechanism for the
production of the high-energy emission. The high-energy (γ-ray – optical) flares prop-
agate down to radio frequencies with a time delay of ∼65 days following a power-law
dependence in frequency with a slope ∼0.3. This indicates that the internal opacity
effects play a key role in producing time delays among light curves at optically thin
and thick wavelengths. The evolution of the radio flares agrees with the formation of
a shock and its propagation with a contribution of geometrical variation in addition to intrinsic variations in the jet.
The broad-band spectral energy distributions (SEDs) of the source during different flaring episodes can not be well described by a pure one-zone SSC model, and require an additional EC contribution from the external radiation field, which is dominated by Ly-α emission from the broad-line region (BLR). A detailed investigation of the high-energy spectrum supports the view that the BLR has a significant impact on the observed γ-ray spectral breaks at a few GeVs, due to pair production. The energy density of this external radiation field varies between 10
−6to 10
−5erg cm
−3, which is a factor of ∼1000 lower than what is expected for a typical quasar, and is a reasonable value for a gas poor (emission line-free) BL Lac object like S5 0716+714.
High-frequency VLBI observations revealed a standing feature observed at ∼0.1 milli-
arcsecond separation from the core. Further downstream, the individual component
motion indicates jet acceleration. Curved trajectories in the component motion, vari-
ations in the jet ridge line, and a position angle swing at the base of the jet are all
consistent with the helical jet model, in which the ejected components transport an-
gular momentum away from the central engine. The observed correlation of the core
flux with the single dish radio flux light curves and the concurrent variations in the
inner jet position angle with high-energy (optical/γ-ray) flux suggests that the high-
energy emission is coming from a region, which is located inside the mm-VLBI core, so
upstream to the τ =1 surface on scales <0.27 parsec towards the central black hole.
Zusammenfassung
Mit der in dieser Dissertation pr¨asentierten Analyse wird ein besseres Verst¨andnis der Beziehung zwischen Flussdichteausbr¨uchen im Radio-, optischen und Gammastrah- lungsbereich und den darauffolgenden, mit VLBI gesehenen, strukturellen Ver¨ande- rungen angestrebt. Das Prim¨arziel ist st¨arkere, durch Beobachtungen gewonnene Ein- schr¨ankungen f¨ur Parameter zu setzen, die f¨ur die Synchrotron-Selbst-Compton- und die inverse Compton-Modellierung der Hochenergiestrahlung ben¨otigt werden. Beson- dere Aufmerksamkeit gilt der Kinematik des Jets des BL Lac-Objekts S5 0716+714 auf Gr¨oßenskalen von Parsecs unter Verwendung von mm-VLBI mit einer Winkelaufl¨osung von bis zu ∼50 µas. Ziel der hier pr¨asentierten Studie der Breitbandvariabilit¨at ist ein allgemeines physikalisches Szenario zu erhalten, in dem die beobachteten Variationen der Quelle ¨uber zahlreiche Gr¨oßenordnungen von Frequenzen in einen schl¨ussigen Zu- sammenhang gebracht werden.
Die Multifrequenz-Beobachtungen von S5 0716+714 in kurzen zeitlichen Abst¨anden uber 5 Jahre erm¨oglichen uns den Verlauf der Breitband-Strahlungsausbr¨uche vom Ra- ¨ diobereich bis zur Gammastrahlung zu studieren. Weiterhin k¨onnen damit die physi- kalischen Prozesse, die Position und die Gr¨oße der Emissionsregion in dieser Quelle – die ultra-kompakt und als einer der Blazare mit der schnellsten Variabilit¨at bekannt ist – erforscht werden. Die Kombination von Eigenschaften der Breitbandvariabilit¨at mit VLBI-Messungen liefert neue Einblicke in die Kernregion und den Entstehungsbe- reich des Jets; einen Einblick, der in fr¨uheren Studien bei niedrigeren Beobachtungsfre- quenz nicht m¨oglich war. Die Korrelation zwischen Gammastrahlungsausbr¨uchen und der Emission vom Radio- bis zum optischen Bereich wird untersucht, insbesondere die auff¨alligsten Ausbr¨uche, die zwischen April 2007 und April 2012 beobachtet wurden.
Die zeitliche Entwicklung der Radiospektren (cm und mm Wellenl¨angen) werden im Kontext des standardm¨aßigen “Schock-in-Jet”-Modells getestet. Die spektrale Energie- verteilung (SED) der Quelle wird mit einen Synchrotron-Selbst-Compton-Modell (SSC) mit einer Emissionszone sowie mit einengemischten Modell, das SSC und einen externen Comptonbeitrag beinhaltet, untersucht.
Das intensive optische Beobachtungsprogramm der Quelle zeigt schnelle quasi-periodi-
sche Variationen, die mit einem Langzeit-Variabilit¨atstrend auf Zeitskalen von ∼360 Ta-
gen ¨uberlagert sind. Phasen mit schneller Variabilit¨at wiederholen sich auf Zeitskalen
von ∼60–70 Tagen. Die starke und simultane Aktivit¨at im optischen und im Gamma-
strahlungsbereich spricht f¨ur den SSC-Mechanismus als Quelle der Hochenergieemission.
Die Hochenergieausbr¨uche (Gammastrahlung – optischer Bereich) pflanzen sich mit Zeitverz¨ogerung von ∼65 Tagen bis in den Radiobereich fort. Die Verz¨ogerung ist fre- quenzabh¨angig und folgt einem Potenzgesetz mit einem Exponent von ∼0.3. Dies deutet darauf hin, dass interne Opazit¨atseffekte eine Schl¨usselrolle bei der Entstehung der Zeit- verz¨ogerung zwischen Lichtkurven bei verschiedenen Wellenl¨angen spielen. Die zeitliche Entwicklung der Ausbr¨uche im Radiobereich ist konsistent mit der Entstehung eines Schocks und dessen Ausbreitung mit einem Beitrag von geometrischen Ver¨anderungen zus¨atzlich zu intrinsischen Variationen im Jet.
Die Breitband-SED der Quelle kann w¨ahrend verschiedener Zeitr¨aumen mit Strah- lungsausbr¨uchen nicht gut durch ein reines SSC-Modell mit nur einer Emissionszo- ne beschrieben werden, sondern ben¨otigt einen zus¨atzlichen externen Comptonbeitrag, wobei das externe Strahlungsfeld durch Ly-α-Emission der Broad-Line-Region (BLR) dominiert wird. Eine detaillierte Untersuchung des Hochenergiespektrums spricht daf¨ur, dass die BLR, aufgrund von Paarerzeugung, einen starken Einfluss auf den beobachte- ten Knick im Gammastrahlenspektrum bei einigen wenigen GeV hat. Die Energiedichte dieses externen Strahlungsfelds variiert zwischen 10
−6und 10
−5erg cm
−3. Das ist um einen Faktor ∼1000 niedriger als f¨ur einen typischen Quasar erwartet, aber es ist ein plausibler Wert f¨ur ein BL Lac-Objekt mit wenig Gas (keine Emissionslinien) wie S5 0716+714.
Hochfrequente VLBI-Beobachtungen zeigen eine station¨are Struktur bei einer Ent-
fernung von ∼0.1 milli-arcsecond vom Kern. Weiter stromabw¨arts deutet die Bewegung
von individuellen Komponenten auf Beschleunigung im Jet hin. Gekr¨ummte Trajekto-
rien der Komponenten, Variationen der “Ridge-Line” des Jets und eine Drehung des
Positionswinkels des Jets nahe seiner Entstehungsregion sind konsistent mit helikalen
Jetmodellen, in welchen ausgestossene Jetkomponenten Drehmoment vom zentralen
Objekt wegtransportieren. Die beobachtete Korrelation zwischen dem Kernfluss und
dem mit Einzelteleskopen gemessenen Radiofluss, sowie die gleichzeitigen ¨ Anderungen
des Positionswinkels des inneren Jets und des Hochenergieflusses (optisch und Gamma-
strahlung) deuten darauf hin, dass die Hochenergiestrahlung ihren Ursprung in einer
Region hat, die sich innerhalb des bei mm-Wellenl¨angen gesehenen VLBI-Kerns hat,
also stromaufw¨arts der τ = 1 Oberfl¨ache auf Gr¨oßenskalen <0.27 parsec vom zentralen
schwarzen Loch.
Preface
The BL Lac object S5 0716+714 is one of the fastest variable blazars with a featureless optical spectrum. It is one of the best studied source in order to search for rapid flux variability and broad-band flux correlations. During 2007-2012, the source was very bright and highly active at millimeter and optical frequencies showing multiple flares, some of which being particularly rapid. These flares are accompanied by corresponding γ-ray activity. The analysis presented in this thesis is aimed to relate the observed structural variability seen with mm-VLBI at a fine angular resolution (∼50µas) to the broad-band flares in the source. This thesis provide a unique framework to study the characteristics of prominent mm-/gamma-ray flares in the context of (1) the shock-in-jet model, (2) broad-band spectral modeling, (3) and jet kinematics, to probe the location and the origin of the high-energy emission region.
The combination of the broad-band variability characteristics with the VLBI mea- surements provides new insight into the core region and at the jet base, a view which was not possible in earlier studies due to their lower VLBI observing frequencies. A detailed investigation of temporal and spectral characteristics of the source is performed using a number of statistical analysis tools. The thesis is structured as follows:
• A brief introduction to active galaxies, relativistic jets, introducing their taxonomy, general observational properties, and the basic ideas for a physical theory of relativistic jets, discussing their formation, structure, evolution, and emission mechanisms is pro- vided in Chapter 1.
• The target source, BL Lac object S5 0716+714 is introduced in Chapter 2.
• Chapter 3 covers the details on the multi-wavelength observations performed in the course of this dissertation and on archival data processing. It discusses the instruments used and data reduction techniques applied. A brief overview of the utilized statistical analysis tools is also given in this Chapter.
• A detailed analysis of the temporal characteristics of the broad-band flux variability
is given in Chapter 4.
• Chapter 5 presents the results of the cross-correlation analysis of radio to γ -ray flux variability observed in the source.
• Chapter 6 presents the spectral analysis of the radio flares and the estimation of the physical parameters of the jet. The evolution of the radio flares is tested in the context of the shock-in-jet model.
• Chapter 7 covers the details of the broadband spectral modeling with a focus on the high-energy emission part of the spectrum.
• Chapter 8 presents the results on the high-resolution multi-frequency VLBI kine- matics study to investigate the inner jet kinematics and to explore the morphological evolution of the source and its relation with the broad-band flux variations.
• Chapter 9 provides a summary of the results presented here and gives a future outlook.
Contents
1 Introduction 1
1.1 Historical background . . . . 1
1.2 The physical picture of AGN . . . . 2
1.3 The AGN zoo and unification model . . . . 4
1.3.1 The unification model . . . . 6
1.3.2 Blazars . . . . 8
1.4 Acceleration in jets . . . . 9
1.5 Emission mechanisms . . . . 10
1.5.1 Thermal radiation . . . . 11
1.5.2 Synchrotron radiation . . . . 12
1.5.3 Inverse-Compton scattering : SSC & EC . . . . 13
1.6 Shocks and plasma instability . . . . 15
1.7 Relativistic effects . . . . 17
1.8 Geometrical effects . . . . 19
2 The BL Lac Object S5 0716+714 20 2.1 Radio Properties . . . . 21
2.2 Optical Properties . . . . 22
2.3 High Energy Emission . . . . 23
2.4 Broadband Variability . . . . 23
3 Multi-wavelength Observations, Data Reduction and Analysis Tech- niques 25 3.1 Observations and data reduction . . . . 26
3.1.1 Radio observations . . . . 26
3.1.2 Optical monitoring . . . . 27
CONTENTS
3.1.3 X-Ray data . . . . 28
3.1.4 Gamma-ray data . . . . 29
3.1.4.1 LAT . . . . 30
3.1.4.2 LAT data reduction . . . . 31
3.2 The time series analysis techniques . . . . 34
3.2.1 Statistical analysis tools . . . . 35
3.2.1.1 Structure function analysis . . . . 35
3.2.1.2 Discrete correlation function analysis . . . . 37
3.2.1.3 Lomb-Scargle periodogram . . . . 38
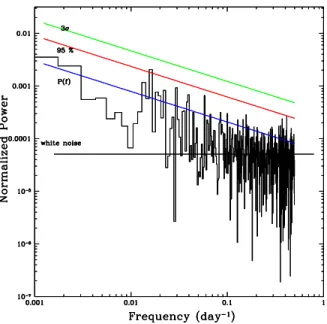
3.2.1.4 Power spectrum density . . . . 40
3.3 Very long baseline interferometry . . . . 42
3.3.1 Observations and data reduction . . . . 42
4 Broad-band Flux Variability 45 4.1 Radio frequencies . . . . 45
4.2 Optical frequencies . . . . 50
4.3 X-ray frequencies . . . . 54
4.4 Gamma-ray frequencies . . . . 56
4.4.1 Sky map . . . . 56
4.4.2 Light curves . . . . 57
4.4.3 Flux variations at different energy bands . . . . 59
4.4.4 Highest energy photons . . . . 62
4.4.5 Variability timescales at gamma-ray frequencies . . . . 62
4.5 Summary and discussion . . . . 63
5 Multi-wavelength Correlated Variability 65 5.1 Radio-radio correlation . . . . 66
5.2 Radio versus optical correlation . . . . 72
5.3 Radio versus gamma-ray correlation . . . . 75
5.4 Optical versus gamma-ray correlation . . . . 78
5.5 The orphan X-ray flare . . . . 79
5.6 Discussion . . . . 80
5.6.1 Origin of optical variability . . . . 80
5.6.2 Origin of gamma-rays . . . . 81
5.6.3 Opacity and delay at radio wavelengths . . . . 81
CONTENTS
5.6.4 Origin of the X-ray flare . . . . 83
5.6.5 Broad-band correlation alignment . . . . 85
5.7 Summary . . . . 85
6 Evolution of Radio flares and physical properties of the jet 87 6.1 Evolution of radio flares in the shock-in-jet scenario . . . . 87
6.1.1 Modeling the radio spectra . . . . 88
6.1.1.1 One-component SSA model . . . . 91
6.1.1.2 Two-component SSA model . . . . 93
6.1.2 Evolution of radio flares . . . . 93
6.1.3 Breaks in the synchrotron spectrum . . . . 97
6.2 Physical parameters of the jet . . . . 99
6.2.1 Brightness temperature T
Bapp. . . . 99
6.2.2 Doppler factor from variability timescales (δ
var) . . . . 100
6.2.3 Size of the emission region (θ) . . . . 101
6.2.4 Inverse-Compton Doppler factor (δ
IC) . . . . 101
6.2.5 Gamma-ray Doppler factor (δ
γ) . . . . 102
6.2.6 Magnetic field from synchrotron self-absorption . . . . 103
6.2.7 Equipartition magnetic field and Doppler factor . . . . 104
6.3 Comparison of the estimated parameters . . . . 105
7 Modeling the high-energy emission 106 7.1 Gamma-ray spectrum . . . . 106
7.1.1 Spectrum over the entire period . . . . 107
7.1.2 Spectral variations . . . . 107
7.1.3 Origin of the gamma-ray spectral break . . . . 112
7.2 The complete spectral energy distribution . . . . 115
7.2.1 SED modeling . . . . 115
7.2.2 Results . . . . 119
7.3 Conclusions . . . . 122
8 Inner jet kinematics and the origin of high-energy emission 124 8.1 Multi-frequency VLBI data . . . . 125
8.2 Jet kinematics . . . . 132
8.2.1 Evolution of the jet ridge line . . . . 132
CONTENTS
8.2.2 Position angle variations . . . . 132
8.2.3 Component motion . . . . 133
8.2.4 Brightness temperature gradient in the jet . . . . 139
8.3 Correlation: Jet kinematics and broad-band flares . . . . 141
8.3.1 Position angle versus flux variations . . . . 141
8.3.2 Connection with broad-band flares . . . . 143
8.4 Discussion . . . . 144
9 Summary and Future Perspectives 146
References 162
Erkl¨ arung 165
Curriculum Vitae 167
List of Figures
1.1 The standard picture of AGN model . . . . 3 1.2 A schematic representation of the current understanding the AGN phe-
nomenon in the unified scheme (graphic by Marie-Luise Menzel, MPE).
The radio-loud AGN are shown in the upper part and radio-quiet in the lower part. . . . . 6 1.3 The contribution of various emission mechanisms in broadband SED of
Blazars . . . . 11 1.4 A sketch of the structure and locations of emission at different wavebands
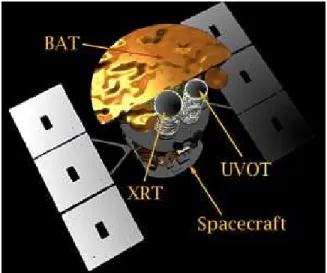
in a radio-loud quasar . . . . 14 1.5 A schematic diagram of the standard shock-in-jet model . . . . 16 1.6 A sketch of shock induced flare spread over a range of frequencies . . . 17 3.1 An artists rendering of the three scientific instruments on board Swift
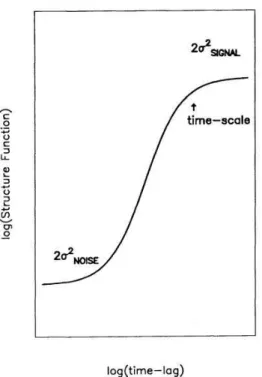
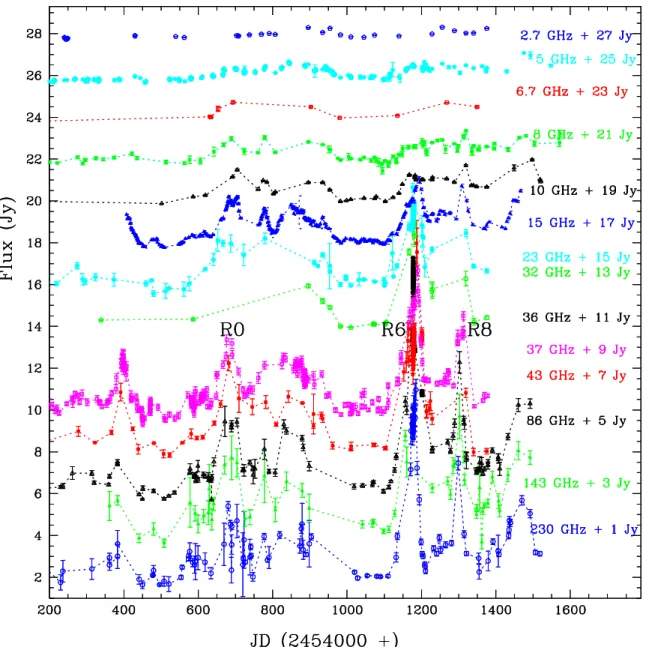
spacecraft . . . . 29 3.2 Schematic diagram of the Fermi/LAT . . . . 31 3.3 The general analysis flow of the Fermi/LAT data reduction tools . . . . 32 3.4 A schematic diagram showing the ideal structure function for a time series 36 4.1 Radio to mm wavelength light curves of S5 0716+714 observed over the
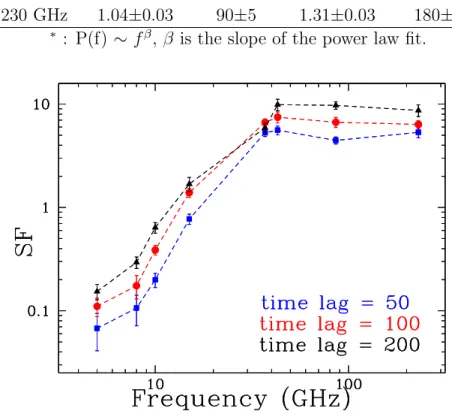
past ∼3 years . . . . 46 4.2 Structure function curves at radio frequencies . . . . 47 4.3 Structure function versus frequency (GHz) curve with a time binning of
50, 100, and 200 days. . . . 48
4.4 Optical V passband light curve of S5 0716+714. . . . . 49
4.5 Structure function curve at optical frequency . . . . 50
LIST OF FIGURES
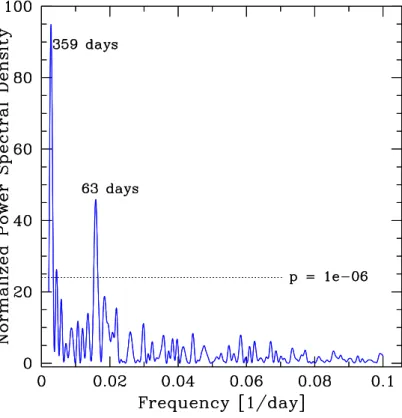
4.6 LSP analysis curve showing a peak at a period of 63 and 359 days. The
dotted line represents the white noise level. . . . 51
4.7 Power spectrum density curve of S5 0716+714 . . . . 52
4.8 Optical V passband light curve of S5 0716+714 with different time binning 52 4.9 The X-ray (0.3 – 10 KeV) light curve of S5 0716+714. . . . . 54
4.10 Soft and hard X-ray light curves of S5 0716+714 . . . . 55
4.11 Sky map of γ-ray events centered on S5 0716+714 . . . . 56
4.12 Gamma-ray flux and photon index light curve of S5 0716+714 . . . . . 57
4.13 Light curves of the source flux above 100 MeV with a time binning of 3 day . . . . 58
4.14 Photon index (Γ) versus photon flux variations at E>100 MeV . . . . . 60
4.15 Gamma-ray flux light curves of S5 0716+714 at different energies . . . 61
4.16 The γ-ray structure function analysis curve at E > 100 MeV . . . . 63
5.1 Light curves of S5 0716+714 from γ-ray to radio wavelengths . . . . 67
5.2 The DCF curves among the different radio frequency light curves . . . 68
5.3 The plot of time lag versus frequency, using 15 GHz as the reference frequency . . . . 70
5.4 The modeled radio flare, R6. The blue points are the observed data, while the red curve represent the fit. . . . 71
5.5 Optical versus radio DCF analysis curves . . . . 74
5.6 Gamma-ray versus radio DCF analysis curves . . . . 76
5.7 Gamma-ray versus optical DCF analysis curves . . . . 77
5.8 The DCF curve of X-ray versus optical V passband flux using a bin size of 3 days. . . . 80
5.9 A plot of time lag measurements versus frequency using 15 GHz as the reference frequency for the two radio flares . . . . 84
6.1 230 GHz light curve of S5 0716+714 showing the major radio flares . . 88
6.2 Quiescent radio spectrum. . . . 89
6.3 Result of the spectral fitting using the synchrotron self-absorption model 90 6.4 Evolution of R6 flare in the S
max– ν
maxplane . . . . 95
6.5 Evolution of R8 flare in the S
max– ν
maxplane . . . . 96
6.6 Radio-IR spectrum using Spitzer observations . . . . 98
LIST OF FIGURES
7.1 Gamma-ray spectrum of S5 0716+714 . . . . 108
7.2 Gamma-ray spectrum of S5 0716+714 during different brightness phases 109 7.3 Break Energy plotted as a function of γ-ray flux for the different activity phases of the source . . . . 110
7.4 Change in ∆Γ plotted as a function of E
P hotonfor the different activity phases of the source . . . . 110
7.5 broad-band flux light curves of the source . . . . 116
7.6 Broad-band SED of S5 0716+714 for time Bin1 . . . . 117
7.7 Broad-band SED of S5 0716+714 for time Bin2 . . . . 118
7.8 Broad-band SED of S5 0716+714 for time Bin3 . . . . 119
7.9 Broad-band SED of S5 0716+714 for time Bin4 . . . . 120
7.10 A comparison of the broad-band SEDs of S5 0716+714 during different activity states. The solid curves represent the best fitted model. . . . 122
8.1 7mm VLBI maps of S5 0716+714 . . . . 126
8.2 3 mm VLBI maps of S5 0714+714 . . . . 128
8.3 Evolution of the jet ridge line of S5 0716+714 . . . . 133
8.4 Position angle variations in the central region of the jet . . . . 134
8.5 The core separation of individual components as a function of time. . 135
8.6 Trajectories of the jet knots in the X-Y plane . . . . 136
8.7 Evolution of radial separation of different components from the core . . 138
8.8 Component brightness temperature as a function of radial separation from the core . . . . 140
8.9 Gamma-ray flux versus position angle correlation analysis plots . . . . 142
8.10 The radio (single dish) and γ-ray flux light curves superimposed on the
43 GHz VLBI core flux light curve. . . . 144
List of Tables
3.1 Ground based radio observatories . . . . 26
4.1 Variability time scales at radio wavelengths . . . . 48
4.2 Fitted parameters of the rapid flares . . . . 59
5.1 Correlation analysis results among radio frequencies . . . . 66
5.2 Radio correlation analysis results for individual flares . . . . 69
5.3 Fitted model parameters for R6 flare . . . . 72
5.4 Optical versus radio DCF analysis results . . . . 73
5.5 Optical versus γ-ray cross-correlation analysis results . . . . 79
6.1 Best-fit spectral parameters for the evolution of radio flares using a one- component SSA model . . . . 91
6.2 The best fitted spectral parameters over the evolution of radio flares using a two component SSA model . . . . 92
6.3 Different states of spectral evolution and their characteristics . . . . . 97
6.4 Variability Brightness temperatures . . . . 100
6.5 Brightness temperature . . . . 103
7.1 Parameters of fitted power laws . . . . 111
7.2 Parameters of SSC and EC fits to SED of S5 0716+714 . . . . 121
8.1 Results from Gaussian Model fitting and component parameters . . . . 129
8.2 Physical parameters of the radio emission . . . . 137
Chapter 1 Introduction
The term Active Galactic Nuclei (AGN) is used for a sample of extragalactic objects, which are very unique in their emission properties and all share a striking characteristic which distinguishes them from all other objects in the Universe. The mystery of AGN is that they produce very high luminosities in a very compact volume, through accretion processes in the vicinity of super massive black holes. In the last few decades, AGN attract the attention of the astronomical community because of their extreme properties.
The need to explain the very high rates of energy generation, requiring supermassive black holes powered sources, jets of relativistic particles blasting out of the nucleus of galaxies and exotic particle−radiation interactions are among the key questions which we would like to answer. Thus, AGN are the special laboratories for extreme physics which we would like to understand. They are also our principal probes of the Universe on large scales, so their study is essential to understand the formation and evolution of galaxies and even the Universe itself.
1.1 Historical background
The first AGN was discovered in 1908 by Edward A. Fath while analyzing the nuclear spectrum of the “spiral nebula” NGC 1068. Later, in 1943, Carl Seyfert discovered that these “emission line” objects constitute a small fraction of the galaxies which had a bright quasi-stellar nucleus and broad emission lines covering a wide range of ionization states. This class of AGN were named as Seyfert galaxies (Seyfert, 1943).
Radio galaxies have been known since the mid of 1950s, when the Third Cambridge
1.2 The physical picture of AGN
Catalog (3C) was created; however, these sources were missing their optical counterpart until 1954 (Baade & Minkowski, 1954).
In 1962, a lunar occultation of the radio source 3C 273 allowed an accurate determi- nation of its radio position and consequently the identification of its optical counterpart.
This turned out to be of star-like appearance, but its optical spectrum contained several strong emission lines unlike stellar spectra, where only absorption lines are detected.
For this reason 3C 273 and similar objects were called quasars which stands for quasi- stellar radio sources (QSR). In 1963, Maarten Schmidt interpreted quasar spectra in terms of cosmological redshift and these sources were recognized to be extragalactic in nature (Schmidt, 1963). Later on, with the discovery of many more star-like objects, which lacked strong radio emission, it was understood that not all of these sources are powerful radio emitters. This leads to a broader definition of Quasi-Stellar Objects (QSOs) as radio-loud and radio-quiet quasars.
The object BL Lacertae (or BL Lac) was at first believed to be a variable star in the constellation of ‘Lacerta’ due to its stellar appearance. ‘BL Lac’ originally repre- sent the 89
thvariable star in constellation Lacerta. In 1968, its radio counterpart was found (Schmidt, 1968), and later it was identified as a new class of AGN, which shows a featureless optical continuum, rapid variability properties and a high degree of polar- ization. When similar sources were discovered afterwards, they inherited the name BL Lac objects or BL Lacs from it.
With the advent of X-ray and observation facilities at even higher energies, broad- band emission features of AGN have been studied and various sub-classes were named accordingly. The spectra of AGN over the whole electromagnetic band are essentially of non-thermal origin, contrary to normal galaxies where the spectrum is composed mainly from the integrated thermal light of stars. The broad-band features and the observational properties of AGN spectra are discussed in the following Sections.
1.2 The physical picture of AGN
There is considerable progress in our understanding of an AGN over the past two-three
decades (e.g. Blandford & K¨onigl, 1979; Meier et al., 2001; Urry & Padovani, 1995,
and references therein). The center of an AGN is a supermassive black hole (SMBH,
10
6– 10
9M
⊙) which accretes matter by its strong gravitational force. Matter pulled
towards the black hole loses angular momentum through viscous or turbulent processes
1.2 The physical picture of AGN
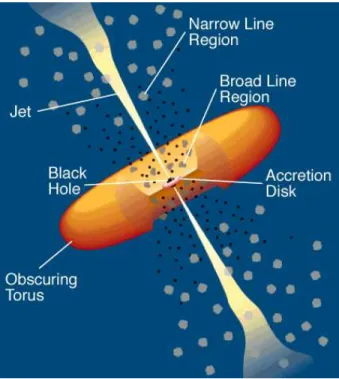
Figure 1.1: A schematic diagram of radio-loud AGN (from Urry & Padovani, 1995).
The SMBH is surrounded by an accretion disk. Broad emission lines are produced by the clouds orbiting the disk. A thick and dusty torus obscures the broad-line region and the inner portion of the jet. Narrow lines are produced by the clouds much farther from the central source.
in an accretion disk. The emitted radiation outshines the disk at ultraviolet (UV) and X-ray wavelengths. One of the prominent theories of jet production asserts that the jet plasma is driven by twisted magnetic field lines threading the accretion disk or the black hole’s ergosphere, with the flow collimated and accelerated along the poles (Blandford &
K¨onigl, 1979; Blandford & Payne, 1982; Spruit, 2010). The transfer of energy powering the outflow is thus from gravitational energy to kinetic energy of rotation, and from there via the magnetic field to an outflow, which transports kinetic energy (Meier et al., 2001; Spruit, 2010). But still, how the gravitational energy is transformed into kinetic and radiative energy is poorly understood.
Strong emission lines at optical and UV wavelengths originate from clouds of gas
and dust moving rapidly in the vicinity of accretion disk. The emission lines have line
widths over ∼1000 km s
−1(and up to 10,000 km s
−1). This region is known as broad-
line region (BLR), and it is believed to be caused by photo-ionization from the hot
accretion disk. The BLR region is located at up to a distance of ∼1 parsec (pc) from
1.3 The AGN zoo and unification model
the SMBH. The torus or warped disk of gas and dust lies well outside the accretion disk and BLR region. Beyond the torus, there are clouds of slower moving gas and dust which produce narrow emission lines. The line width in this case extends only up to 1000 km s
−1. This emission region is known as narrow-line region (NLR) and it is believed to be located at a distance of ∼10 pc to 1 kpc from the central engine.
The flow of radiation and energetic particles occur along the two poles of the ac- cretion disk, forming jets and giant radio structures which extend from a few hundred of kpc to several Mpc. Jets are mainly composed of either normal plasma (electron - protons) or pair plasma (electron - positron). When the jet plough into the surrounding extragalactic medium a bow shock is formed and energy is dissipated at the working surface; lobes are formed from turbulent plasma, of which some may even form a cocoon of back-flowing material (Blandford & K¨onigl, 1979). Twin jets fit well with the simple idea of a rotational phenomenon, in which the two poles of the rotation axis provide a natural symmetry for back-to-back jets. A schematic picture of a standard radio-loud AGN is shown in Fig. 1.1.
1.3 The AGN zoo and unification model
The full class of AGN constitute a zoo of different names, detection criteria, flux, spec- tral, and polarization variability characteristics. Over the years, two major classes of AGN have been established i.e. radio-loud AGN and radio-quiet AGN. The classifica- tion is often made on the basis of a parameter value called radio-loudness factor, defined as :
R
L= log ³ f
5GHzf
B´ (1.1)
where f
5GHzis the radio flux at 5 GHz and f
Bis the optical B band flux centered at the wavelength λ = 4400˚ A. Roughly ∼ 10 − 15% of AGN are radio-loud, meaning that they have R
L≥ 1, while the rest with R
L≤ 1 are classified as radio-quiet AGN (e.g.
Kellermann et al., 1989). However, the object which is radio-quiet is not necessarily radio-silent; it can still show a certain amount of radio emission. The relativistic jets discriminate the two type of sources; the radio emission in radio-loud AGN is dominated by powerful radio jets, which are absent in radio-quiet AGN.
Both the radio-quiet as well as radio-loud AGN are further sub-classified into type1
and type2 objects depending on the strength of emission lines in their optical spectra.
1.3 The AGN zoo and unification model
The type2 objects show only narrow emission lines (FWHM ∼ 1000 km s
−1), while the spectrum of type1 objects is characterized by both narrow and broad emission lines.
The line widths of broad emission lines in type1 sources can extend up to 10,000 km s
−1.
The Seyfert 2 galaxies belong to the category of type2 AGN. Their spectrum is characterized by narrow emission lines, and they are hosted in nearby spiral galaxies.
This subclass also includes the Narrow Emission Line Galaxies (NELGs), which are also called Narrow Line X-ray Galaxies (NLXGs). Their optical spectra is similar to Seyfert 2 galaxies with narrow emission lines only, but their hard X-ray emission is comparatively stronger.
Seyfert 1 galaxies belong to type1 AGN. They are similar to the Seyfert 2 galaxies with broad emission lines in their optical spectra (FWHM ≥ 1000 km s
−1) in addition to the narrow lines. Many of the Seyfert galaxies are radio-quiet in nature. Other than the types of radio-quiet galaxies defined above, Broad Absorption Line Quasars (BAL QSOs) and Low Ionization Nuclear Emission Line Region galaxies (LINERs) also belong to this category.
The radio galaxies Fanaroff-Riley type 1 (FR I) and Fanaroff-Riley type 2 (FR II) (Fanaroff & Riley, 1974) are classified as type1 objects. The FR II galaxies have radio morphologies characterized by powerful edge-brightened double lobes with prominent hot spots and tend to be found in less dense environments (towards the edge in galactic clusters); while the FR I have radio emission peaking near the nucleus, have rather diffuse edge-darkened lobes and frequently inhabit more dense environments. The FR I galaxies often lie in the center of galactic cluster medium which on interaction with any outward flow from the central engine causes the dissipation of energy.
The radio-loud type1 AGN are called Broad Line Radio Galaxies (BLRGs) at low lu- minosity and radio-loud quasars at high luminosity. The radio-loud quasars are further classified into Steep-Spectrum Radio Quasars (SSRQs) with radio spectral index α
r1≥ 0.5 and Flat-Spectrum Radio Quasars (FSRQs) with α
r≤ 0.5. The SSRQs and FSRQs are basically luminous BLRGs and both display often FR II radio morphologies with extended lobes. They have broad emission lines in their optical spectra and can thus be classified as type 1 objects, but their continuum spectrum has the peculiar properties of blazars. Blazars (Section 1.3.2) are a subclass of radio-loud AGN characterized by strong and rapid flux variability across the entire EM spectrum and strong polarization
1
F
ν∝ ν
−αr1.3 The AGN zoo and unification model
BL Lac FSRQ
BLRG, Type I
QSO
NLRG, Type II
QSO BLRG
NLRG
Seyfert 2
Seyfert 1 transmitted
scattered
absorbed reflected
narrow line region broad line region
black hole accretion disc electron plasma
dusty absorber
radio-loud (RL) AGNradio-quiet (RQ) AGN
high power low power
jet
Figure 1.2: A schematic representation of the current understanding the AGN phe- nomenon in the unified scheme (graphic by Marie-Luise Menzel, MPE). The radio-loud AGN are shown in the upper part and radio-quiet in the lower part.
from radio to optical wavelengths.
1.3.1 The unification model
The idea of unification for different types of AGN came when it was realized that pro- jection effects can play an important role in the interpretation of some of these sources.
With the improvement in spectroscopic capabilities, Seyfert galaxies showing features of both type1 and type2 objects were discovered. Moreover, polarization observations revealed similar properties for the two classes of Seyfert galaxies (Smith et al., 2004).
Since then numerous efforts have been made in determining to what extent different
1.3 The AGN zoo and unification model
types of AGN are simply different manifestations of the same object viewed from dif- ferent angles.
Rowan-Robinson (1977) reported that the central region in many AGN is contam- inated by obscuring material in the form of gas and dust (IR through UV), which prevents penetrating some lines of sight. The gas or dust is either distributed in a torus (Pier & Krolik, 1992, 1993) or in a wrapped disk (Sanders et al., 1989). Also, emission from AGN is not isotropic in nature. The radiation is strongly beamed along the jet direction. So, apart from obscuration by accretion disk and torus, there are certain other phenomena like Doppler boosting and superluminal motion (see Section 1.7) which play a key role in modifying the appearance of an AGN. All these effects cause AGN to appear markedly different from different viewing angles.
It is the orientation of the nuclear zone and torus and of the jet with respect to observer which forms the basis of the unification model. If the AGN is orientated more edge-on then the torus hides the central region, and at large angles it would hide the BLR completely. In this case the observed spectrum of an AGN is featured by narrow emission lines, while the observer who is looking face-on at the AGN, is able to see the BLR and related features of the central engine. The observed properties of radio-loud AGN are characterized by relativistic jets, which are absent in radio-quiet AGN. When the line of sight intercepts the radio jet which is then viewed along its axis, relativistic beaming strongly amplifies the luminosity and produces strong variability, polarization, superluminal motion and all the other effects described for the blazar class.
The first attempt of unification was made by Scheuer & Readhead (1979). They proposed that FSRQs were the beamed counterparts of radio-quiet quasars. Orr &
Browne (1982) suggested that FSRQs are aligned versions of SSRQs. An alternative suggestion was that SSRQs and FSRQs are increasingly aligned versions of FR II galax- ies (Barthel, 1989; Padovani & Urry, 1992). BL Lacs were thought to be more aligned versions of quasars since their line width of emission lines is much smaller than in FSRQs (Blandford & Rees, 1978).
The recent unification scheme is proposed by Urry & Padovani (1995). The various
different types of AGN are defined according to their distinct observational properties,
as given in Fig. 1.2; the radio-loud AGN are shown in the upper half and radio-quiet
AGN in the lower part. According to the current unification model, NLRGs, BLRGs,
radio-loud QSOs and blzars belong to the category of radio-loud AGN in which blazars
are observed along the line of sight of the observer, radio-loud QSOs and BLRGs at
1.3 The AGN zoo and unification model
modest angles, while NLRGs are seen at large angles along the line of sight of the ob- server. Radio-quiet QSOs, Seyfert galaxies, LINERs etc. belong to radio-quiet AGN.
BL Lacs are less luminous than QSOs; this suggests that the parent population of BL Lacs are FR I galaxies and of QSOs are FR II galaxies.
1.3.2 Blazars
BL Lacertae objects (BL Lacs) and flat-spectrum radio quasars (FSRQs) are now usu- ally clubbed together and called blazars. In spite of the dissimilarity of their optical spectra (FSRQs show strong broad emission lines, while BL Lacs have only weak or no emission lines in their optical spectra), they share the same peculiar continuum proper- ties (e.g. strong variability and polarization properties). Furthermore, objects such as Optically Violently Variable Quasars (OVVs), Highly Polarized Quasars (HPQs), and Core Dominated Quasars (CDQs) turned out to be different empirical definitions of the same kind of objects and are now included in the FSRQ class.
Blazars form a small subset of radio-loud AGN, which are characterized by strong and rapid flux variability across the entire electromagnetic (EM) spectrum (e.g., Heidt
& Wagner, 1996; Rani et al., 2010b, 2013a; Wagner et al., 1996, etc.). Blazars exhibit strong polarization from radio to optical wavelengths (Fan et al., 1997; Impey et al., 1982; Takalo et al., 1994) and usually have core-dominated radio structures. Accord- ing to the orientation based unified model of radio-loud AGN, blazar jets usually are oriented at a small angle to the line of sight of the observer (e.g. Urry & Padovani, 1995).
Blazars emit radiation across the whole electromagnetic (EM) spectrum from radio to γ-rays. The EM radiation from blazars is predominantly non-thermal. The spectral energy distributions (SEDs) of blazars have a double-peaked structure (e.g. Fossati et al., 1998; Ghisellini et al., 1997; Giommi et al., 1995). Based on the location of the first peak of their SEDs (ν
peak), blazars are often sub-classified into low-energy peaked blazars (LBLs) and high-energy peaked blazars (HBLs) (Padovani & Giommi, 1995); however, it should be noted that the SED peaks can be located at intermediate frequencies as well, giving rise to the intermediate peaked blazar (IBL) classification (e.g.
Sambruna et al., 1996). The first component peaks in the near-infrared (NIR)/optical
in case of LBLs and at UV/X-rays in HBLs, while the second component usually peaks
1.4 Acceleration in jets
at GeV energies in LBLs and at TeV energies in HBLs. More specifically, Nieppola et al. (2006) classify over 300 BL Lacs and suggest that blazars with peak frequency, ν
peak= 10
13−14Hz are LBLs, those with ν
peak= 10
15−16Hz are IBLs, and those with ν
peak= 10
17−18Hz are HBLs. The location of peaks in the SEDs of LBLs and HBLs is shown in Fig. 1.3.
1.4 Acceleration in jets
The non-thermal emission in blazar jets extending from hundreds of pc to kpc scale implies that a powerful particle acceleration mechanism is at work. Particles accelerated to very high energies have been considered as a prime candidate source of extragalactic cosmic rays (e.g. Brecher & Burbidge, 1972). The AGN jets are believed to be collimated by magnetic fields and accelerated through conversion of magnetic energy to bulk kinetic energies. The jet emission can be driven by kinetic energy, e.g. the dissipation of shocks and/or by reconnection of magnetic field lines, (Blandford & Rees, 1978; Blandford &
Znajek, 1977). In short, the jets of AGN carry a large fraction of the accreted power off the super massive black holes.
Black holes alone are not able to form jets and therefore magnetic fields are required to form such powerful outflows. The black hole magnetosphere has to be anchored in the accretion flow, extracting angular momentum from the black hole through a Poynting flux jet (Blandford & Znajek, 1977; Meier et al., 2001). The powering of a jet solely by the accretion disk (without magnetic field) is still controversial. After the formation of the plasma flow close to the central engine, it will be collimated and accelerated in the presence of strong magnetic fields. The collimation zone spans a distance scale of up to ∼10
3Schwarzschild radii, for which magnetic fields may play a dominant role.
Kelvin–Helmoltz instabilities are considered as one of the reason why we see wiggly jets at a distance of hundreds of kpc from their site of origin in the nucleus. A brief review of recent developments in the area of magnetic acceleration can be found in Komissarov (2011).
The Kelvin–Helmoltz instabilities (due to pressure imbalance between the external medium and the jet) can lead to the development of turbulence and formation of shocks causing enhanced emission seen on parsec and kpc scales. Much of the rich structure seen in some jets may result from the presence of such instabilities (Sikora et al., 2005).
The observations of synchrotron radiation from jets imply that the material in the
1.5 Emission mechanisms
jet is a magnetized plasma. The content of the plasma may be electrons–protons or electrons–positrons or a mixture of these. The plasma in relativistic jets is highly hydro- magnetically turbulent. This fact is confirmed by observations of low linear polarization, lower than is expected from synchrotron radiation, which means that the magnetic field is randomly oriented in absence of self-absorption.
Turbulence causes the formation of ‘eddies’ of many different length scales. Most of the kinetic energy of the turbulent motion is contained in these ‘eddies’. The en- ergy cascades from large to smaller scales creating smaller and smaller structures, and producing a hierarchy of ‘eddies’. Hence, the eddies are the regions of higher electron density, velocity, and magnetic field etc.. As the disturbance propagates down the jet, it brightens at sites where it encounters density and/or magnetic field enhancements and fades where it encounters diminishments. It is mainly the magnetic field fluctua- tions that amplify or reduce the flux density at a given location in the shock (Marscher, 1996). As a result, the interaction of shock wave and turbulent medium in a jet may explain some key characteristics of blazar emission. A brief discussion of the various emission processes is given in the next Section.
1.5 Emission mechanisms
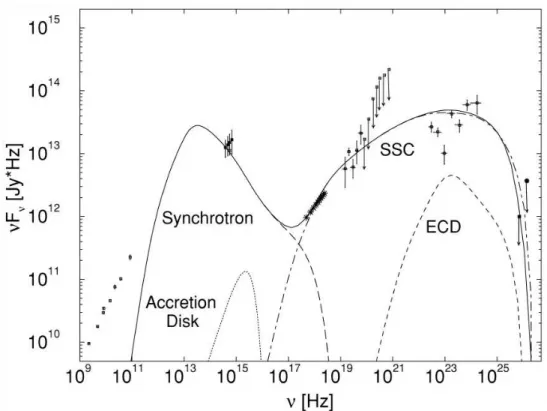
The electromagnetic radiation from AGN is spread over a wide range of frequencies through radio to γ-rays. This is evident in the spectral energy distribution of BL Lac shown in Fig. 1.3. Such a broad spectrum occurs because AGN emit a mixture of thermal and non-thermal radiation. The low frequency radio emission is the synchrotron radiation from the kpc scale jet, while the high frequency radio to optical emission is dominated by the synchrotron mechanism from the the inner parsec scale region of the jet. The accretion disk emits thermal optical-UV radiation, and the X-rays and γ-rays are produced by inverse-Compton scattering of synchrotron photons and also of the seed photons outside the jet (e.g. photons from accretion disk, BLR region etc.).
The details of thermal and non-thermal emission mechanisms are given in the following
subsections.
1.5 Emission mechanisms
Figure 1.3: The broadband SED of BL Lac object showing the contribution of various emission mechanisms from radio to γ-rays. The low energy part of the SED is mainly dominated by non-thermal (synchrotron) emission with an additional thermal contri- bution from the accretion disk. However, the high-energy photons are produced either by SSC or EC. Figure courtesy : B¨ottcher & Bloom (2000).
1.5.1 Thermal radiation
The radiation emitted by a body due to its thermal energy which is a function of its temperature is known as thermal radiation. The emitted thermal energy is characterized by the black-body radiation and can be defined by Planck’s Law. The thermal structure of the accretion disk of an AGN follows a negative temperature gradient which means its temperature decreases as a function of radial distance from the SMBH (Shakura &
Sunyaev, 1973). The overall structure of the accretion disk is governed by the accretion
rate and the mass of the central engine. For standard geometrically thick and optically
thin accretion disks, the temperature changes as a function of the radial distance from
the center as T ∝ r
−3/4(Shakura & Sunyaev, 1973). The temperature (T) as a result
depends on the mass of the central BH (M
BH) as T ∝ M
BH−1/4. Therefore, the accretion
disk is a “multi-color” black body where each annulus radiates following Planck’s Law,
1.5 Emission mechanisms
given by
F (ν) = 2hν
3/c
2exp(hν/kT (r)) − 1 (1.2)
where h, c, and k are Planck’s constant, the speed of light in vacuum, and the Boltz- mann’s constant, respectively, and T(r) is the temperature of the black body at radial distance r from SMBH. After integrating over r, the emission spectrum of the accretion disk as a whole is given by
F (ν) ∝ ν
1/3exp(− hν
kT (r
max) ) (1.3)
where r
maxis the radius at which the maximum dissipation of energy per unit area occurs, and lies somewhat outside the marginally stable orbit (Krolik, 1999). The wavelength (λ
max) at which the intensity peaks is determined by Wien’s Displacement Law:
λ
maxT = 0.29 cmK (1.4)
The temperature of the accretion disk in AGN vary between ∼4000 to 40,000 K, hence it emits optical-UV radiation. So, the optical-UV part of electromagnetic spectrum of AGN is significantly dominated by thermal emission from the accretion disk (Malkan
& Sargent, 1982). The contribution of thermal emission in the overall SED of blazars is shown in Fig. 1.3.
1.5.2 Synchrotron radiation
When the relativistic charged particles are accelerated in the presence of a magnetic field (B), then they emit electromagnetic radiation which is known as synchrotron radiation.
The relativistic jets of AGN containing magnetized relativistic plasma emit synchrotron radiation at radio to optical (sometimes X-ray) frequencies. So, the lower energy part of blazar SEDs is dominated by the synchrotron mechanism (Figure 1.3). The most of the synchrotron luminosity occurs at a critical frequency, ν
cwhich is given by
ν
c= 2.8 × 10
6Bγ
2(1.5)
where γ is the Lorentz factor (γ = (1 − v
2/c
2)
−1/2), B is magnetic field in Gauss, and
ν
cis in Hz.
1.5 Emission mechanisms
The average rate at which energy is lost is given by dE
dt = 4
3 σ
Tcγ
2U
mag(1.6)
where σ
Tis the Thompson scattering cross-section and U
magis the energy density in the magnetic field (U
mag= B
2/8π).
The spectrum of power emitted by an ensemble of electrons follows a power law given by
P (ν) ∝ ν
−α, α = p − 1
2 (1.7)
where α is the spectral index of the observed power law and p is the power law index of energy distribution of emitting electrons.
The power law spectrum is naturally produced if the emitting electrons follow a power law distribution of energy (N(E)dE ∼ E
−p). Such power law distribution of electrons can be produced in a variety of ways such as second order Fermi-acceleration through shocks (Blandford, 1990; Kirk et al., 2000). But, the observer will see this power law spectrum only if there is no absorption by the emitting region. In presence of magnetic field, the emitted photons can be absorbed by the emitting region itself or by some other medium in between. The absorption of emitted radiation by the emission region itself is known as synchrotron self-absorption at low radio frequencies, which produces an inverted power law spectrum with index, α ∼ 5/2.
1.5.3 Inverse-Compton scattering : SSC & EC
In inverse-Compton (IC) scattering, a (seed) photon gains energy when it is scattered off by a high-energy electron. Whenever the moving electron has sufficient kinetic energy compared to the photon, energy is transferred from the electron to the photon.
This process therefore converts low energy photons (IR/optical) to high-energy photons (X-ray/γ-ray). It is the dominating process through which electrons in the AGN jets can emit high-energy photons.
In the framework of leptonic jet models, in which the radiative signatures of the
jet are dominated by the relativistic electrons (and possibly electron-positron pairs) in
the jet, the high-energy emission, at X-ray and γ-ray energies, is believed to be pro-
duced through Compton up-scattering of soft seed photons by the same population of
relativistic electrons which also produces the synchrotron emission at lower frequen-
1.5 Emission mechanisms
Figure 1.4: A cartoon illustrating location of different regions of a radio-loud quasar from the central engine in terms of Schwarzschild radii of the black hole and its various physical and emission components. The radiation produced in the jet is relativistically beamed along the line of sight to the observer (Figure Courtesy : Alan Marscher).
cies (e.g. B¨ottcher et al., 2007; Krawczynski, 2004; Sikora & Madejski, 2001). Possible sources of the target photons for Compton scattering are (a) the synchrotron photons themselves (SSC for Synchrotron Self-Compton), (b) external photons from the accre- tion disk entering the jet directly from behind (ECD for External Comptonization of Disk photons), (c) external photons from the broad line regions and other circumnu- clear debris, which is reprocessing part of the central accretion disk luminosity, (d) jet synchrotron emission, reflected off circumnuclear debris, and/or (e) infrared emission from circumnuclear dust (IRC for Infra-Red Comptonization). The energy loss rate in IC scattering is given by
dE
ICdt ∝ γ
2U
ph(1.8)
where U
phthe energy density of the seed photon field. The frequency of up-scattered photons (ν
f) is approximately given by
ν
f∼ γ
2ν
i(1.9)
where ν
iis the frequency of seed photons.
The first peak in the SED of blazars is thought to originate from synchrotron emis-
1.6 Shocks and plasma instability
sion. The high-energy part of blazar spectrum is mainly produced by the IC (SSC or EC) scattering processes (see Fig. 1.3). The optical-UV photons are up-scattered to GeV-TeV energy ranges in AGN jets by these scattering processes. In LBL and FSRQ, the second peak is situated in the hard X-ray/γ-ray band, at lower energies with respect to the HBL. As a consequence, for blazars, the X-ray band contains contributions from both the synchrotron emission and the IC emission, giving rise to a wide range of slopes.
In HBLs, the X-ray emission is the high-energy tail of the synchrotron emission and the resulting slope is steep; for LBL and FSRQ it is the rising part of the inverse-Compton bump and thus the slope is flat. The strong γ-ray emission is produced in all blazars through IC scattering.
1.6 Shocks and plasma instability
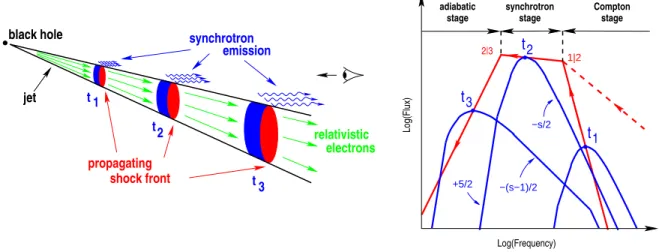
The relativistic shocks propagating down in a conical jet were proposed to explain the observed superluminal knots in AGN (Blandford & Rees, 1978). A major increase in either the bulk speed or internal energy of the jet flow will cause a shock wave to form and propagate down the jet (Marscher, 1996) (Fig. 1.4). A shock front compresses the plasma resulting into an increase in its internal energy, magnetic field (B), and velocity etc.. In this process, the energy of the particles increase because of successive shock-crossing, their velocity distribution becomes isotropic with respect to the flow due to internal scattering. By crossing the shock front multiple times, particles can be accelerated to high-energy before they leave the acceleration region (diffusive shock acceleration, Schwadron et al., 2008). The acceleration is most efficient when the mag- netic field is perpendicular to the shock front, as the particles can stream more freely along the field lines. Hence, the synchrotron emission in shocks can be amplified by 1. the increase in density behind a shock front,
2. the increase in magnetic field strength, 3. the increase in internal energy, and 4. by diffusive shock acceleration.
The particles accelerated across the shock front emit radiation over a range of frequen- cies depending upon their energy.
For a shock induced flare, the emitted synchrotron spectrum evolves following three
stages depending on the dominant emission-loss mechanism of the electrons (Fromm
et al., 2011; Marscher & Gear, 1985; T¨ urler, 2011) :
1.6 Shocks and plasma instability
−(s−1)/2
t 3
t 3
adiabatic stage
−s/2
+5/2
2
t
stage synchrotron
2
t 1
stage Compton
t
t 1
2|3 1|2
Log(Frequency)
Log(Flux)