Observations of the γ -ray binary LS I +61 303 with MAGIC
T. Jogler
1, V. Bosch-Ramon
2, J. Cortina
3, J. M. Paredes
2, M. A.
Perez-Torres
4, M. Rib´ o
2, J. Rico
3, N. Sidro
3and D. F. Torres
3,5for the MAGIC collaboration
1 Max-Planck-Institut f¨ur Physik, D-80805 M¨unchen, Germany
2 Universitat de Barcelona, E-08028 Barcelona, Spain
3 IFAE, Edifici Cn., E-08193 Bellaterra (Barcelona), Spain
4 Instituto de Astrofisica de Andalucia IAA-CSIC
5 ICREA & Institut de Cienci`es de l’Espai (IEEC-CSIC), E-08193 Bellaterra, Spain E-mail: jogler@mppmu.mpg.de
Abstract. The binary system LS I +61 303 is one of fourγ-ray binaries known. The system was studied intensively with the MAGIC telescope between September 2005 and December 2006.
The total amount of 166 hours of data were taken during two observation campaigns of 6 and 4 month duration. We produced the most detailed light curve of the system in γ-rays with energy above 100 GeV. We found a clear variation of the flux level in different orbital phase bins and on timescales of about one day. The spectral energy distribution can be described well by a power law with spectral photon index of 2.6±0.2. We found no significant change in the spectral index between different orbital phases or during the different observation campaigns.
1. Introduction
The binary system LS I +61 303 consists of a compact object (either a neutron star or a stellar- mass black hole) and a B0Ve star with a circumstellar disc. The compact object exhibits a highly eccentric orbit (e = 0.73) [1] with a period of 26.5 days where the periastron passage occurs at phase 0.23. The ephemerides are taken from Gregory [2].
LS I +61 303 was first detected by COS-B in
γ-rays and later in radio [3] and X- rays. The MAGIC collaboration discovered the system as an emitter of variable Very High Energy (VHE,E
>50 GeV)
γ-rays[4]. Recently the VERITAS collaboration confirmed thisdetection [5].
In the radio and optical waveband LS I +61 303 shows a periodic emission with a period of
P= 26.496 d. Evidence for periodical emission was found at X-ray energies [6], with a period compatible with the optical and radio emission, but showing a maximum in a different phase.
The source was detected by the EGRET detector on board of the CGRO satellite. The emission in the GeV energy
γ-rays might be variable [7].Despite many observations of LS I +61 303 the nature of the system is still unknown. It is classified as a High Mass X-ray Binary (HMXB) and was considered a microquasar for some time. Recent high resolution VLBA measurements show a complex and changing morphology that departs from a clear jet like radio emitting feature [8],[9]. This new measurements favor the explanation that LS I +61 303 hosts a neutron star with a pulsar wind nebula. Up to now,
10th Int. Conf. on Topics in Astroparticle and Underground Physics (TAUP2007) IOP Publishing Journal of Physics: Conference Series 120 (2008) 062019 doi:10.1088/1742-6596/120/6/062019c 2008 IOP Publishing Ltd 1
no final statement can be made concerning its classification. In this paper we report mainly on the followup observation performed with the MAGIC telescope in autumn 2006.
2. Observations and analysis
MAGIC is an Imaging Atmospheric Cherenkov Telescope with a 17m diameter reflector. The telescope is located at the Canary Island of La Palma at 2200m asl, from where LS I +61 303 can be observed at zenith angles larger than 32
◦. The observations took place in two observation campaigns. The data analysis of the first campaign (OC1) is described in [4] and due to lack of space we will describe only the analysis of the 2nd observational campaign (OC2) here. The OC1 took place between September 2005 and March 2006 and the OC2 was performed between September 2006 and December 2006. The OC2 resulted in a total amount of 112 hours of good quality data, taken on 54 days. The zenith angle ranges from 32
◦−44
◦, which yields an analysis energy threshold of about 200 GeV. The observation was performed in the so called wobble mode, in which the source is tracked off axis from the camera center and three symmetrical placed off-source positions are used for background estimation.
The data was analyzed using the Magic Analyzing and Reconstruction Software (MARS). The recorded shower images were characterized using the Hillas parameters [10] which were fed into a Random Forest [11]. The Random Forest estimates the energy for each shower image and calculates a parameter called hadronness which is linked to the probability that a shower image is of hadronic origin.
The selection of the
γ-rays was done by demanding an 80%
γ-ray efficiency for the cutvalue in hadronness and 70%
γ-ray efficiency for the cutvalues in θ2, where
θ2is the squared angular distance between the source position and the reconstructed origin position of the shower image. The cutvalues were determined from simulated MC
γ-rays. After selection of the γ-raycandidates a daily LC and differential energy spectra for the orbital phase bins 0.5–06 and 0.6–
0.7 were produced. The differential energy spectra were unfolded taking into account the full detector dependent energy response [12].
3. Results
After averaging the fluxes of the different orbital cycles the LC of OC1 shows a rather broad peak with the maximum emission level between the phase 0.5–0.7 [4]. In the OC2 we saw a sharper peak of the maximum emission level in the phase bin 0.6–0.7 (see Fig.1). The sampling rate of the different orbital phases in one orbital cycle is much higher in the OC2. This leads to a more stable average in most phase bins because each average value is calculated from more individual measurements. Therefore the maximum flux level is located in most orbital cycles in phase bin 0.6–0.7. There is one exception in the last observed orbital cycle of OC2, where we see the highest emission in the phase bin 0.8–0.9, while in the other orbital cycles no significant signal was detected in this phase. It is quite interesting that in the same phase bin and the same orbital cycle the X-ray satellite Swift detected a very high flux level [13].
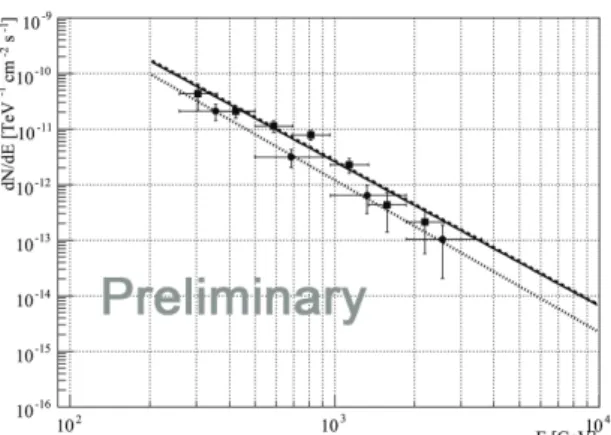
The produced differential energy spectrum from the OC1 is shown together with the averaged spectra of the phase bins 0.5–0.6 and 0.6–0.7 in Fig. 2. All spectra can be described with pure power laws and the obtained spectral photon indices are compatible with each other within their errors. The spectral index of the spectrum obtained from OC2 between phase 0.6–0.7 exhibits the highest significant detection and can be described by the power law
dF
dE
= (2.6
±0.3)
·10
−121 TeVE −2.6±0.2[TeV
−1cm
−2s
−1]. We found no evidence for significant changes in the spectral index between different phase bins. The flux level changes between the different orbital phase bins up to a factor of
∼3 and we found changes within timescales of one day. However we found no significant evidence for variability on timescales of 30 to 75 minutes.
All intranight LC from the different observing nights can be described by constant flux levels as determined from
χ2fits of constants to the individual LC’s.
10th Int. Conf. on Topics in Astroparticle and Underground Physics (TAUP2007) IOP Publishing Journal of Physics: Conference Series 120 (2008) 062019 doi:10.1088/1742-6596/120/6/062019
2
Figure 1. Shown are the LCs of the OC2 for the different orbital cycles and the averaged flux level per phase bin in the last row. The vertical line marks the periastron passage of the compact object.
Figure 2. Shown are the differential energy spectra together with their fitted power laws.
The spectrum with dashed line is the averaged spectrum from OC1. The dotted line is the OC2 averaged spectrum of phase 0.5–0.6 and the solid line represents the spectrum derived for phase 0.6–0.7 in OC2.
4. Conclusions
LS I +61 303 is a variable
γ-ray binary with its highest flux in the phase bin 0.6–0.7. Its spectralenergy distribution can be described by a pure power law and its spectral photon index does not change between the highest flux phase bins and is stable on timescales of one year. While we found variability in the flux level on timescales down to one day there is no evidence of intranight variability.
Acknowledgments
We thank the IAC for the excellent working conditions at the ORM. The support of the German BMBF and MPG, the Italian INFN, these Spanish CICYT, the ETH Research Grant TH 34/04 3 and the Polish MNiI Grant 1P03D01028 is gratefully acknowledged.
References
[1] Casares J, Ribas I, Paredes J M, Mart´ı J and Allende Prieto C 2005MNRAS 3601105–1109 [2] Gregory P C 2002ApJ 575427–434
[3] Gregory P C and Taylor A R 1978Nature272704–706 [4] Albert Jet al.2006Science 3121771–1773
[5] Maier G 2007astro-ph/07093661
[6] Paredes J M, Marti J, Peracaula M and Ribo M 1997A&A320L25–L28
[7] Tavani M, Kniffen D, Mattox J R, Paredes J M and Foster R 1998ApJL497L89+
[8] Dhawan V, Mioduszewski A and Rupen M 2006VI Microquasar Workshop: Microquasars and Beyond [9] Albert Jet al.2007in preperation
[10] Hillas A M 1985ICRC (ICRC vol 3) ed Jones F C pp 445–448 [11] Albert Jet al.2007astro-ph/07093719
[12] Albert Jet al.2007astro-ph/07072453
[13] Esposito P, Caraveo P A, Pellizzoni A, de Luca A, Gehrels N and Marelli M A 2007A&A474575–578 10th Int. Conf. on Topics in Astroparticle and Underground Physics (TAUP2007) IOP Publishing Journal of Physics: Conference Series 120 (2008) 062019 doi:10.1088/1742-6596/120/6/062019
3