30THINTERNATIONALCOSMICRAYCONFERENCE
A First Synoptic Blazar Study Comprising Thirteen Blazars Visible in E > 100 GeV Gamma-Rays
ROBERTWAGNER1
1Max-Planck-Institut f¨ur Physik, F¨ohringer Ring 6, D-80805 M¨unchen, Germany robert.wagner@mppmu.mpg.de
Abstract:Since 2002, the number of detected blazars atEγ>100GeV has more than doubled. I study all currently known BL Lac-type objects with published energy spectra. Their intrinsic energy spectra are reconstructed by removing extragalactic background light attenuation effects. The emission properties are then compared and correlated among each other, with X-ray data, and with the individual black hole masses. In addition, I consider temporal properties of the very-high energyγ-ray flux. Key findings concern the flux–black hole mass and variability scale–black hole mass connections and the correlation of the spectral slope and the luminosity. As a specific application, the study allows to constrain the still undetermined redshift of PG 1553+113.
Introduction and Approach
In order to assess both the acceleration mecha- nisms in blazars and extragalactic background light (EBL) absorption effects, not only individual ob- ject studies, but also the investigation of a large sample of very-high energy (VHE)γ-ray emitting blazars is desirable. Ideally it should encompass a wide range in redshift for EBL studies and also include groups of sources at comparable distances in order to study intrinsic properties of the indi- vidual sources without possible systematic uncer- tainties caused by the EBL de-absorption. The preconditions for such comparative blazar studies have much improved recently. To date, the VHE γ-ray blazar sample comprises 18 BL Lac objects (e.g. [1]), withz = 0.030. . .0.212.1 A sample of all blazars with reported energy spectra is stud- ied by inferring the intrinsic emission properties of the individual objects and by probing correlations of their VHEγ-ray and X-ray emission properties with black hole (BH) mass (M•) estimates.
Black Hole Masses. We estimateM•by evalu- ating theM•-σrelation [2], i.e. the tight correla- tion of the stellar velocity dispersionσandM•of nearby galaxies. This approach assumes that AGN host galaxies are similar to inactive galaxies as far as theM•-σrelation is concerned. We find that the
currently VHEγ-ray emitting BL Lacs are flatly distributed inM• = (108−109.5)M¯. Note that although AGNs harbor BHs withM• > 106M¯, up to now only BL Lacs withM• >108M¯have been discovered in VHEγ-rays.
Intrinsic VHE γ-Ray Emission Parameters.
The photon spectra measured in the VHE range suffer absorption by EBL [3]. Here, the in- trinsic blazar spectra are reconstructed using the EBL “low” model given in [4]. For sources that have been found in different flux states, “low state” and “flare” spectra are con- sidered. Data from Mkn 421 [5], Mkn 501 [6], 1ES 2344+514 [7], 1ES 1959+650 [8], PKS 2155- 304 [9], 1H 1426+428 [10], PKS 2005-489 [11], 1ES 1218+304 [12], H 2356-309 & 1ES 1101-232 [13], PG 1553+113 [14], Mkn 180 [15], PKS 0548- 322 [16], BL Lac [17], and 1ES 1011+496 [18]
have been included. Throughout this study, the unknown-redshift object PG 1553+113 is assumed at several possiblez values, but not included fur- ther unless explicitly stated otherwise. The ex- tracted observables are the intrinsic luminosity at 500 GeV and the intrinsic photon indexΓin the re- gion around 500 GeV. For both, no extrapolations 1. See http://www.mppmu.mpg.de/∼rwagner/sources/
for an up-to-date list.
A SYNOPTICVHE BLAZARSTUDY
] s-1 [erg sr-1 LX ν
1044 1045 1046
]-1 s-1 [erg srγLγν
1043 1044 1045
(z=0.3 a ssumed)
(z=0.1 a ssumed)
X
Figure 1: νγLγ vs. νXLX. The symbols are explained in Fig. 2.
The PG 1553+113 points are for assumedz= 0.1andz= 0.3.
Mkn 421 Mkn 501 2344+514 Mkn 180 1959+650 BL Lac 2005-489 2155-304 1426+428 2356-309 1218+304 1101-232 1011+496 1553+113
1043 1044 1045 1046
ΓIntrinsic photon index
0.5 1 1.5 2 2.5 3 3.5 4 4.5
-1] -1 s [erg sr Lγ νγ
1043 1044 1045 1046
ΓIntrinsic photon index
0.5 1 1.5 2 2.5 3 3.5 4 4.5
-1] -1 s [erg sr Lγ νγ
10L
⋅ log + m Γ0 Γ =
4.64
± = 25.47 Γ0
0.10
± m = -0.52
= 24.91/17 red χ2
Mkn 421 Mkn 501 2344+514 1959+650
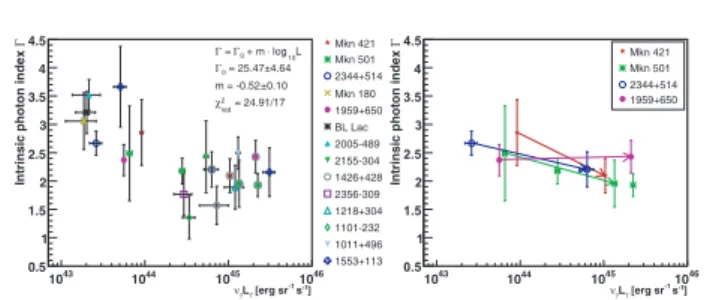
Figure 2: Photon index vs. νγLγ. Additional flare states of sources are marked by gray circles. The PG 1553+113 points are not included in the fit. Right: Four blazars with low and high states.
beyond the spectral fits are required. The resulting intrinsic photon indices vary fromΓ = 1.5−3.3. In most current acceleration models onlyΓ >1.5is allowed. This goes in line with indications that the EBL absorption effects are still smaller than mod- eled [13].
Correlation of X-ray and γ-Ray Lumi- nosity
In SSC models, the X-ray and the VHE emission are closely connected, owing to their common ori- gin. Fig. 1 showsνγLγversus the X-ray luminos- ity at 1 keV (νXLmathrmX; from Costamante &
Ghisellini 2002). A trend towards a correlation is visible, even though a strong correlation might not even be expected due to different magnetic fields in the individual objects. Note that high thermal con- tributions at 1 keV are unlikely and would imply a very high amount of gas and pressure.
Correlation between Photon Index and γ-Ray Luminosity
Fig. 2 relates the intrinsic photon indices Γ to νγLγ. A correlation on the3.3σ level is found, which, within SSC models, is compatible with a moving IC peak towards higher energies and an IC peak energy<500GeV. Sources with observed spectra at individual distinct flux states support this correlation. Mkn 501 and 1ES 2344+514 show a similar change in spectral slope and a luminosity increase of∆(νγLγ)≈20. The luminosity increase of Mkn 421 is much lower with∆(νγLγ)≈10.
Correlations of γ-Ray Emission with the BH Properties and z
The properties of blazar γ-ray emission are ex- pected to be connected to BH properties, likeM•
and its spin, since scaling laws govern BH physics, in particular length and time scales [20]. Currently, onlyM• can be reliably estimated. The BH spin remains inaccessible by large; the accretion rate might be indirectly accessible through the (radio) jet power. A first study of the connection of source properties andM•of the then-established five TeV blazars [21] did not find any correlations, except for an indication of a connection between the X- ray flare duty cycle andM•(see below).
Fig. 3 shows the correlation ofΓ andνγLγ with M• and also tests for possible correlations with z. The latter are not expected from physics, but may identify selection effects in the data sample and/or an inaccurate EBL model. Only sources with hard intrinsic spectra are visible at large dis- tances (z > 0.1), because soft spectra more eas- ily fall below the current instrumental sensitivity limits. Another explanation for the prevalent hard spectra at largez is an overcorrection of the EBL attenuation effects. None of the nearby sources, for which no strong EBL modifications apply, showΓ much smaller than 2.0. Additionally, the detected number of objects with soft spectra increased sub- stantially since 2002.
While there is no obvious correlation betweenM•
and the VHE γ-ray luminosity, it might be that the current data populate only a certain area in the M•—Γplane. Owing to the large uncertainties of theM• determination and the still poor statistics,
30THINTERNATIONALCOSMICRAYCONFERENCE
7.8 8 8.2 8.4 8.6 8.8 9 9.2
ΓIntrinsic photon index
1 1.5 2 2.5 3 3.5 4
Photon index vs. M
7.6 7.8 8 8.2 8.4 8.6 8.8 9 9.2 ]-1 s-1 [erg srγLγν
1043
1044
1045
Luminosity vs. M
Mkn 421 Mkn 501 2344+514 Mkn 180 1959+650 BL Lac 2005-489 2155-304 1426+428 2356-309 1218+304 1101-232 1011+496 1553+113
Redshift z
0.03 0.1 0.2 0.3
ΓIntrinsic photon index
0.5 1 1.5 2 2.5 3 3.5 4
4.5 Photon index vs. redshift
log(M /M ) log(M /M )
Figure 3: Correlations ofΓ,νγLγwithM•,z. PG 1553+113 at assumedz= 0.1andz= 0.3.
the future will have to show if such trends are real.
Perhaps the VHEγ-ray emission is more sensitive to the BH spin, the accretion rate or, more impor- tantly, to the acceleration environment rather than the BH mass. Also results on timing properties (see below) support such claims.
An Upper Redshift Limit for PG 1553+113
PG 1553+113 is a recently discovered TeV blazar [14] with unknown distance. With increasing red- shift z, the intrinsic luminosity has to increase stronger than quadratic (νγLγ≥4πd2·E2F) due to EBL absorption as to sustain the measured VHE flux (Fig. 4). We assume here that PG 1553+113 is an “off the shelf” blazar, i.e. with no extraordinar- ily highL. This assumption is difficult to quantify, but when translating it into the limit thatLis not more than 30 times higher than the highest lumi- nosities observed, one obtainsz <0.48(2σlimit).
An extreme luminosity 1000-times higher yields a limit of z < 0.68. Among the extreme BL Lac objects we find(νγLγ)max <1045.4erg sr−1s−1 for Mkn 501 in the flare state. These limits do not only depend on a good knowledge of the EBL at- tenuation over a wide range in redshift, but also on an assumed reasonable maximum VHE blazar luminosity that is strongly dependent on the jet Doppler factorδ. In any case, either a strikingly high luminosity or a very highδis needed should PG 1553+113 be more distant thanz >0.35. Pre- sumably such very extreme objects are so rare that a sufficiently large volume had to be probed to find one of them.
Redshift z
0 0.1 0.2 0.3 0.4 0.5 0.6 0.7
])-1 s-1 [erg srγLγνlog(
42 43 44 45 46 47 48 49 50
51 distance + EBL best fit distance + EBL low distance only
sensitivity limit
Mkn 421 Mkn 501 2344+514 Mkn 180 1959+650 BL Lac 2005-489 2155-304 1426+428 2356-309 1218+304 1101-232 1011+496 1553+113
Figure 4: Luminosity evolution for PG 1553+113 at different assumed source distances.
X-ray Duty Cycle and VHE Variability Time Scale
Following a method described in [21] we deter- mine the time fraction at which the 2-10 keV flux exceeds 50% of the average flux (“duty cycle”, DC). In addition we require this deviation to be significant (S >3σ). Note the outstanding DC of Mkn 421. Supporting the claim that variability is a defining property of BL Lacs, a flat distribution of the DC inνγLγis found (Fig. 5). A previous study [21] including Mkn 421, Mkn 501, 1ES 2344+514, 1H 1426+428 and 1ES 1959+650 only had found indications for an anticorrelation of DC andM•, which in our enlarged sample is weakened mainly by the recently discovered sources H 2356-309, PKS 0548-322, and BL Lacertae.
Turning to the minimum VHE variability timescales τ, these do not scale with M•. This implies that flares originate from a much smaller region than the BH radius and (more importantly) that the BH properties do not influence the emis- sion process too much, but the jet environment may be more important. Note that, in spite of the
A SYNOPTICVHE BLAZARSTUDY
expected scaling behavior the TeV blazars hosting the more massive BH, Mkn 501 and Mkn 421, seem to exhibit the smallestτ. This, however, may be a selection effect caused (1) by their proximity, and (2) by instrumental sensitivity, as small τ measurements require strong sources. The latter also disables strong claims aboutτ-luminosity cor- relations yet, and allτvalues are to be understood as upper limits.
7.6 7.8 8 8.2 8.4 8.6 8.8 9 9.2
Duty cycle
0.05 0.1 0.15 0.2 0.25 0.3 0.35
Duty cycle vs. M
] s-1 [erg sr-1 Lγ νγ
1044 1045
Duty cycle
0.05 0.1 0.15 0.2 0.25 0.3 0.35
Mkn 421 Mkn 501 2344+514 Mkn 180 1959+650 BL Lac 2005-489 2155-304 1426+428 2356-309 1101-232 1011+496 1553+113 0548-322
Duty cycle vs. luminosity
7.6 7.8 8 8.2 8.4 8.6 8.8 9 9.2
[d]τ
10-3 10-2 10-1 1 10 102 103
VHE time scale vs. M
-1] -1 s [erg sr Lγ νγ
1043 1044 1045
[d]τ
10-3 10-2 10-1 1 10 102 103
VHE time scale vs. luminosity
log(M /M ) log(M /M )
Figure 5: Correlations of X-ray duty cycle and VHE variability scales withM•andνγLγ.
Conclusions and Outlook
The observation of VHE blazars has started to become less biased: Not only blazars with hard spectra or in a flaring state are now detected, but a much higher dynamical range of VHE γ emission levels and states is probed, flare statis- tics studies (e.g. [22]) are within reach, and generic blazar properties start to become accessi- ble. Thus the era of VHE blazar astronomy has been entered—astronomy being understood as the study of generic properties of a given class of ob- jects.
Acknowledgments
The author thanks E. Lorenz, H. Meyer, and W.
Bednarek for discussions and useful comments.
References
[1] Urry, C. M. & Padovani, P., 1995,PASP, 107, 803
[2] Tremaine, S., et al., 2002, ApJ, 574, 740;
Falomo, R.,et al., 2002,ApJL, 569, L35; Wu, X.-B.,et al., 2002,A&A, 389, 742; Barth, A.
J.,et al., 2003,ApJ, 583, 134
[3] Hauser, M.G.&Dwek, E., 2001, ARA&A, 39, 249
[4] Kneiske, T.M.,et al., 2004,A&A, 413, 807 [5] Aharonian, F. A., et al., 1999, A&A, 350,
757; Krennrich, F.,et al., 2002,ApJL, 575, L9
[6] Aharonian, F. A., et al., 2001, ApJ, 546, 898; Aharonian, F. A., et al., 1999, A&A, 342, 69; Paneque, D., et al., these proceed- ings (#1098); Albert, J., et al., 2007, ApJ, 669, in press
[7] Schroedter, M., et al., 2005,ApJ, 634, 947;
Wagner, R. M. & Meyer, M., these proceed.
(#71); Albert, J.,et al., 2007,ApJ, 662, 892 [8] Albert, J.,et al., 2006,ApJ, 639, 761; Daniel,
M. K.,et al., 2005,ApJ, 621, 181
[9] Aharonian, F. A.,et al., 2005,A&A, 430, 865 [10] Horan, D.,et al., 2001 In27th ICRC, Ham- burg, Germany, 2622; Aharonian, F. A., et al., 2002,A&A, 384, L23
[11] Aharonian, F. A.,et al., 2005,A&A, 436, L17 [12] Albert, J.,et al., 2006,ApJL, 642, L119 [13] Aharonian, F.A., et al., 2006, Nature, 440,
1018
[14] Wagner, R. M., et al., these proceedings (#72); Albert, J., et al., 2007, ApJL, 654, L119
[15] Albert, J.,et al., 2006,ApJL, 648, L105 [16] Giebels, B., 2006, In2nd Workshop On TeV
Particle Astrophysics, Madison, WI, USA [17] Hayashida, M. et al.,et al., these proceedings
(#946); Albert, J.,et al., 2007,ApJL, 666, in press, arXiv:astro-ph/0703048
[18] Mazin, D.,et al., these proceedings (#936);
Albert, J., et al., 2007, ApJL accepted, arXiv:0706.4435 [astro-ph]
[19] Costamante, L. & Ghisellini, G., 2002,A&A, 384, 56
[20] Mirabel, I.F. & Rodr´ıguez, L.F., 1999, ARA&A, 37, 409
[21] Krawczynski, H.,et al., 2004,ApJ, 601, 151 [22] Goebel, F.,et al., these proceedings (#928)