P HYSIK -D EPARTMENT
Observation of VHE Ȗ –Rays from the Vicinity of magnetized Neutron Stars
and
Development of new Photon-Detectors for Future Ground based Ȗ –Ray Detectors
Dissertation von
Adam Nepomuk Otte
T ECHNISCHE U NIVERSITÄT
M ÜNCHEN
Technische Universit¨ at M¨ unchen
Max-Planck-Institut f¨ ur Physik (Werner-Heisenberg-Institut)
Observation of VHE γ -Rays from the Vicinity of magnetized Neutron Stars
and
Development of new Photon-Detectors for Future Ground based γ -Ray Detectors
Adam Nepomuk Otte
Vollst¨andiger Abdruck der von der Fakult¨at f¨ur Physik der Technischen Universit¨at M¨unchen zur Erlangung des akademischen Grades eines
Doktors der Naturwissenschaften genehmigten Dissertation.
Vorsitzender: Univ.-Prof. Dr. H. Friedrich Pr¨ufer der Dissertation:
1. Hon.-Prof. Dr. S. Bethke 2. Univ.-Prof. Dr. F. v. Feilitzsch
Die Disseration wurde am 8. 6. 2007 bei der Technischen Universit¨at M¨unchen eingereicht und am 14. 9. 2007 durch die Fakult¨at f¨ur Physik angenommen.
For Pia
The reasonable man adapts himself to the world; the unreasonable one persists in trying to adapt the world to himself. Therefore, all progress depends on the unrea- sonable man.
George Bernard Shaw
Irish dramatist & socialist (1856 — 1950)
Summary
This thesis reports on the measurement of Very High Energy (VHE)-γ-rays produced in the vicinity of magnetized, spinning neutron stars with the Major Atmospheric Gamma-ray Imaging Cherenkov telescope (MAGIC). In the second part the results of the development of a novel semiconductor photon detector for future improved IACTs (as well as for other detectors requiring low level light detection) are presented.
In the observational part of this thesis three pulsars are studied in the energy range between 60 GeV and several TeV: The Crab, PSR B1951+32 and PSR B1957+20.
It was a goal of this thesis to detect for the first time aγ-ray pulsar with a ground based experiment.
For this purpose special tools were developed and a dedicated analysis chain was arranged. An event cleaning method was developed that efficiently suppresses noise of the night sky and allows one to lower the analysis threshold of MAGIC to below 100 GeV.
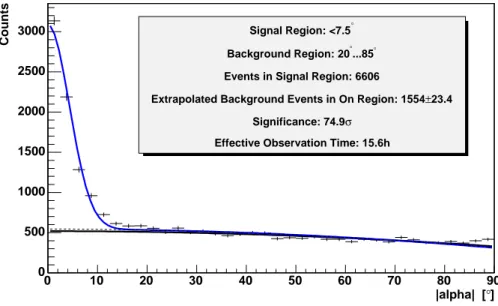
The Crab nebula is the strongest known source of VHE γ-rays in our Galaxy. Here I present results from 16 hours of observation performed between October and December 2005. Gamma-ray emission from the nebula was detected with a significance of 75σ. The energy flux of the nebula was reconstructed between 60 GeV and 9 TeV. At present this is the measurement with the lowest energy threshold of any air Cherenkov telescope and closes nearly the gap between EGRET satellite observations (up to 10 GeV). The energy spectrum is well described with a variable power-law,
dF
dE = (6.0±0.2stat)×10−10
E 300 GeV
−(2.31±0.06stat±0.2syst)−(0.26±0.07stat) log(300 GeVE )
cm−2s−1TeV−1 with a systematic error on the energy scale of 27%. The spectrum shows a clear softening towards higher energies. The measurement excludes certain scenarios in which Bremsstrahlung contributes significantly to the VHEγ-ray flux at GeV energies. The measured spectrum is in agreement with predictions by the Synchrotron Self Compton (SSC) model.
The inverse Compton scattering peak (IC-peak) was determined at 77±47stat+107
−46 systGeV. This is the first determination of the IC-peak. The measured position is in agreement with predictions.
For the first time the γ-ray flux from the nebula above 200 GeV was tested for variability on timescales between several minutes and months. At all tested timescales the flux is consistent with a steady source scenario. If variability exists then the flux should change in the observed time scales by less than 10%. The integral flux>200 GeV is:
F>200 GeV = (1.96±0.05stat)×10−10cm−2sec−1 .
For the first time the morphology of theγ-ray emission was studied in the energy range between 100 GeV and 1 TeV. Within systematic uncertainties of 1, the center of gravity of the emission coincides with the position of the Crab pulsar. The emission appears pointlike within the angular resolution of the MAGIC telescope. At 100 GeV the 39% containment radius of the emission region could be restricted to be less than 5.2. At ∼ 250 GeV and> 500 GeV the size of the emission
by the SSC model.
Optical pulsation of the Crab pulsar was observed by the MAGIC camera central pixel, which was specially modified for such a study. The effective observation time of the measurement was only
∼1 second. In the reconstructed light curve the position of the main pulse is offset in phase by φ=−0.0075±0.0015 from its corresponding position in the radio range. This indicates that the optical emission comes from a region of about 75 km above the emission region in radio or that the radio and optical beams are offset by 2.7◦ to each other.
Pulsed VHE-γ-rays emission from the Crab pulsar was not detected. However, with an analysis optimized for the lowest energies, the data indicate that pulsed emission is present at the same position in the pulse phase profile where EGRET detected pulsed emission in the highest energy data bin (mean energy ∼5 GeV). The significance of the signal is 3σ under the assumption that pulsed emission is expected in the phase regions−0.06−0.04 and 0.32−0.43, coinciding with the EGRET observations.
Under the assumption that the energy spectrum of the pulsar is attenuated by an exponential cutoff the cutoff energy could be constrained to be less than 30 GeV. If the spectral shape follows a super-exponential behavior a cutoff energy as high as 65 GeV cannot be excluded.
PSR B1951+32has a characteristic age of 105years and is, therefore,≈100 times older than the Crab pulsar. The pulsar was detected with the EGRET instrument on board CGRO up to 20 GeV without an indication of a cutoff in the energy spectrum. This observations and predictions for γ-ray fluxes from the pulsar wind nebula were strong arguments for a deep (31 hours) observation with MAGIC. However, VHE γ-ray emission was not detected from the pulsar or the pulsar wind nebula. The observation excludes the current predictions for γ-ray emission and shows that more complex scenarios as e.g. the movement of the pulsar through the interstellar medium have to be taken into account for a correct modelling of the system.
The third pulsar analyzed, PSR B1957+20, is part of a binary system. The millisecond pulsar is orbited by a low mass companion with 0.022 M within 9.2 hours. In earlier observations a detection ofγ-ray emission from the Lagrange point L4 was claimed. The orbit was about evenly covered with a 13 hour long observation. VHE γ-ray emission was not detected. A search for pulsedγ-ray emission could not be performed due to the unavailability of valid ephemeris of the pulsar and binary system. The flux limit obtained in an analysis in search for steadyγ-ray emission does not constrain the predictedγ-ray flux level predicted from the pulsar.
VHEγ-ray astronomy experienced an incredible boost when the second generation of Cherenkov telescopes came online three years ago. These instruments have about an order of magnitude higher sensitivity compared to their precursor experiments. Much of the improvement can be attributed to a higher photon collection efficiency, due to larger reflector surfaces and better cameras. However, even the most recent experiments detect only a small fraction of about 0.1% of all Cherenkov photons. An improvement in sensitivity and in lowering the threshold energy of future ground based experiments can be expected with new solid state photon detectors, which are three to four times more sensitive than classical PMTs. This was the main motivation to investigate new photon detector concepts.
Following a short review about the requirements of photon detectors in air Cherenkov telescopes I present results from the development of a new semiconductor photon detector, the back side illu- minated silicon photomultiplier (BaSiPM). In this concept a photon converts in the fully depleted detector volume and the generated photoelectron drifts into one out of many small avalanche re- gions on the opposite side of the photon entrance window. The avalanche regions operate in limited Geiger mode.
With finite element simulations a BaSiPM was developed, which meets the requirements in air Cherenkov telescopes. The device features>95 % photoelectron collection efficiencies, time reso- lutions∼2 nsec and a homogenous electric field in the avalanche region. The simulated structure
was translated into a technology and avalanche structures were produced with several combinations of integrated resistors and capacitors.
In the evaluation of selected test structures a linear dependence of the output amplitude on the applied bias voltage above breakdown voltage was found. The analyzed structures feature gains of up to 107. The output signal was compared to a small signal model of the avalanche structure and found to be in good agreement with the model. Based on these comparison it can be deduced that a Geiger breakdown is quenched in the analyzed structure (area of avalanche region∼80μm2) if the current flowing through the junction is limited to 2. . .10μA.
For one test structure with 80μm2 sensitive area the dark rates were measured at room temper- ature as a function of the bias voltage. The dark rate increases from 300 counts per second at an overvoltage of 7.5% above breakdown voltage to 5000 counts per second at 23% overvoltage.
Starting from about 20% overvoltage the dark rate is dominated by afterpulsing. The afterpulsing effect can be reduced with smaller capacitances in future structures and will not be a limiting factor for the performance of the final device.
A Monte Carlo simulation of SiPM called SiSi was developed. SiSi simulates the so-called optical crosstalk effect. The output of the simulations was compared with the measured crosstalk char- acteristics of a prototype SiPM. It was found that only photons with energies between 1.2 eV and 1.4 eV contribute to optical crosstalk. This can be explained with the very strong energy depen- dence of the photon absorption length in silicon. It was found that photons with energies between 1.2 eV and 1.4 eV are emitted with an intensity of 2.5·10−5photons per avalanche carrier crossing the junction during breakdown. This is about a factor of five higher intensity than obtained by another group. The measurement is dominated by systematic uncertainties in the geometry of the studied SiPM. The measured photon production efficiency is, therefore, uncertain by a factor of two. Simulating the crosstalk behavior of a BaSiPM it was found that for a sufficient suppression of optical crosstalk the simulated BaSiPM has to operate at a gain of∼104 .
In parallel to the BaSiPM development also some studies of normal front-illuminated SiPM have been carried out, which are presented in the Appendix. As one example for the application of SiPM the first ever feasibility study of SiPM as readout element in positron emission tomography is presented (this study has been published in NIM, Otte et al., 2005). An energy resolution of 22%1 FWHM for a 511 keV annihilation line and a time resolution of (1.51±0.07) nsec was found when reading out the scintillation signal of LYSO crystals. The results are comparable with the performance of classical APDs as readout elements but the handling was found to be much easier due to the much lower bias voltage and the much higher noise immunity.
A new method to measure the photon detection efficiency is presented (the method has been published in NIM, Otte et al., 2006). The procedure can be used to characterize photon detectors with single photoelectron resolution. The photon detection efficiency of a hybrid photo-detector was found to be 15% less than the quantum efficiency of its photo cathode. This can possibly be attributed to the backscattering effect and a small inefficiency to focus all photoelectrons onto the anode area. The photon detection efficiency of a SiPM with 10% geometrical efficiency was measured. At an overvoltage of 3.5% above breakdown voltage, the device showed a peak photon detection efficiency of∼3.5% at 609 nm. Increasing the overvoltage to 7%, the photon detection efficiency increased to 6.5% with an indication of a saturating photon detection efficiency.
1improved to 12.5% in later studies
Publications
Parts of this thesis are published in the following reviewed articles:
1. VHE γ-Ray Observation of the Crab Nebula and Pulsar with MAGIC J. Albert, et al. (MAGIC collaboration); corresponding author: A. N. Otte submitted to ApJ, arXiv:0705.3244 [astro-ph], 2007
2. Constraints on the steady and pulsed VHE γ-Ray Emission from Observation of PSR B1951+32 / CTB 80 with the MAGIC Telescope
J. Albert, et al. (MAGIC collaboration); corresponding author: A. N. Otte submitted to ApJ, astro-ph/0702077, 2007
3. Prospects of using Silicon Photomultipliers for the Astroparticle Physics Exper- iments EUSO and MAGIC
A. N. Otte et al.
IEEE Trans. Nucl. Sci.,53636–640, 2006.
4. A Measurement of the Photon Detection Efficiency of Silicon Photomultipliers A. N. Otte et al.
Nuclear Instruments and Methods in Physics Research A,567360–363, November 2006.
5. A Test of Silicon Photomultipliers as Readout for PET A. N. Otte et al.
Nuclear Instruments and Methods in Physics Research A,545705–715, June 2005.
Contents
1 Goals of this Thesis 1
1.1 Detection ofγ-Ray Emission from Pulsars and their Nebulae . . . 1
1.2 Development of a novel Semiconductor Photon Detector for Future Experiments in Astroparticle Physics . . . 2
1.3 Structure of this Thesis . . . 2
2 Short Introduction to Very High Energy γ-Ray Astrophysics 3 2.1 VHEγ-Ray Astrophysics . . . 3
2.2 Cosmic Rays . . . 4
2.2.1 Sources of Cosmic Rays . . . 5
2.3 Production Mechanisms of VHEγ-Rays . . . 6
2.3.1 Interaction of charged Particles with Electromagnetic Fields . . . 7
3 Pulsars and their Nebulae 9 3.1 Introduction to Pulsars and their Nebulae from a historical Point of View . . . 10
3.2 Neutron Stars . . . 11
3.2.1 Formation of a Neutron Star . . . 11
3.2.2 Evolution of Neutron Stars in Binary Systems to Millisecond Pulsars . . . . 11
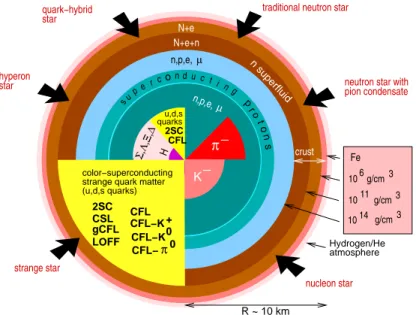
3.2.3 Structure of a Neutron Star . . . 12
3.2.4 Magnetosphere of a Neutron Star . . . 13
3.2.5 Energy Loss of a rotating and magnetized Neutron Star . . . 13
3.3 Overview of the Pulsar Wind Nebula Complex . . . 15
3.4 γ-Ray Emission in the Magnetospheres of Pulsars . . . 16
3.4.1 The experimental View . . . 16
3.4.2 The theoretical View . . . 17
3.5 VHE-γ-Ray Emission in the Pulsar Wind Nebula . . . 21
3.5.1 VHE-γ-ray Emission of the Crab Nebula . . . 21
4 The Imaging Air Shower Cherenkov Telescope Technique and the MAGIC Tele-
scope 25
4.1 Air Showers . . . 26
4.1.1 Air Shower Detection Techniques . . . 26
4.1.2 Properties of Air Showers . . . 27
4.1.3 Cherenkov Light Emission in Air Showers . . . 28
4.1.4 The Night Sky Background Light . . . 31
4.2 The MAGIC Telescope . . . 31
4.2.1 The Reflector and Telescope Frame . . . 31
4.2.2 The Camera . . . 33
4.2.3 Signal Processing, Recording and Trigger . . . 34
5 Data Analysis Methods and Telescope Performance 37 5.1 Signal Extraction and Reconstruction . . . 37
5.1.1 Signal Extraction . . . 38
5.1.2 Conversion of Signal Amplitude into Photoelectrons . . . 38
5.2 Event Cleaning . . . 39
5.2.1 Standard Image Cleaning . . . 40
5.2.2 Image Cleaning using additional Time Information . . . 40
5.3 Image Parametrization . . . 42
5.4 Gamma Hadron Separation and Energy Estimation . . . 45
5.4.1 The Random Forest Method . . . 45
5.5 Extraction of theγ-ray signal . . . 49
5.5.1 Optimal Cut inAlpha . . . 49
5.6 Sky Maps . . . 50
5.7 Calculation of an Energy Spectrum . . . 52
5.8 Pulsar Analysis . . . 52
5.8.1 Time Correction of Signal Propagation Delays . . . 53
5.8.2 Correlating the Event Time with the Period of the Pulsar . . . 54
5.8.3 Tests for the Search of pulsed Emission . . . 54
5.8.4 A Method to derive an Upper Limit on the Cutoff Energy of the Pulsar Energy Spectrum . . . 57
5.8.5 Optimization of the upperSize-Cut in the Search for pulsed Emission from a Pulsar . . . 57
5.9 Upper Limit Calculation . . . 58
5.10 Systematic Errors . . . 58
5.10.1 Effects that influence the Energy Reconstruction . . . 59
CONTENTS
5.10.2 Effects that Influence the Flux Reconstruction . . . 60
5.11 Performance of the MAGIC Telescope . . . 60
5.11.1 Sensitivity of the MAGIC Telescope derived from Observations of the Crab Nebula . . . 61
5.11.2 Comparison of Monte Carlo Data with real Data . . . 64
6 The Crab Nebula and Pulsar 71 6.1 Introduction . . . 71
6.1.1 The Crab Nebula . . . 72
6.1.2 The Crab Pulsar PSR B0531+21 . . . 72
6.1.3 Objectives of the Analysis . . . 72
6.2 The Data Sample and related Information . . . 73
6.2.1 Selection Criteria applied to the Data Sample . . . 73
6.2.2 Radio Ephemeris of the Crab Pulsar . . . 74
6.3 Analysis of theγ-Ray Emission from the Crab Nebula between 60 GeV and 9 TeV 75 6.3.1 The Energy Spectrum . . . 75
6.3.2 Search for Flux Variabilities . . . 81
6.3.3 Morphology of theγ-Ray Emission Region . . . 81
6.4 Optical Observations of the Crab Pulsar with MAGIC . . . 87
6.4.1 Setup of the Central Pixel of the MAGIC Camera . . . 88
6.4.2 Data taken with the Central Pixel and reconstructed Light Curve of the Crab Pulsar . . . 89
6.4.3 Absolute Position of the Main Pulse in the optical Light Curve of the Crab Pulsar . . . 89
6.5 Search for pulsedγ-Ray Emission from the Crab Pulsar . . . 91
6.5.1 Search for pulsed VHE γ-Ray Emission in differential Bins of estimatedγ- Ray Energy . . . 91
6.5.2 Upper Limit on the Cutoff Energy of the pulsedγ-Ray Emission of the Crab Pulsar . . . 91
6.6 Discussion . . . 95
7 Study of the Pulsar PSR B1951+32 and associated Pulsar Wind Nebula 97 7.1 Introduction . . . 98
7.1.1 The Pulsar PSR B1951+32 . . . 98
7.1.2 The Interaction of the Pulsar with its surrounding Medium . . . 98
7.2 Selection and Processing of the Data Sample . . . 98
7.2.1 Summary of the Data Sample . . . 98
7.2.2 Processing of the Data . . . 99
7.3 Search for steadyγ-Ray Emission from the Pulsar Wind Nebula . . . 100
7.3.1 Steadyγ-Ray Emission from the Location of the Pulsar . . . 100
7.3.2 Search forγ-Ray Emission in the Vicinity of PSR B1951+32 . . . 101
7.4 Search forγ-Ray Emission from the Pulsar . . . 101
7.5 Discussion . . . 103
8 The Black Widow Pulsar PSR B1957+20 109 8.1 Introduction . . . 109
8.2 Selection and Processing of the Data Sample . . . 111
8.3 Search for steadyγ-Ray Emission . . . 111
8.4 Search forγ-Ray Emission from the Pulsar . . . 113
8.5 Discussion . . . 113
9 A novel Photon Detector Concept for Experiments in High Energy Physics 117 9.1 Need for new Photon Detectors for VHEγ-Ray Astronomy . . . 117
9.2 Photon Detector Requirements for Imaging Air Cherenkov Telescopes e.g. as for a MAGIC Type Telescope . . . 118
9.3 The Concept of the Silicon Photomultiplier . . . 119
9.4 Characteristics of the Silicon Photomultiplier . . . 121
9.4.1 The Principle of the Geiger Avalanche Diode . . . 121
9.4.2 A Small Signal Model of the Silicon Photomultiplier . . . 123
9.4.3 The Photon Detection Efficiency of SiPMs . . . 125
9.4.4 Optical Crosstalk . . . 127
9.4.5 Dynamic Range Limitation . . . 129
10 Development and Evaluation of an Avalanche Structure for a BaSiPM 131 10.1 The Back Side illuminated Silicon Photomultiplier . . . 131
10.1.1 Principle . . . 132
10.1.2 Characteristics . . . 132
10.2 Design and Simulation of one Cell . . . 133
10.2.1 Requirements of an Avalanche Structure for a BaSiPM . . . 133
10.2.2 Simulated and Evaluated Avalanche Structures . . . 133
10.2.3 Study of the Electron Collection Properties . . . 134
10.2.4 The predicted Electric Field in the Avalanche Region . . . 138
10.2.5 Simulated Characteristics during Breakdown . . . 139
10.3 Test Structures . . . 139
10.3.1 Technology for the Production of the simulated Avalanche Structure . . . . 140
CONTENTS
10.3.2 Designed Test Structure . . . 142
10.4 Evaluation of the Test Structures . . . 143
10.4.1 Dependence of the Signal Charge and Amplitude on Bias . . . 143
10.4.2 Recovery of the Electric Field in the Avalanche Region after Breakdown . . 144
10.4.3 Shape of the Output Signal . . . 146
10.4.4 Comparison of the Output Signal with the small Signal Model . . . 147
10.4.5 The Dark Count Rate . . . 149
10.4.6 Afterpulsing . . . 150
10.5 Influence of Optical Crosstalk in Back Side illuminated SiPM . . . 151
10.5.1 Simulation of Optical Crosstalk in Silicon Photomultipliers with the Simula- tion Code “SiSi” . . . 152
10.5.2 Study of the Production Efficiency and the effective spectral Temperature of the Photons produced in Avalanches . . . 155
10.5.3 Prediction of Optical Crosstalk Behavior of a Back Side illuminated Silicon Photomultiplier . . . 161
10.6 Discussion . . . 162
10.6.1 About the Development of an Avalanche Structure for a BaSiPM . . . 162
10.6.2 About Optical Crosstalk . . . 163
11 Concluding Remarks 167 A A Test of Silicon Photomultipliers as Readout for PET 169 A.1 Introduction . . . 169
A.2 The SiPM used in the Test Setup . . . 170
A.3 Experimental Setup . . . 171
A.3.1 Mechanics . . . 171
A.3.2 Signal Readout . . . 171
A.4 Energy Resolution and Calibration . . . 172
A.5 Influence of the Recovery Time on the measured Spectrum . . . 175
A.6 Time Resolution . . . 176
A.7 Position Resolution of a Point Source . . . 176
A.8 Conclusions and Discussion of the Results . . . 177
B A new Method to measure the PDE of Photon Detectors with Single Photon Resolution 181 B.1 Introduction . . . 181
B.2 Measurement Principle . . . 181
B.3 Measurement Procedure . . . 183
B.3.1 Mechanical Setup . . . 183
B.3.2 Calibration of the Setup . . . 184
B.3.3 Measurement Procedure of the PDE . . . 185
B.4 Results . . . 185
B.4.1 PDE of a HPD . . . 185
B.4.2 PDE of a SiPM . . . 186
B.5 Summary . . . 187
C Central Pixel 189 C.1 Modification of the Central Pixel Readout . . . 189
C.1.1 Test of the Drift of the MAGIC System Clock . . . 189
C.1.2 Sensitivity of the Central Pixel . . . 190
C.1.3 Future Improvements of the Central Pixel . . . 191
Acknowledgement 209
List of Figures
2.1 Main scientific targets of VHE γ-ray astrophysics that are addressed by current ground basedγ-ray experiments. . . 3 2.2 Energy spectrum of the cosmic rays. Note that for better visibility of structures,
the spectrum is multiplied with energy to the power of three. from Blasi (2005) . . 4 2.3 The Hillas plot shows up to which energies cosmic objects can in principle confine
cosmic rays. First compiled by Hillas (1984) . . . 5 2.4 Schematic illustration of the main processes ofγ-ray production. from Tonello (2006) 6 3.1 Cover of ”Unknown Pleasures”the first album by Joy Division, released in 1979. It
shows 100 hundred radio pulses of the first discovered pulsar PSR B1919+21. . . . 9 3.2 Possible evolutions of a pulsar in a binary system (Lorimer, 2005). . . 12 3.3 Competing structure and novel phases of subatomic matter of neutrons stars pre-
dicted by theory (from Weber, 2005) . . . 13 3.4 Calculations by Spitkovsky (2006) of the magnetosphere of an oblique rotator (60◦
inclination) in the corotating frame. Color represents the toroidal field. A sample three-dimensional flux tube is traced in white. . . 14 3.5 Schematic view of the pulsar-wind-nebula complex and the emitted radiation (adapted
from Aharonian and Bogovalov, 2003). Note that the graph is not to scale. Indicated dimensions are valid for the Crab nebula. . . 15 3.6 Pulse phase profiles of the six pulsars detected by EGRET in γ-rays above 5 GeV
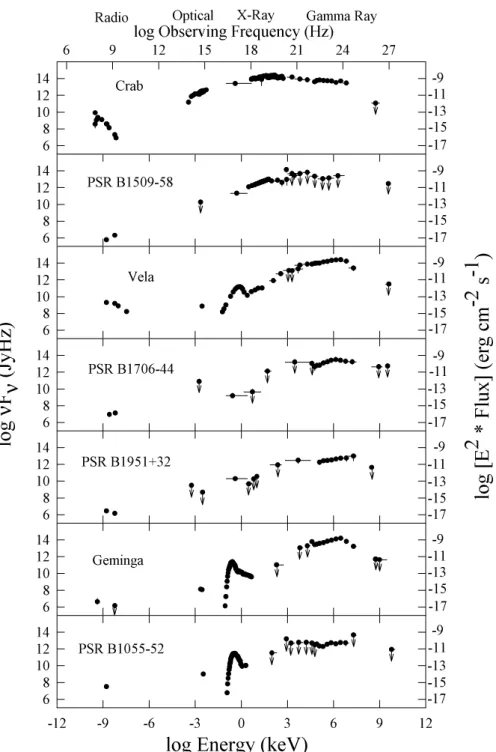
(black) and above 100 MeV (yellow). Each panel shows one full rotation of the neutron star. From Thompson (2004). . . 17 3.7 Broad-band spectral energy distribution of the seven γ-ray pulsars detected by
EGRET, from Thompson et al. (1999) . . . 18 3.8 Cross-section of the poloidal plane of the pulsar magnetosphere. Indicated are pos-
sible sites where an electric potential can build up and particles are accelerated.
Popular sketch by A. Harding. . . 19 3.9 Characteristic phase-averaged spectrum for a youngγ-ray pulsar. Solid lines show
the curvature spectrum (CR), the synchrotron emission (Sy) and the thermal surface flux (kT). For comparison, the dotted curve gives the mono-energetic primary cur- vature spectrum with the same cutoff energy as for curvature radiation. The dashed curve gives the TeV pulsed spectrum from Compton upscattering of the synchrotron spectrum on the primary e± (from Romani, 1996). . . 20
3.10 Expected radial distribution of the magnetic field and surface brightness of the Crab nebula in VHE-γ-rays (from De Jager and Harding, 1992). . . 22 3.11 Non-thermal radiation of the Crab Nebula. The solid and the dashed curve corre-
spond to the synchrotron and inverse Compton components of the radiation, respec- tively, calculated in the framework of the spherically symmetric MHD wind model of Kennel and Coroniti (1984a,b). Indicated with arrows are the electron energies re- lated to the peak energy of the synchrotron photons. (from Aharonian and Atoyan, 1998) . . . 23 4.1 Popular illustration of the situation encountered inγ-ray astrophysics from ground.
A γ-ray converts into a e±-pair in the atmosphere and a particle shower develops with the shower maximum in 10 km altitude. The ultrarelativistic secondary parti- cles generate Cherenkov light that propagates in a narrow cone along the primary direction. The light is illuminating an approximately circular area with a radius of
∼120 m. An imaging air Cherenkov telescope records some of the Cherenkov light with its∼100 m2 large light collector, provided the telescope is located within the
“pool” of Cherenkov light. Typically 0.1% of the Cherenkov light is recorded . . . 25 4.2 Schematic view of the development of a γ-ray induced air shower (left) and an air
shower that was started with a hadronic interaction (right). . . 27 4.3 Space Shuttle breaking the sound barrier (see faint shock wave). In the same way a
superluminal charged particle generates a photonic shockwave (Cherenkov emission) as it travels through matter. . . 28 4.4 Simulated Cherenkov photon distribution at 2200 m above sea level from one air
shower induced by a 50 GeVγ-ray of vertical incidence. The impact point of the γ-ray is at (0,0). The majority of photons arrive within a radius of 100 m from the impact point. Due to the increasing Cherenkov angle with increasing shower depth a maximum in the photon distribution is seen at the rim at∼100 m. The maximum is often referred to as the “hump”. The region closer to the shower axis collects the light principally from the shower tail, while the region up to the hump is dominated by light coming from the shower core. Beyond the hump the light comes from halo particles of the shower. . . 29 4.5 Cherenkov photon densities emitted by γ-ray showers of different energies before
absorption (solid lines) and after taking into account absorption losses in the atmo- sphere (dashed lines). The zenith angle is 0◦. (calculations done by P. Majumdar) 30 4.6 Simulation of the Cherenkov light signal from a γ-ray shower vs. γ-ray energy.
The Cherenkov signal is given in units of detected photoelectrons by the MAGIC telescope. The distances between the impact points of theγ-rays and the telescope are<150 m. The zenith angle range of the simulatedγ-rays is 0◦. . .30◦. . . 30 4.7 Photograph of the MAGIC telescope. One can make out the tesselated reflector
surface, the camera in the focal plane of the reflector, the azimuthal rail and the camera access tower in the front. . . 32 4.8 Photograph of the camera of the MAGIC telescope with opened lids while the Win-
ston cones are being installed. The inner part of the camera consists of 397 PMTs of 1that are surrounded by 180 PMTs of 1.5diameter. . . 33 4.9 Camera readout and processing of the data recorded by MAGIC (from Wagner, 2006) 34 4.10 Sketch of the trigger topology in the MAGIC camera. The inner camera is segmented
into 19 macrocells of 37 pixels each. The logic of a macrocell is based on 36 pixels.
The pixel not connected to the macrocell logic is highlighted in the figure. . . 35
LIST OF FIGURES
5.1 Illustration of the cleaning of an event . . . 39 5.2 Example of an event that has been cleaned with 6 photoelectrons (core-pixel) and
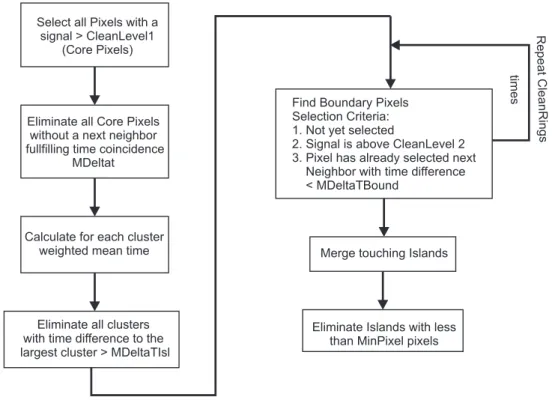
4 photoelectrons (boundary-pixel) using the standard-cleaning (left) and the time- cleaning (right). In the standard-cleaning a fluctuation in the NSB is picked up, which is suppressed in the time-cleaning. . . 41 5.3 Flowchart of the time-cleaning procedure. See text for explanation. . . 42 5.5 Examples of real shower events. From left to right: γ-ray candidate, two hadron
events, a muon. The top row shows the pixel contents in units of photoelectrons, the middle row the signal-times in units of FADC slices (1 slice = 3.3 nsec) and the bottom row the cleaned events. . . 43 5.4 Parameterization of a shower image with Hillas-parameters. . . 44 5.6 The upper plot shows the distribution of the parameterHadronnessvs.Size. The
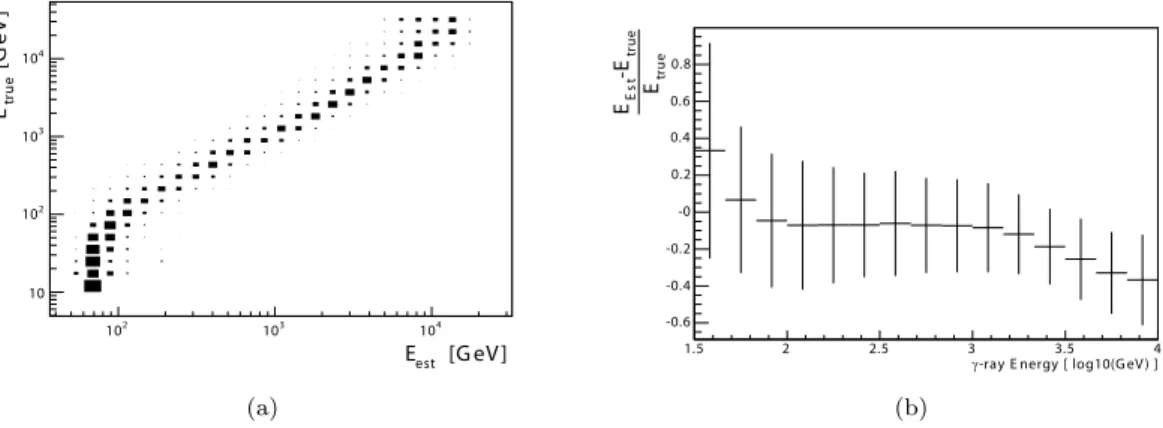
background events are marked blue and the MCγ-ray events red. Note that below aSize of 300 photoelectrons most of the background events are hidden behind the simulatedγ-ray events. For bins inSizetheHadronnesscut (black stars) is found that yields the highest quality factor (yellow dots). The dashed line is a fit to the Hadronness values. The quality factor (without an Alpha-cut) is given in the lower plot. . . 47 5.7 Left panel: true energy of aγ-ray vs. its estimated energy (migration matrix); Right
panel: profile histogram of the relative deviation between the estimated energy and the true energy of aγ-ray. The error bars denote the energy resolution. . . 48 5.8 |Alpha|-distribution of a Crab data sample (ON) and a data sample of a region in
the sky where noγ-ray source is expected (OFF). . . 49 5.9 The upper plot shows the cut in |Alpha| for different bins of Size optimized for
maximum quality factor. The corresponding quality factors are shown in the lower graph. . . 50 5.10 Size dependence of the Q-factor for optimal|Alpha|-cut,Hadronness-cut and the
Q-factor for the combination of|Alpha|-cut andHadronness-cut. . . 51 5.11 Differential collection area after hardware trigger (triangles) and after cuts and
γ/hadron-separation (circles). The collection area after cuts shrinks again at higher energies due to the requirement in the analysis that the shower image has to be fully contained within the inner camera. . . 53 5.12 Illustration of propagation delays within the solar system (from Schmidt, 2005). . . 54 5.13 Results of the H-test obtained from a Crab data sample for randomly chosen test
frequencies. . . 56 5.14 Q vs. upper Size-cut Sup. For a Size-cut of Size< 300 phe or higher maximum
sensitivity is obtained. . . 58 5.15 Collection area after optimized|Alpha|- andHadronness-cuts and an upperSize-
cut of Size<300 phe is applied. . . 58 5.16 Only about 10 VHEγ-ray sources were known in 2000 (left figure). With the new
generation of more sensitive IACTs, the number of detected sources increased to more than 40 in 2006 (right panel). . . 61 5.17 Alpha Plot of the total Crab data sample below 20◦ zenith angle. . . 63 5.18 MC-Data Comparisons of theWidth parameter in bins of Size( 6/4 cleaning) . . 66 5.19 MC-Data Comparisons of theLengthparameter in bins of Size ( 6/4 cleaning) . 67
5.20 MC-Data Comparisons of theDistparameter in bins of Size( 6/4 cleaning) . . . 68 5.21 MC-Data Comparisons of theConc2parameter in bins of Size( 6/4 cleaning) . 69 6.1 Dynamic rings, wisps and jets of electrons and positrons around the pulsar in the
Crab Nebula. Observations in X-ray light by Chandra (1999). The inner ring is about one light year across. . . 71 6.2 Differential energy spectrum of the Crab nebula between 60 GeV and 9 TeV. The
spectrum was unfolded with the method by Bertero (1989). The upper part in the figure shows in addition to the unfolded data points also results of a power-law fit and a variable power-law fit. The lower panel shows the relative residuals between the fit results and the data points. A parameterization of the spectrum with a curved power-law is favored. . . 77 6.3 |Alpha|-distribution for events with estimated energy between 80 GeV and 100 GeV.
ON Events: 292721±503, normalized OFF Events; 248380±602, Excess Events;
4341±784, Significance: 5.53, effective ontime: 58000 sec. Applied|Alpha|-cut to extract theγ-ray signal<20◦. The excess rate is 4.5γ-rays per minute. . . 78 6.4 Compilation of differentγ-ray measurements and one model of the Crab nebula. See
text for discussion. . . 79 6.5 Measured spectral index derived from differential flux points (dots) and derived from
the variable power-law fit (black solid line, the dashed line gives the 1σ confidence interval); also shown are predictions by Aharonian et al. (2004) (blue curve), Atoyan and Aharonian (1996b) (green curve) and Aharonian and Atoyan (1998) (red curve). 80 6.6 Light curves of the integral flux above 200 GeV from the Crab nebula for each of the
14 nights in a binning of 10 minutes. The black horizontal line in each light curve is the result of a fit of the light curve, assuming a constantγ-ray emission. . . 82 6.7 Average flux above 200 GeV of each observed night. The dashed blue line gives the
average flux of all nights and the blue shaded region the statistical uncertainty of the average flux. . . 83 6.8 Sky-maps of excess events from the Crab nebula for different γ-ray energies (∼
160 GeV,∼250 GeV and>500 GeV). The position of the pulsar is marked by the black cross and the angular resolution is indicated by the circle. . . 84 6.9 Emission of the Crab nebula in different energy bands. The position of the Crab
pulsar is marked with a black star. The Chandra X-ray image is shown in light blue, the Hubble Space Telescope optical images are in green and dark blue, and the Spitzer Space Telescope’s infrared image is in red (picture from Chandra, 2006).
Overlaid on top are the center of gravity of the γ-ray emission at different energies (simple cross>500 GeV; dot∼250 GeV; square ∼160 GeV). The error bars indi- cate the statistical uncertainty in the position of the cog. The upper limits (95%
confidence level) on the 39% containment radius of the γ-ray emission region that were derived from theθ2-distributions are indicated with circles (dashed>500 GeV;
solid∼250 GeV). . . 87 6.10 Background subtractedθ2-distributions produced with theDisp- method for differ-
ent energies. See text for discussion. . . 88 6.11 Optical light curve of PSR B0531+21 measured with MAGIC. The figure includes
data obtained on seven nights between December 2005 and February 2006. The total observation time is 12.5 hours. However, the effective observation time is only
∼1 sec. For better visibility the light curve is shown twice. . . 89
LIST OF FIGURES
6.12 Expanded view of the main pulse of the Crab pulsar in optical. The different rise and fall times of the main-pulse are nicely resolved. The slopes of the main-pulse were fitted with two straight lines. The peak position of the main-pulse is given by the intersection of the two curves. . . 90 6.13 Upper limits on the pulsedγ-ray flux from the Crab pulsar; upper limits in differen-
tial bins of energy are given by the blue points. The upper limit on the cutoff energy of the pulsed emission is indicated by the dashed line. The red arrow indicates the analysis threshold when the upper limit on the cutoff energy was derived. It should be noted that the Celeste limit is based on a two times lower Crab flux than found by MAGIC. . . 92 6.14 Pulse phase profiles obtained after applyingSizedependentHadronness-cuts (Sec-
tion 5.4.1) and|Alpha|-cuts (Section 5.5.1) for two differentSize-cuts. The optical light curve of the Crab pulsar is shown in the bottom of the pulse phase profiles. In- dicated by the vertical bars are the regions where EGRET detected pulsed emission above 100 MeV (cf. Figure 3.6) . . . 93 6.15 Pulse phase profiles obtained after applyingSizedependentHadronness-cuts (Sec-
tion 5.4.1) and|Alpha|-cuts (Section 5.5.1) for four different upperSize-cuts. The EGRET data above 5 GeV are given in blue and the corresponding scale is shown on the right side (cf. Figure 3.6). In all profiles an excess is visible in the VHE-γ- ray data at the position of the interpulse (phase range between 0.32 and 0.43) in coincidence with the EGRET data. The excess in this phase range is monotonically increasing with increasing upperSize-cut. . . 94 7.1 Hαemission around PSR B1951+32 (grey) and X-ray emission (contours) that can
be associated to the pulsar wind nebula that is powered by PSR B1951+32. The arrow shows the direction of the proper motion of the pulsar. A striking difference to Crab is that PSR B1951+32 has a much higher proper motion (240 km/s), which results in the formation of a bow shock. Picture from Moon et al. (2004). . . 97 7.2 The left panel shows the θ2-distribution after background subtraction. The right
panel shows the|Alpha|-distribution of ON-events (black) and OFF-events (red).
In both cases no hint of a signal is visible. The cuts are chosen in both cases such that the energy threshold of the analysis is 280GeV . . . 100 7.3 Integral upper limits (95 % Confidence Level) on the steady emission from the
direction of PSR B1951+32. For comparison, the γ-ray flux of the Crab nebula (Wagner et al., 2005) is also indicated. . . 101 7.4 Sky maps of excess events in the region around PSR B1951+32 smoothed with a
Gaussian kernel of 0.1◦. . . 102 7.5 Significance of VHEγ-ray emission from the region around PSR B1951+32. Left
side: calculated significance of VHEγ-ray emission300 GeV in bins of (0.1×0.1) degrees2. Overlaid in black are contours of radio observations (Castelleti et al., 2003) and in white contours of IR observations (Fesen et al., 1988). Right side: distribution of significances. The distribution has a mean of 0.03 and a RMS of 0.84, compatible with randomly distributed data. Figures provided by E. Aliu. . . 103 7.6 Upper limits (95 % Confidence Level) on the integral γ-ray emission > 200 GeV,
calculated in bins of (0.05×0.05) degrees2. Figure provided by E. Aliu. . . 104 7.7 Results of the analysis in search for pulsed emission from PSR B1951+32. Upper
limits are given for a 95 % confidence level. The red curve shows the spectrum measured by Fierro (1996) but extended by an exponential cutoff of 32 GeV. . . . 105
7.8 Pulse phase profile obtained after selecting events with aSize<300 photoelectrons.
The shaded areas indicate phase regions where PSR B1951+32 is emitting at low GeV energies (Ramanamurthy et al., 1995). See also Figure 3.6. . . 106 7.9 Scan around the frequency of the radio ephemeris. An upper size cut of 300 pho-
toelectrons was adopted for this analysis. The left figure shows the result of the H-Test, the right figure shows the result of theχ2-Test. . . 106 7.10 Results of the test by Gregory and Loredo (1992) from a scan around the frequency
of the radio ephemeris. For this analysis an upper size cut of 300 photoelectrons was used. . . 107 8.1 X-Ray data from Chandra smoothed to a resolution of 5”(contours) and overlaid
on an Hαimage obtained from Taurus Tunable Filter service mode observations on the Anglo Australian Telescope on 3rd of August 2000. The x-ray tail is located well inside the boundaries of the Hαemission and also close to its symmetry axis.
The x-ray contour levels are shown at 0.9, 1.2, 5.3, 35.0, and 78.8% of the peak x- ray surface brightness. The optical residuals correspond to incompletely subtracted stars. Picture and Caption from Stappers et al. (2003). . . 109 8.2 Schematic view of the binary system with the pulsar PSR B1957+20. The dimen-
sions of the companion star and the distance between the star and the pulsar are shown in the correct proportions. The magnetic field configuration is magnified for better visibility. . . 110 8.3 Integral upper limits (95 % Confidence Level) for the steady emission from the
direction of PSR B1957+20 . . . 113 8.4 Sky maps of the region around PSR B1957+20. The skymaps are smoothed with a
Gaussian kernel of 0.1◦. The position of the pulsar is marked with a cross. . . 114 8.5 Flux measurements of PSR B1957+20 in phase bins of the binary orbit. Upper row:
for energies > 200 GeV; lower row: for energies > 400 GeV. On the left side the measured flux is given whereas in the right panels the 95 % confidence level upper limits on the flux are shown. The position of the eclipse of the radio emission as well as the positions of the Lagrange points L4 and L5 are also indicated. . . 115 9.1 The silicon photomultiplier; The left picture shows four cells of a SiPM and the right
photograph a prototype SiPM comprising 576 cells. The device was developed and produced by MEPhI and Pulsar enterprize. . . 120 9.2 Left figure: Sketch of the multiplication process in an avalanche diode that is reverse-
biased slightly below breakdown voltage—multiplication only by electrons (propor- tional mode). Right Figure: Multiplication process in an avalanche diode that is reverse-biased above breakdown voltage—multiplication by electrons and holes (Geiger mode). In Geiger mode the avalanche diverges, whereas in proportional mode the avalanche stops automatically as the avalanche “propagates” only in one direction. . . 121 9.3 Simulated pulse height distribution of output signals of an APD operating in pro-
portional mode for different input signals. The average gain is 1000 per initial photoelectron. . . 122 9.4 Small signal replacement circuit of a SiPM. To the left the replacement circuit of two
SiPM-cells is shown. The characteristics of the output network is described with a RC–low-pass filter. Connected to ground is the load resistor, which is followed by an amplifier. . . 124
LIST OF FIGURES
9.5 Simulated output pulse of a SiPM. See text for details. . . 125 9.6 Different scenarios that can occur when a photon hits a SiPM: 1. Absorption of
the photon in the non depleted substrate; 2. Absorption in the depleted region and subsequent drift of the photoelectron into the high field region; 3. Absorption between two cells; 4. Absorbtion in the SiO2 or non depleted implantation below the surface; 5. Reflection on the surface . . . 126 9.7 Two photographs are overlaid on top of each other. The lower one shows the surface
structure of a SiPM. Shown on top is the light intensity that is emitted from the avalanche cells. The SiPM (from MEPhI and Pulsar enterprize) was operated at 50V. The light emission was integrated for 300sec. The colors give the intensity of the emitted light. Photo from C. Merck. . . 128 9.8 The left picture shows an oscilloscope screen shot of many overlaid SiPM noise pulses
(2 nsec division in time and 2 mV in amplitude). Most of the time, only one cell of the SiPM shows a signal. With lower probability, 2, 3, or even more cells can fire simultaneously due to optical crosstalk. The right panel shows the pulse height distribution of the output of a SiPM integrated for 4 nsec after one cell has fired on a dark count. The signal shows nicely the quasi digital output as a function of the simultaneously fired cells. . . 129 9.9 Response of three different SiPM with 576, 1024 and 4096 cells as a function of
photoelectrons in the active area (from Dolgoshein, 2006b) . . . 130 10.1 Side profile of three cells of a back side illuminated SiPM. Note that the drawing is
not to scale. . . 131 10.2 Cross section of the designed cylindrical avalanche structure that can be embedded
into a drift structure. Free electrons drift into the center of the structure as indicated by the dashed arrow. The potential is shaped by appropriate voltages applied to the back side implantation and two drift rings on the front side of the device. The first drift ring is indicated in the lower corners of the figure. The different implantations are marked with numbers. The doses and type each implantation is given in the table.134 10.3 Simulation of a drifting electron cloud in a back side illuminated SiPM cell. The
charge was generated at r=40. . .45μm, z=448μm (the smallest blob in the top of the figure). The picture shows the location of the drifting electrons in time steps of 2 nsec. Note the difference in notation r=x and z=y. . . 135 10.4 Expanded view of the avalanche region of the simulated cell shown in Figure 10.3.
The charge is completely collected in the avalanche region (r=0. . .5μm and z=0. . .2μm) 20 nsec after its generation. Note the difference in notation r=x and z=y. . . 136 10.5 Temporal evolution of the electron density in the avalanche region. For this simu-
lation electrons have been generated at three different locations in the cell at time t=0. . . 137 10.6 Electric field in the avalanche region before breakdown. Bias voltage −60 V. . . . . 138 10.7 Current and electric potential at the cathode during breakdown. In this simulation
the avalanche structure is biased to−40 V. The cathode is connected via a 500 kΩ resistor to ground. A 100 fF capacitance is connected in parallel to the resistor. . . 139 10.8 Snapshots of the technology at eight steps in the production. The dimensions of the
r- and z-axis are micrometers. The implantation doses are given in units of dopants per cm3. The pictures have been compiled by Rainer Richter with the technology simulation Dios. . . 141
10.9 Four different examples of avalanche test structures designed for the technology outlined in Section 10.3.1. The diameters of the avalanche regions are 10μm, 18μm, 70μm and 100μm, respectively. . . 142 10.10Avalanche structure with a 500 kΩ resistor and 50 fF capacitance combination con-
nected in series with the anode contact. The avalanche region has a diameter of 10μm. . . 143 10.11Evaluation board that was especially designed for the readout of the test structures.
The signal of a test structure is amplified by a broadband (Monolithic Microwave Integrated Circuit) MMIC-amplifier type MAR-8ASM from Mini-Circuits. . . 144 10.12Signal charge and amplitude dependence as a function of the bias voltage for four
different RC-combinations. The values of the capacitors obtained from the slope of the signal-charge vs. bias voltage are given in brackets. . . 145 10.13Multiple triggers of dark counts for the structure with 1 MΩ and 100 fF and a bias
voltage of 49.5V. . . 146 10.14Signal shape in case of the structure with the RC-combination 1 MΩ and 100 fF
biased at 49.5 V. . . 146 10.15Output signal shapes for different RC-combinations connected in series to the avalanche
diode structure. The bias voltage is in all cases 49.5V. The signal amplitude is pos- itive in the lower two figures because the signal was tapped from the cathode and not from the anode. Note that an inverting amplifier was used and that the time scales as well as amplitude scales are different in each figure. . . 147 10.16Output signal shapes of the avalanche diode structure with 500 kΩ/50 fF connected
in series, at different supply voltages. Note that both the time and amplitude scales are different in both screenshots. . . 148 10.17Measured pulse shape of the structure with 1 MΩ and 100 fF and four different model
pulse shapes. (s. text for details) . . . 149 10.18Dark count rate as a function of the bias voltage. . . 149 10.19Afterpulsing measurement of the 500 kΩ/50 fF-structure at a bias voltage of 46 V. . 151 10.20Cross section of the geometry of the SiPM that is simulated in SiSi. Also indicated
are five different possible fates of photons, which are simulated: 1. Absorbtion of the photon in the depleted volume of a cell but the photoelectron will not drift into the avalanche region. 2. Reflection of the photon from any surface of the detector and subsequent absorbtion in the depleted and sensitive volume of a different cell (can start another avalanche). 3. Absorbtion of the photon in the non-depleted volume of the detector and subsequent diffusion of the electron in the depleted and sensitive volume of a cell. (can start another avalanche) 4. Absorbtion of the photon in the non depleted volume of the detector and absorbtion of the generated photoelectron.
5. Transmission of the photon through any surface of the detector. . . 153 10.21Flowchart of the SiSi Monte Carlo program that is simulating optical crosstalk in
SiPM. . . 154 10.22Absorption lengths of photons in silicon. Data from EMIS Datareviews Series, No. 4
(1988). . . 156
LIST OF FIGURES
10.23Distribution of the number of cells, fired by optical crosstalk if one cell of the SiPM fires at random. The upper row shows the simulated distributions (black) for two sets of temperature and efficiency parameters, which result in a good agreement with the measured distribution (blue). In the lower plot the parameters from Lacaita et al. (1993) were used in the simulation. The efficiency is given in units of emitted photons with energies>1.015 eV per charge carrier in the avalanche. The errors on the measured distribution can be neglected and thus are not shown. . . 157 10.24Result of aχ2-test between the simulated and the measured crosstalk-distribution
from a scan in the parameters temperature of the photon spectrum (X-axis) and efficiency of photon production in the avalanche (Y-axis). . . 158 10.25Two simulated events where additional cells are fired due to crosstalk. . . 158 10.26Result of aχ2-test between the simulated and the measured crosstalk distribution.
Each bin gives the χ2 value obtained for one simulated pair of photon production efficiency (X-axis) and electron lifetime in the non-depleted detector volume (Y- axis). A spectral temperature of the emitted photons of 4500K is assumed in the left panel and a temperature of 2000K in the right panel. . . 159 10.27Simulated and measured distribution of crosstalk events. The residuals can be ex-
plained as dark counts, which are not simulated. Parameters in the model have been a photon temperature of 4500 K, a photon production efficiency of 1.45·10−4 and an electron lifetime in the bulk of 60 nsec. . . 160 10.28The left panel shows two simulated energy distributions of photons that where pro-
duced in a breakdown and caused a breakdown of another cell. The right panel shows the photon emission spectra that were assumed in the simulation. Despite the very different emission spectra of 2000K and 4500K one finds an almost identical crosstalk behavior. . . 160 10.29Geometry of the simulated BaSiPM . . . 162 10.30Probability for optical crosstalk as a function of gain for a front side illuminated
SiPM (stars and dots) and a BaSiPM (crosses and triangles) . . . 163 10.31Probability distribution that X additional cells fire due to crosstalk in a BaSiPM
for three different gains. The blue distribution was measured with a front side illuminated SiPM and is shown for comparison. . . 164 A.1 Photograph of the detector setup used in this study. For details see text. . . 171 A.2 Reflectivity of the dielectric foil by 3M measured at four different positions on a
sample. . . 172 A.3 Block diagram of the electronics used in this test. . . 172 A.4 γ-pulse height distributions of a22Na positronium source. The distribution on the
left side was measured by triggering on a coincidence of the two channels. The dashed vertical lines indicate the cuts applied in order to restrict the analysis of the time resolution to the photopeak signal. For the distribution on the right a minimum amplitude in the detector channel was required. The 511 keV peak as well the 1.275 MeV shoulder are clearly visible. Note that for the right hand picture no amplifier was used and that the signal was attenuated (18dB). . . 173 A.5 Pulse height distributions of133Ba and137Cs. The peaks at lower energy are caused
by dark counts where, due to optical crosstalk, many standardized signals are pro- duced within 1 nsec and the summed up signal is high enough to pass the dis- criminator threshold. . . 173
A.6 Correlation betweenγ-ray energy and signal height (in units of charge, respectively number of fired cell). . . 174 A.7 Spectrum of dark count pulses in the used SiPM. Each peak corresponds to a dif-
ferent number of cells fired per event. The distribution was measured without any preamplifier but the passive splitter (1:2) still included. The insert box lists the fit result for the first peak. . . 174 A.8 Distribution of time differences of the two detector channels. For this measurement
the time was measured by triggering on the first photoelectron of each signal with a leading edge discriminator. . . 176 A.9 Coincidence rate as function of the22Naγ-source position. . . 177 B.1 Pulse height distribution of a SiPM during a measurement of the PDE. Pedestal
events can be very well separated due to the large and standardized output signals of the SiPM. Note the logarithmic scale of the y-axis and that the output signal of the SiPM is negative. . . 182 B.2 Left side: Horizontal cut through the mechanical setup used for the measurement
of the PDE. Right side: Photograph of the mechanical setup with the opened cap.
A pulsed LED emits light into the sphere through the hole in the cap. The setup guarantees a fixed light splitting ratio between the reference detector (PiN diode) and the photon detector under investigation. . . 183 B.3 Pulse height distribution of the PiN diode irradiated with a 59 keVγ-source (Am241).
The photo-peak is very well visible. . . 184 B.4 Block diagram of the setup used in the measurement of the PDE. . . 186 B.5 Photon detection efficiency of a SiPM vs. wavelength. The SiPM tested here has
1024 cells on one square millimeter sensor area with a geometrical efficiency of about 10 %. . . 186 B.6 Photon detection efficiency of a SiPM vs. bias voltage. The measurement shows the
strong dependence of the PDE on the bias voltage and indicates a saturation of the PDE at an over-voltage of 7% above breakdown. . . 187 C.1 Blockdiagram of the modified signal chain of the Central Pixel of the MAGIC camera.189 C.2 Schematics of the optical receiver for CP-readout with the DAQ of MAGIC. . . 190 C.3 Scan around the frequency of the radio ephemeris. See text for details. . . 191 C.4 χ2 vs. the number of events used to calculate the light curve of the Crab pulsar.
The number of degrees of freedom is 17. . . 191 C.5 Dependence of the Sensitivity of the Central Pixel on the optical PSF and the radius
of an aperture placed in front of the CP. . . 192 C.6 Dependence of the Sensitivity of the Central Pixel on electronic noise. . . 193
List of Tables
5.1 Integral sensitivities ( > 250 GeV ) derived from the measurement of the Crab nebula; In the last row of the table the average values of each column are given.
The numbers in brackets give the RMS of the values in each column. . . 64 5.2 Integral sensitivities of the MAGIC telescope on the γ-ray emission of the Crab
nebula for several analysis thresholds. . . 64 6.1 Parameters of PSR B0531+21 (Manchester et al., 2005). . . 72 6.2 Some parameters of the selected data. The extinction coefficients for an effective
photon wavelength of 625 nm are from public data available from the Carlsberg Meridian Telescope. . . 74 6.3 Ephemerides of the Crab pulsar provided by the Jodrell Bank Radio Telescope
(2006) relevant for the analysis. MJD is the reference day of the ephemeris andtis the time of appearance of the first main pulse after midnight on the reference day. 74 6.4 Mean energy and differential flux of the spectral points shown in Figure 6.2. . . 76 6.5 Center of gravity of the γ-ray emission of the Crab nebula obtained for different
energies. In the first column the applied Size-cut is stated. The second column shows the correspondingγ-ray energies (peak value and full width at half maximum of the distribution of Monte Carlo γ-ray events). The last two columns give the position of the cog and the statistical uncertainty. . . 85 6.6 Measured and simulated widths of theγ-ray excess in the 2D-skymaps. In the last
column upper limits on the 39% containment radius of theγ-ray emission region are given. . . 86 6.7 Results of the fit of the θ2-distributions with an exponential and thereof derived
upper limits on the extension of the emission region (39% containment radius). . 86 6.8 Analysis results for a cut selecting events withSize >100 photoelectrons . . . 92 6.9 Analysis results for a cut selecting events withSize <300 photoelectrons . . . 95 7.1 Summary of the observation of PSR B1951+32 with MAGIC. The extinction coeffi-
cients are taken from public available data of the Carlsberg Meridian Telescope that is located on the same site as MAGIC. The extinction coefficient is for an effective wavelength of 625nm. . . 99 7.2 Results from an analysis of steady emission from PSR B1951+32. . . 100 7.3 Ephemeris of PSR B1951+32 from Lyne (2006). Uncertainties are given in brackets. 103 7.4 Results of the analysis for periodicity within the PSR B1951+32 data sample. . . . 104
8.1 Summary of the observation of PSR B1957+20 with MAGIC. The extinction coeffi- cient was taken from public data available from the Carlsberg Meridian Telescope.
The coefficient provides the extinction for an effective wavelength of 625 nm. A night is considered to have a good photometric quality in optical astronomy if the extinction coefficient (Ext. Coef.) is 0.09 mag and if the scatter of the extinction coefficient (Sc. Ext. Coef.) over the whole night is below 0.06 mag. . . 111 8.2 Results from an analysis of steady emission from PSR B1957+20 averaged over all
observed orbital phases. . . 112 10.1 Parameters of the modelled pulse shapes that are shown in Figure 10.17 . . . 148 10.2 Results of the afterpulsing measurements at three different bias voltages at room
temperature. Note that the sum of thePi’s in each row is more than 100%. This is because no condition was imposed during the fit, which enforces an overall proba- bility of 100%. . . 150 A.1 Specifications of the SiPM used in this study. . . 170 B.1 Measurement of a HPD Typ R9792U-40 by Hamamatsu. PDE (this meas.) is the
result of my measurement, QE (in house) is the result of a “conventional” QE- measurement performed at the institute and QE (Hamamatsu) the values from the HPD ticket . . . 185
List of Acronyms and Abbreviations
AGASA Akeno giant air shower array AGN Active galactic nucleus AMC Active mirror control a.s.l. Above sea level
Az Azimuth
BaSiPM Back side illuminated SiPM
CANGAROO Collaboration of Australia and Nippon (Japan) for a gamma-ray observatory in the outback CAT Cherenkov array at Themis
CELESTE Cherenkov low energy sampling and timing experiment
CF Constant fraction
CGRO Compton gamma-ray observatory CMB Cosmic microwave background
CORSIKA Cosmic ray simulations for KASCADE
CR Cosmic ray(s)
CR Curvature radiation
CT Cherenkov telescope
DAC Digital to analog converter
DAQ Data acquisition
EAS Extended air shower
EC Extinction coefficient
EGRET Energetic gamma-ray experiment telescope
EM Electromagnetic
EMI Electromagnetic interference FADC Flash analog to digital converter
FOV Field of view
FWHM Full width at half maximum GBIP General Purpose Interface Bus GLAST Gamma-ray large area space telescope GMRT Giant meterwave radio telescope
GP Giant pulse
GRB Gamma-ray burst
GZK Greisen–Zatsepin–Kuz’min H.E.S.S. High energy stereoscopic system
HE High energy
HEGRA High energy gamma-ray astronomy IACT Imaging atmospheric Cherenkov telescope
IC Inverse Compton
IC Integrated Circuit
IR Infrared
ISM Interstellar medium
KASCADE Karlsruhe shower core and array detector LED Light emitting diode
LIDAR Light Detection and Ranging
LSO Lutetium orthosilicate (scintillator crystal)
LYSO Lutetium Yttrium Orthosilicate (scintillator crystal) MAGIC Major atmospheric gamma-ray imaging Cherenkov MARS MAGIC analysis and reconstruction software
MEPhI Moscow Engineering Physics Institute (State University) MC Monte Carlo [simulations]
MHD Magnetohydrodynamic
MJD Modified Julian day
MMIC Monolithic Microwave Integrated Circuit
NS Neutron star
NSB Night–sky background
PCE Photoelectron collection efficiency PDE Photon detection efficiency PET Positron emission tomography
phe photoelectrons
PiN Positive intrinsic negative [diode]
PMT Photomultiplier tube PSF Point spread function
PWN Pulsar wind nebula
QE Quantum efficiency
RA Right ascension
R&D Research and Development
RF Random forestTM
RMS Root mean square
ROOT An object–oriented data analysis framework SED Spectral energy distribution
SiPM Silicon photomultiplier
SNR Supernova remnant
SNR Signal to noise ratio
List of Acronyms and Abbreviations
SSC Synchrotron–self Compton
UV Ultraviolet
VCSEL Vertical cavity surface emitting laser
VERITAS Very energetic radiation imaging telescope array system VHE Very high energy (>30 GeV)
Zd Zenith distance
Chapter 1
Goals of this Thesis
This thesis deals with two topics:
1. The detection and analysis ofγ-ray emission from pulsars and their nebulae.
2. The development of a novel semiconductor photon detector for future experiments in as- troparticle physics.
In the following I summarize the main goals in each of the two topics, at first for the pulsar studies and secondly for the detector development. The structure of this thesis is outlined at the end of this chapter.
1.1 Detection of γ -Ray Emission from Pulsars and their Nebulae
Pulsars are highly magnetized, fast spinning neutron stars. Some are known to emitγ-rays up to energies of at least∼10 GeV. This experimental result is based on observations with the spaceborne detector EGRET. Observations atγ-ray energies100 GeV so far failed to detectγ-ray emission from pulsars. From these studies it is clear that the energy dependent flux of pulsars undergoes a dramatic change, basically a cutoff, in an experimentally unexplored energy region between 10 GeV and 100 GeV. A cutoff in the energy spectrum is also predicted in various models forγ-ray emission from pulsars. Spectroscopy of theγ-ray spectrum between 10 GeV and 100 GeV will contribute in disentangling between models.
It was a goal of this thesis to detect, for the first time, γ-rays from a pulsar with a ground based experiment with a many orders of magnitude (∼105) larger collection area than satellite detectors. Special analysis techniques were developed to search for pulsed emission and to lower the analysis threshold of MAGIC. MAGIC is the first air Cherenkov telescope with a trigger threshold below 100 GeV. Therefore, it is a predestined instrument to perform such studies.
Pulsars are powerful emitters of low frequency electromagnetic radiation and charged particles (pulsar wind). In the vicinity of the NS a nebula forms, which is a source of non-thermal emission.
The Crab nebula is such a source of non-thermal emission and well studied in many wavelengths.
One of the few unexplored energy regions is between 10 GeV and∼400 GeV.
Another goal of this thesis was to measure and characterize the γ-ray emission from the Crab nebula in the unexplored energy range between 60 GeV and 400 GeV.
1.2 Development of a novel Semiconductor Photon Detec- tor for Future Experiments in Astroparticle Physics
A detection ofγ-ray emission from pulsars with ground based experiments is only possible with low enough energy thresholds. In these experiments (air Cherenkov telescopes), γ-rays are typically detected by recording the Cherenkov light that is emitted in air showers. The energy threshold of an air Cherenkov telescope is determined by the fraction of the Cherenkov light that it records.
Photon detectors play a key role in defining the energy threshold.
All current second generation air Cherenkov telescopes use conventional photomultiplier tubes with average quantum efficiencies (QE) of∼15−20% for photon wavelengths between 300 nm and 600 nm. A promising photon detector replacement candidate in the future might be the silicon photomultiplier (SiPM). The SiPM is a novel semiconductor photon detector, which has, besides other favorable characteristics, the potential to detect photons with efficiencies of 80% or higher.
It was the main goal of this thesis to investigate the SiPM for future experiments in astroparticle physics as well as for other applications (e.g. in positron emission tomography (PET)).
An option of this new type of detector is a configuration that is illuminated from the back side (back side illuminated SiPM or BaSiPM). When I started this thesis first basic ideas for BaSiPMs existed but no working device.
It was a goal of this thesis to find a realization of a BaSiPM and predict its character- istics. For this purpose intensive finite element simulations were performed and test structures designed, produced and evaluated. A Monte Carlo simulation of a SiPM was developed to study the optical crosstalk effect.
1.3 Structure of this Thesis
Theγ-ray observations of pulsars and their nebulae with MAGIC are presented in Chapters 2 to 8. I give a short introduction to VHE γ-ray astrophysics in Chapter 2. In Chapter 3 I overview the physics of pulsars and the relation to γ-ray emission. In Chapter 4, I describe the general concept of the imaging air Cherenkov technique and the MAGIC telescope. Chapter 5, I outline the general data analysis before I present the analysis of the Crab in Chapter 6. The analysis of PSR B1951+32, a middle aged pulsar, is discussed in Chapter 7 and the analysis of the millisecond pulsar PSR B1957+21 is summarized in Chapter 8.
In the second part of the thesis (Chapter 9 to 10 and Appendices A to B) I present my work on SiPMs. I introduce the concept of the device and describe its characteristics in Chapter 9. The development of the BaSiPM and optical crosstalk studies are discussed in Chapter 10. The thesis concludes with a short outlook.
Appendix A discusses the first application study of SiPM in positron emission tomography. Dif- ficulties that arise when measuring the photon detection efficiency (PDE) of SiPMs are discussed in Appendix B. In the same Chapter a new method to measure the PDE is presented.
Chapter 2
Short Introduction to Very High Energy γ -Ray Astrophysics
2.1 VHE γ -Ray Astrophysics
Figure 2.1: Main scientific targets of VHEγ-ray astrophysics that are addressed by current ground based γ-ray experiments.
Currently known sources of high energy γ-rays are limited to the most extreme places in the universe: the remnants of supernovae, the ultrarelativistic jets emerging from supermassive black holes at the center of active galaxies, their smaller galactic counterpart the Microquasars, the still