Target of Opportunity Observations of Blazars with the MAGIC Telescope
Elina J. Lindfors, 1 , Daniel Mazin, 2 , Masaaki Hayashida, 3 , Pratik Majumdar, 4 On Behalf of the MAGIC Collaboration
and Anne L¨ ahteenm¨ aki 5
1 Tuorla Observatory, Department of Physics and Astronomy, University of Turku, 21500 Piikki¨o, Finland
2 Institut de Fisica d’Altes Energies (IFAE), Barcelona, Spain
3 KIPAC, Stanford Linear Accelerator Center, Menlo Park, CA 94025, USA
4 DESY Deutsches Elektronen-Synchrotron D-15738 Zeuthen, Germany
5 Mets¨ahovi Radio Observatory, Helsinki University of Technology TKK, 02540 Kylm¨ al¨ a, Finland
E-mail: elilin@utu.fi Abstract
The MAGIC collaboration has been performing Target of Opportunity observations of blazars, when seen flaring in the optical by the Tuorla blazar monitoring program. In the past three years, there have been 5 optical alerts during good weather conditions and reasonable declination of the source. Three alerts have resulted in discoveries of VHE γ-rays from previously undetected sources. In this paper we discuss the discovered sources, MAGIC observations of BL Lac and 3C 279, and we give an outlook for ToO observations of blazars with MAGIC in the MAXI era.
Key words: gamma-rays:observations—galaxies:active
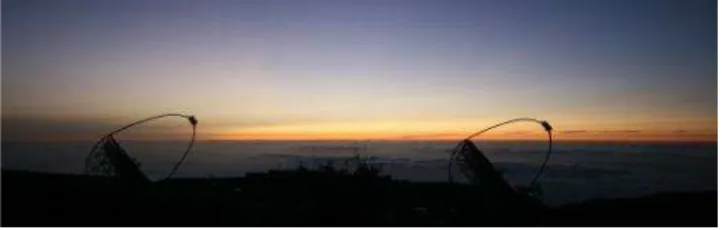
Fig. 1. The MAGIC telescope (right) and the MAGIC II telescope, to be inaugurated in September 2008.
1. Introduction
MAGIC is an Imaging Air Cerenkov Telescope (IACT) located on La Palma, Canary Islands. Due to its large collecting area and uniquely designed camera, MAGIC has reached a lower energy threshold (trigger threshold 50-60 GeV, with new trigger 25 GeV (Teshima et al.
2008a)) for γ-ray emission than any existing terrestial imaging γ-ray telescope. A more detailed introduction to MAGIC can be found in Albert et al. (2008a).
Blazars are the most extreme types of Active Galactic Nuclei (AGN). In these objects the dominant radiation component originates in a relativistic jet pointed nearly towards the observer. Blazars show variable flux in all wave bands from radio to very high energy (VHE, de- fined as E> 100 GeV) γ-rays. The relationship between
the variability at different wave bands appears rather complicated.
The MAGIC collaboration is performing Target of Op- portunity observations of sources in high flux state in the optical and/or X-ray band. Alerts of optical high state originate from the Tuorla Blazar Monitoring Pro- gram. Optically triggered observations have resulted in the discovery of VHE γ-rays from Mrk 180 (Albert et al.
2006), 1ES 1011+496 (Albert et al. 2007a), and most recently from S5 0716+714 (Teshima et al. 2008b). In addition, parts of the BL Lac data in 2005 (Albert et al. 2007b) and the 3C 279 data in 2006 (Albert et al.
2008b) were taken when the sources were in high optical state, and resulted in the discovery of VHE γ-rays from these sources Interestingly Mrk 180, S5 0716+714, BL Lac and 3C 279 were also in high X-ray state during the MAGIC discoveries (for 1ES 1011+496 no simultaneous X-ray data exist).
In this paper we discuss the discovered sources, their
multiwavelength behavior and the prospects of using X-
ray triggers from MAXI.
Fig. 2. Lightcurve of Mrk 180 for MJD= 53815-53825 (2006, March 21-31). Upper panel: VHE γ-rays measured by MAGIC above 200 GeV. Middle panel: ASM count rate, the highest count point corresponds to 3 σ detection of the source by ASM. Lower panel:
Optical flux measured by KVA.
2. Optically triggered Target of Opportunity observations with MAGIC
The optical monitoring observations are performed with the KVA 35 cm telescope at La Palma, remotely op- erated from Finland, and the Tuorla 1m telescope. The observations are done in the R-band and the magnitudes are measured using differential photometry with calibra- tion stars in the same CCD frame as the object. From the observed flux the host galaxy contribution is sub- tracted following Nilsson et al. (2007) to measure the flux of the core. If the core flux increases ∼ 50% (for some extremely variable sources 200%) the MAGIC ob- servations are triggered. The lightcurves are updated to the project web page http://users.utu.fi/kani/1m/ on a daily basis.
In the past three years, there have been 5 optical alerts during good weather conditions and reasonable declina- tion of the source. For two of the sources the MAGIC observations yielded in upperlimit of VHE γ-ray flux and the publication on these upperlimits is in preparation.
Three of the alerts have resulted in the discovery of new VHE γ-ray emitting blazars and are discussed here be- low.
2.1. Mrk 180
Mrk 180 (1ES 1133+704) is a well-known high frequency peaked BL Lac (HBL) at a redshift of z = 0.045 (Falco et al. 1999). In March 2006 it underwent an optical outburst and was observed for 12.4 hours by MAGIC.
During these observations VHE γ-ray emission was de- tected with a significance of 5.5 σ. An integral flux above 200 GeV of (2.3 ± 0.7) × 10 − 11 cm − 2 s − 1 was measured, corresponding to 11% of the Crab Nebula flux. No sig- nificant flux variations were found. Earlier observations
Time [mjd]
54180 54200 54220 54240
]
-1s
-2F (>200GeV) [ cm
0 0.05 0.1 0.15
10
-9× 1ES1011+496, March-April-May 2007
mean flux in 2007:
-1
]
-2s
-11[cm
× 10 0.32) F = (1.58 ±
Time [year]
Flux (>200GeV) 0 5 10 15 20 25×10-12
2006 2007
Fig. 3. Optical (top) and VHE γ-ray (bottom) light curves of 1ES 1011+496. The optical lightcurve shows five years of data from the Tuorla blazar monitoring program, and the vertical lines indicate the starting points of the MAGIC observations. The VHE γ-ray lightcurve shows two months of data from March 17th to May 18th 2007. The inset shows the yearly averages.
by other experiments have only set upper limits on the VHE γ-ray emission from Mrk 180. The upper limits are above the flux measured by MAGIC. It is therefore not possible to judge whether the detected VHE γ-ray flux level represents a flaring or a quiescent state of this AGN.
In X-rays the source is usually too weak to be detected with ASM, but at the epoch of the MAGIC observations there was a 3 σ detection of the source possibly indicating that the source was in high X-ray state.
2.2. 1ES 1011+496
1ES 1011+496 is an HBL object at a redshift of z = 0.212. The MAGIC observations were triggered by an optical outburst in March 2007, and the source was ob- served from March to May 2007. The 18.7 hours of data show an excess at 6.2σ significance with an integrated flux above 200GeV of (1.58 ± 0.32) × 10 − 11 cm − 2 s − 1 . The source has been observed previously by MAGIC in March–April 2006 when the source was in a lower opti- cal state. Those observations only showed weak evidence for a signal at 3.5σ (Albert et al. 2008c). Consequently, the VHE γ-ray flux was > 40% higher in March–May 2007 than in March–April 2006, indicating that the VHE emission state may be related to the optical emission state. The source is too weak in X-rays to be detected with ASM, so there is no information on the X-ray state of the source.
2.3. S5 0716+714
The BL Lac object S5 0716+714 has been studied inten-
sively at all frequency bands. It is highly variable with
rapid variations observed from the radio to X-ray bands
0 10 20 30 40 50 60 70
2004 2005 2006 2007 2008
Flux [mJy]
Time [years]
0 10 20 30 40 50 60 70
2004 2005 2006 2007 2008
Flux [mJy]
Time [years]
20 40 60
14 18 22 26 30
Flux [mJy]
day of April 2008 20
40 60
14 18 22 26 30
Flux [mJy]
day of April 2008
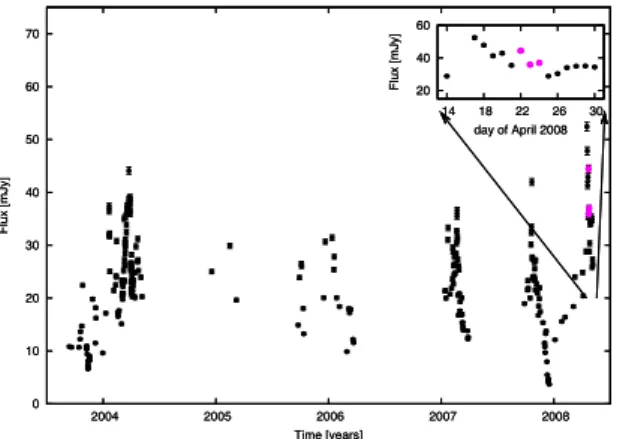
Fig. 4. Long term optical lightcurve of S5 0716+714. The inset shows the lightcurve from April 2008, the pink data points are simultaneous with MAGIC observations.
(Wagner et al. 1996). It has therefore been target to several multiwavelength campaigns, the most recent one organized by the GLAST-AGILE Support Program in July-November 2007 (Villata et al. 2008, Giommi et al.
2008a). Due to the very bright nucleus which outshines the host galaxy, its redshift is still uncertain. The recent detection of the host galaxy (Nilsson et al. 2008) sug- gests a redshift of 0.31 ±0.08 which is consistent with the redshift z=0.26 determined by spectroscopy for 3 galax- ies close to S5 0716+714 (Stickel et al. 1993, Bychkova et al. 2006). It can therefore be concluded that z=0.26 seems to be a rather likely redshift for S5 0716+714, al- though considering the lack of lines in the optical spec- trum (Rector et al. 2001, Sbarufatti et al. 2006), the ul- timate proof for the redshift is still missing. S5 0716+714 has a synchrotron peak in the optical band and is there- fore classified as LBL (Nieppola et al. 2006) or IBL (Padovani et al. 1995). S5 0716+714, discovered by MAGIC, is only the third LBL (BL Lac (Albert et al.
2007b); W Comae (Acciari et al. 2008)) that has been detected at VHE γ-rays. With a presumable redshift of z=0.26, S5 0716+714 is the most distant object of the three and the second most distant of all VHE γ-ray emit- ters (after 3C 279 with z=0.536 (Albert et al. 2008)).
In April 2008 the optical flux of S5 0716+714 almost doubled in three nights (14th of April: 29 mJy, 17th April: 52 mJy) reaching its historical maximum on April 17th (see Fig. 4). MAGIC started the observations 5 nights later (April 22nd), when the moon conditions al- lowed. The observations resulted in the discovery of VHE γ-rays from S5 0716+714, announced in an As- tronomer Telegram on April 30th (Teshima et al. 2008b).
A detailed paper on the MAGIC results is in preparation.
Interestingly, the source was in an all time high state also in the X-rays during the MAGIC observations (Giommi
−14
−13
−12
−11
−10
−9
10 15 20 25
log10(νFν[erg/cm2/sec])
log10(ν[Hz]) Metsähovi
KVA
SWIFT
MAGIC
Fig. 5. The spectral energy distribution of S5 0716+714. The black data points are the historical SED from (Ostorero et al. 2006) and the green data points are from the high state of October 2007 (Villata et al. 2008, Giommi et al. 20008a). The pink data points are from April 2008: 37 GHz from Mets¨ ahovi Radio Observatory, optical from KVA, X-ray from SWIFT (Giommi et al. 2008b) and γ-ray from MAGIC (Teshima et al. 2008b)
et al. 2008b). The quasi-simultaneous spectral energy distribution of this high state in April 2008 is shown in Fig. 5.
3. Observations in high optical and X-ray state
In addition to optically triggered observations, MAGIC has observed two interesting blazars during high opti- cal and X-ray states. Both observations resulted in the discovery of VHE γ-rays from the sources. The connec- tion between X-ray high states and γ-ray high states is expected from theoretical models (e.g. Ghisellini et al.
1998) and correlated variability between X-rays and γ- rays has been observed in many sources (e.g. Fossati et al. 2008). MAGIC observations of BL Lac and 3C 279 give further confidence that X-ray triggers from MAXI would be highly useful for triggering MAGIC observa- tions. In addition simultaneous radio-optical-X-ray and γ-ray observations can provide strong constraints on the models.
3.1. BL Lac
BL Lacertae (1ES 2200+420, z=0.069, Miller et al. 1978) is the prototype for a class of active galactic nuclei, the BL Lac objects. BL Lacertae was observed with the MAGIC telescope from August to December 2005 (22.2 hours) and from July to September 2006 (26.0 hours).
A VHE γ-ray signal was discovered with a 5.1 σ excess
in the 2005 data. BL Lacertae is the first low-frequency
peaked BL Lac object for which a clear detection of VHE
γ-ray signal below the previous upper limits has been
obtained. The 2006 data contain no signal, which is
interpreted as a lower VHE γ-ray emission state.
1 2 3 4 5 6 7 8
2005.6 2005.8 2006 2006.2 2006.4 2006.6 2006.8
Flux [Jy]
Time 37 GHz
5 10 15 20
2005.6 2005.8 2006 2006.2 2006.4 2006.6 2006.8
Flux [mJy]
R-band 0.6 0.8 1 1.2 1.4 1.6 1.8 2
2005.6 2005.8 2006 2006.2 2006.4 2006.6 2006.8
Flux [10-11 erg/cm2/s] RXTE
-20 -10 0 10 20 30
2005.6 2005.8 2006 2006.2 2006.4 2006.6 2006.8
Flux [10-12/cm2/s]
MAGIC(>200GeV)
Fig. 6. Lightcurves of BL Lac at VHE γ-rays (top), X-rays, optical R-band and radio (bottom) from 2005.5 (beginning of July) to 2006.8 (end of September). VHE γ-ray (> 200 GeV) lightcurve measured with MAGIC (Albert et al. 2007b, Hayashida et al.
2007) and the horizontal lines represents the average fluxes of the observing periods. X-ray data are from RXTE (Marscher et al. 2008). The optical R-band data are from the Tuorla blazar monitoring program, the host galaxy flux of 1.37 mJy (Nilsson et al. 2007) has been subtracted from the lightcurve. The 37GHz data are from Mets¨ ahovi Radio Observatory.
The multiwavelength observations simultaneous to 2005 MAGIC observations show very interesting behav- ior from the X-ray to radio regime. The source was bright in all energy regimes, showing a two-peaked outburst in X-rays and optical and a 180 degree turn in polariza- tion angle, but a single outburst in the radio regime.
Marscher et al. (2008) interpreted this as a shock prop- agating down the jet along a spiral streamline, the first flare occurring during the last 240 ◦ twist of the stream- line before the flow straightens and becomes turbulent.
The passage of the feature through the millimetre-wave core stimulates the second flare. Marscher et al. (2008) also pointed out that the MAGIC lightcurve also seems to agree with their scenario as the highly significant de- tections from 2005.819 to 2005.831 during the first X-ray
13 14 15 16 17
2006.05 2006.1 2006.15 2006.2 2006.25
Flux [Jy]
Time 37 GHz
3 4 5 6 7 8 9
2006.05 2006.1 2006.15 2006.2 2006.25
Flux [mJy]
R-band 1
2 3 4
2006.05 2006.1 2006.15 2006.2 2006.25
Flux [10-11 erg/cm2/s]
RXTE -2
0 2 4 6 8 10
2006.05 2006.1 2006.15 2006.2 2006.25
Flux [10-10/cm2/s]
MAGIC(100-500GeV)
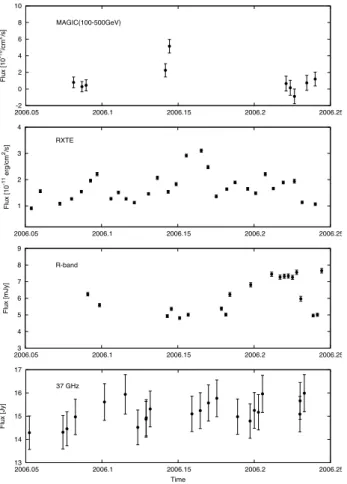
Fig. 7. Lightcurves of quasar 3C 279 at VHE γ-rays (top), X-rays, optical R-band and radio (bottom) from 2006.05 (January 18th) to 2006.25 (April 2nd). VHE γ-ray (100-500 GeV) data are mea- sured with MAGIC (Albert et al. 2008b), and the two high points around 2006.15 (22th and 23rd of February) are the marginal and clear detections, respectively. The X-ray data are from RXTE (Chatterjee et al. 2008), optical from KVA telescope and the 37 GHz data from Mets¨ ahovi Radio Observatory.
flare implies that acceleration of electrons with sub-TeV energies was particularly efficient at this time. Although the MAGIC data from 2005 are statistically consistent with constant emission, in the data we find a marginal correlation between γ-rays and X-rays. Future simul- taneous MAGIC-MAXI observations should be able to confirm this, as MAXI should be able to monitor BL Lac on a weekly basis (Tomida et al. 2008) and MAGIC-II will improve the MAGIC sensitivity so that monitoring observations of BL Lac become possible.
3.2. 3C 279
Flat Spectrum Radio Quasar 3C 279 (z=0.538) was the
first blazar identified as a γ-ray source with the Comp-
ton Gamma Ray Observatory. It was observed with the
MAGIC telescope over 10 nights between late January
and April 2006 (total of 9.7 hours) and the γ-ray source
12 14 16 18 20 22 24 26 28
2006 2006.1 2006.2 2006.3 2006.4 2006.5 2006.6 2006.7 2006.8 2006.9 2007