29th International Cosmic Ray Conference Pune (2005) 00, 101–106
Reconstruction methods of energy spectra for high redshift sources with the MAGIC Telescope
S. Mizobuchi
ab, E. Aliu
, D. Mazin
a, M. Teshima
a, R.M. Wagner
a, W. Wittek
a, H. Yoshii
b(a) Max-Planck-Institut fur Physik, Fohringer Ring 6, 80805 Munchen, Germany (b) Department of Physics, Ehime University, Matsuyama, Ehime 790-8577, Japan
(c) Institut de Fisica d’Altes Energies, Universidad Autonoma de Barcelona, 08193 Bellaterra, Spain Presenter: S. Mizobuchi (satoko@mppmu.mpg.de), jap-mizobuchi-S-abs1-og27-poster
Very high energy gamma-rays are absorbed in the propagation through the intergalactic space by interaction with infrared and visible background photons. Cut-off energies are dependent on the redshift of the emitting source, and they are expected in the energy range from several tens of GeV to 100 GeV for high redshift sources like GRBs and distant AGNs. Measurement of these cut-off energies give us a unique opportunity to put constraints on the star formation rate in the history of the universe, and on cosmological parameters.
MAGIC is a unique detector to explore this important energy range. The real energy spectrum at the top of the atmosphere needs to be derived from the observed one using the unfolding method or by model fitting (the forward folding method), to remove the experimental systematics. In this paper, we discuss the forward folding method in reconstructing the high-energy gamma-ray spectra observed by MAGIC.
1. Introduction
The MAGIC (Major Atmospheric Gamma-ray Imaging Cherenkov) Telescope is located on the Canary island of La Palma (28.8ÆN, 17.9ÆW) at 2200m above sea level. With its 17m diameter mirror, it is the largest Imag- ing Atmospheric Cherenkov Telescope (IACT) world-wide. The main aim of the experiment is the cosmic gamma-ray observation in the energy gap between satellite experiments and current IACTs. By lowering the energy threshold (eventually down to30 GeV) with the large reflector, we can access high redshift sources like GRBs and distant AGNs because of the high flux of gamma-rays and the less significant absorption in the propagation. We expect a break in the energy spectrum in the energy region around 100 GeV, due to the gamma-ray absorption process in the propagation. A measurement of these cut-off energies is very important in order to understand the gamma-ray horizon. The accuracy of determining such energy spectra depends on the statistics and the reliably observable energy range below and above the cut-off energies. In this respect, MAGIC is well suited to study spectral breaks around 100 GeV. In this report, we would like to discuss how reliably we can reconstruct the gamma-ray energy spectrum with a cut-off using the forward-folding method in the MAGIC observation.
2. Energy spectra
High energy gamma-rays are absorbed in the propagation through the interaction with infrared and visible background photons. For the detection of gamma-rays, this is a somewhat negative aspect because of the re- duction of the flux at high energies. However, by studying this attenuation effect in dependence of the distance of sources, we can obtain information on the star formation rate in the history of the Universe. Currently, evi- dence for a cut-off has been observed for relatively nearby TeV-blazars (Mkn501, Mkn421 and 1H 1426+428) by Whipple, HEGRA and CAT. These sources have low redshifts, z= 0.03, 0.03 and 0.129, respectively, and the expected cut-off energies range from sub TeV to a few TeV. For high redshift sources (z1), gamma-rays
2 S. Mizobuchi et al.
start to be absorbed around 100 GeV [1].
We assume a spectral shape for high redshift AGNs and GRBs like
dN
dE
=F
10GeV
E
10GeV
exp
E
E
ut
(EinGeV): (1)
Energy [GeV]
102 103
]2Effective Area[m
102 103 104 105 Effective Area Effective Area
Size [phe]
102 103 104
Energy [GeV]
102 103
Response function Response function
Size[phe]
102
Size[phe]
2
Number of event
1 10 102 103
The size distributin (Alpha -2.2, Ecut 100GeV) The size distributin (Alpha -2.2, Ecut 100GeV)
50
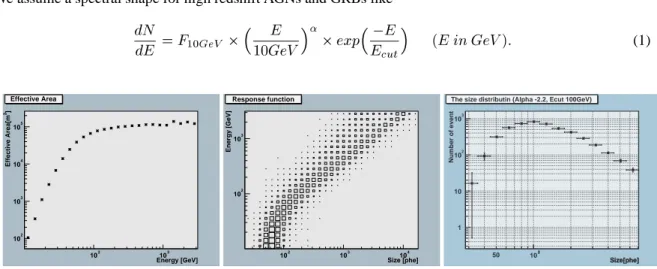
Figure 1. Left: Effective collection area as a function of the true energy. Center: Response function from the true energy to the observable size. Right: Expected size distribution from the energy spectrum with physics parameters (F10GeV
=
8:810 4
m 2
s 1
GeV 1
;= 2:2;Eut=100GeV).
3. Spectrum reconstruction method (Forward folding method)
There are two kinds of methods for reconstructing the energy spectrum, the so-called ”Unfolding” [2, 3] and
”Forward-folding” methods. The Unfolding method is used to determine a true function by deconvolution, multiplying the experimental data by a deconvolution matrix determined from MC data. Instability of the so- lutions, which often occur in unfolding methods are removed by regularization procedures. On the other hand, the concept of the Forward-folding method is simpler. It aims at finding the true distribution by maximizing the agreement probability between the experimental data distribution and the one expected from Monte Carlo. In this paper, we only discuss the forward-folding method. In general,the distribution of observable parameters is related to the physical parameters through the response function, because the observation (experimental mea- surement) can be done only through the physical process and the detector response. It is important to obtain the matrix relating observables to physics parameters as precise as possible.
We proceeded as follows: First we prepared the matrix which relates the true energy to the measurable size distribution, including the shower fluctuation and the detector response, by MC simulation. The definition of the size is the total number of photo electrons. Then we assumed the energy spectrum with parameters (the power index, and the cut-off energy), and then multiplied the energy spectrum by the effective collection area and by the response function, to obtain the expected size distribution. This expected size distribution can be compared with the observed one. Until getting a reasonable agreement, we vary the parameters of the energy spectrum and iterate the procedure.
In Figure 1, the effective collection area as a function of the energy, the response function from the energy to the size, and the expected size distribution from the energy spectrum with physics parameters (F10GeV
=
8:810 4
m 2
s 1
GeV 1
; = 2:2;E
ut
= 100GeV) are shown. The integrated value of elements in the energy column is normalized to 1. Elements in each energy column represent the response function of the detector for triggered events, but do not include the collection efficiency. This collection efficiency in each energy column can be represented by the effective collection area.
Reconstruction methods of ... 3
0.05 0.1 0.15 0.2 0.25 0.3 0.35 0.4 0.45
Alpha -2.6 -2.5 -2.4 -2.3 -2.2 -2.1 -2 -1.9 -1.8
Ecut [GeV]
102 Accuracy (Alpha) Accuracy (Alpha)
4x10²
10 20 30 40 50 60
Alpha -2.6 -2.5 -2.4 -2.3 -2.2 -2.1 -2 -1.9 -1.8
Ecut [GeV]
102 Accuracy (Ecut) Accuracy (Ecut)
4x10²
Energy [GeV]
102
Energy [GeV]
102 dN/dE [m-2 s-1 GeV-1]
10-8 10-7 10-6 10-5
The Energy Spectrum The Energy Spectrum
50
Figure 2. Result of the Forward-folding method for a GRB. Left: The error calculated for the physics parameter ””. The color code represents. x- and y-axes are ”” parameter and ”Eut” parameter of the sample data sets, respectively.
Center: The error calculated for ”Eut”. The color code showsEutin percent. Right: The closed circles represent the true energy spectrum. The two lines show the reconstructed spectra with 1deviations inandEut.
4. Results
The errors in the spectrum reconstruction are expressed by the errors calculated for the physics parameters,
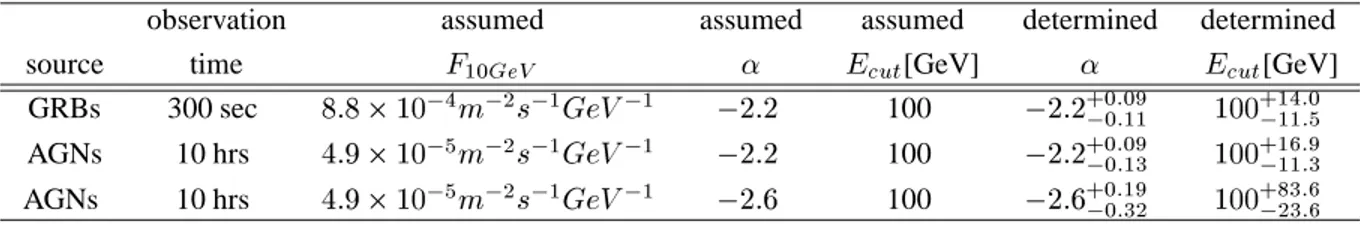
”” and ”Eut”. Here we assumed an AGN- and GRB-like energy spectrum, a power law spectrum with the absorption feature. Our simulation procedures were as follows: We normalized the spectrum of AGNs at 10 GeV to the flux of4:910 5m 2s 1GeV 1. We assumed the gamma-ray flux of8:810 4m 2s 1GeV 1 at 10 GeV for GRBs. Then we assumed observation times of 300 seconds and 10 hours for GRBs and AGNs, respectively. This assumption of the energy spectrum might be reasonable for GRBs, if the energy spectrum is extending with the power law index of 2:2up to several tens of GeV. However, there is no clear idea about the observation time of a 10 100 GeV gamma-ray emission from GRBs. Here, the assumed 300 seconds’
observation time might be optimistic for some GRBs. The observation time of 10 hours can be a typical observation time for a certain AGN flare observation in one week. We made 1000 data sets in each physics parameter set ”” and ”Eut”, varying from 2:6to 1:8and from 50 GeV to 500 GeV, respectively. We individually calculated the determination accuracy of these parameters in each physics parameter set. The errors of the parameters ”” and ”Eut” with a 68 % confidence level are shown in the left and center of Figure 2, respectively.
By assuming a typical GRB with a power law index of 2:2and a cut-off energy of 100 GeV (assumed redshift z1) [1], the energy spectrum is derived as shown in the right of Figure 2. The parameter ”” is determined with an error of+0:09 0:11in the power law index value, the energy cutoff position ”Eut” is determined with an accuracy of+14% and 11:5% of a confidence level of 68 %. In the same plot, we additionally show two size distributions which are allowed within a 68% confidence level. For distant AGNs, we also estimated the error of the ”” and the ”Eut” determination as shown in Table 1, for two different power law cases.
5. Discussion and Conclusions
A summary of the determination accuracies of the physical parameters is shown in Table 1 for various energy spectra. The cut-off energies are well determined in all cases, as long as these energies are inside the observable energy range of MAGIC.
The energy spectrum and the flux of GRBs observed by satellite experiments vary considerably from event to event, and there is some uncertainty as to extrapolating the energy spectrum up to several tens of GeV from
4 S. Mizobuchi et al.
a theoretical point of view (internal absorption processes, hadronic model or SSC model, etc.). The MAGIC Telescope will have a reasonable sensitivity to detect GRBs and to determine the physics parameters even for mean size GRBs, if we do not have strong internal absorption process in the source.
observation assumed assumed assumed determined determined
source time F10GeV
E
ut[GeV] Eut[GeV]
GRBs 300 sec 8:810 4m 2s 1GeV 1 2:2 100 2:2+0:09
0:11
100 +14:0
11:5
AGNs 10 hrs 4:910 5m 2s 1GeV 1 2:2 100 2:2+0:09
0:13
100 +16:9
11:3
AGNs 10 hrs 4:910 5m 2s 1GeV 1 2:6 100 2:6+0:19
0:32
100 +83:6
23:6
Table 1. The determination accuracy dependence on the spectrum shape.
6. Acknowledgements
We are grateful to the IAC for their valuable help. We feel privileged to work with the support of the German BMBF and MPG, the Italian INFN and the Spanish CICYT.
References
[1] T.M. Kneiske et al., A&A, 413, 807 (2004).
[2] V.B. Anykeyev et al., NIM., A303, 350 (1991).
[3] M. Schmelling, ”Numerische Methoden der Datenanalyse”, MPI-K Heidelberg (1998).