Astronomy&Astrophysicsmanuscript no. GCygni_GeVTeV_Morph_MAGIC_Fermi ©ESO 2020 November 2, 2020
Study of the GeV to TeV morphology of the γ -Cygni SNR (G 78.2+2.1) with MAGIC and Fermi -LAT
Evidence for cosmic ray escape
MAGIC Collaboration: V. A. Acciari1, S. Ansoldi2,24, L. A. Antonelli3, A. Arbet Engels4, D. Baack5, A. Babi´c6, B. Banerjee7, U. Barres de Almeida8, J. A. Barrio9, J. Becerra González1, W. Bednarek10, L. Bellizzi11, E. Bernardini12,16, A. Berti13, J. Besenrieder14, W. Bhattacharyya12,
C. Bigongiari3, A. Biland4, O. Blanch15, G. Bonnoli11, Ž. Bošnjak6, G. Busetto16, R. Carosi17, G. Ceribella14, M. Cerruti18, Y. Chai14, A. Chilingarian19, S. Cikota6, S. M. Colak15, U. Colin14, E. Colombo1, J. L. Contreras9, J. Cortina20, S. Covino3, V. D’Elia3, P. Da Vela17,28, F. Dazzi3, A. De Angelis16, B. De Lotto2, M. Delfino15,29, J. Delgado15,29, D. Depaoli13, F. Di Pierro13, L. Di Venere13, E. Do Souto Espiñeira15,
D. Dominis Prester6, A. Donini2, D. Dorner21, M. Doro16, D. Elsaesser5, V. Fallah Ramazani22, A. Fattorini5, G. Ferrara3, L. Foffano16, M. V. Fonseca9, L. Font23, C. Fruck14, S. Fukami24, R. J. García López1, M. Garczarczyk12, S. Gasparyan19, M. Gaug23, N. Giglietto13, F. Giordano13, P. Gliwny10, N. Godinovi´c6, D. Green14, D. Hadasch24, A. Hahn14, J. Herrera1, J. Hoang9, D. Hrupec6, M. Hütten14, T. Inada24,
S. Inoue24, K. Ishio14, Y. Iwamura24, L. Jouvin15, Y. Kajiwara24, M. Karjalainen1, D. Kerszberg15, Y. Kobayashi24, H. Kubo24, J. Kushida24, A. Lamastra3, D. Lelas6, F. Leone3, E. Lindfors22, S. Lombardi3, F. Longo2,30, M. López9, R. López-Coto16, A. López-Oramas1, S. Loporchio13,
B. Machado de Oliveira Fraga8, S. Masuda24,?, C. Maggio23, P. Majumdar7, M. Makariev25, M. Mallamaci16, G. Maneva25, M. Manganaro6, K. Mannheim21, L. Maraschi3, M. Mariotti16, M. Martínez15, D. Mazin14,24, S. Mender5, S. Mi´canovi´c6, D. Miceli2, T. Miener9, M. Minev25, J. M. Miranda11, R. Mirzoyan14, E. Molina18, A. Moralejo15, D. Morcuende9, V. Moreno23, E. Moretti15, P. Munar-Adrover23, V. Neustroev22, C. Nigro15, K. Nilsson22, D. Ninci15, K. Nishijima24, K. Noda24, L. Nogués15, S. Nozaki24, Y. Ohtani24, T. Oka24, J. Otero-Santos1, M. Palatiello2,
D. Paneque14, R. Paoletti11, J. M. Paredes18, L. Pavleti´c6, P. Peñil9, M. Peresano2, M. Persic2,31, P. G. Prada Moroni17, E. Prandini16, I. Puljak6, W. Rhode5, M. Ribó18, J. Rico15, C. Righi3, A. Rugliancich17, L. Saha9, N. Sahakyan19, T. Saito24, S. Sakurai24, K. Satalecka12, B. Schleicher21,
K. Schmidt5, T. Schweizer14, J. Sitarek10, I. Šnidari´c6, D. Sobczynska10, A. Spolon16, A. Stamerra3, D. Strom14, M. Strzys14,24,?, Y. Suda14, T. Suri´c6, M. Takahashi24, F. Tavecchio3, P. Temnikov25, T. Terzi´c6, M. Teshima14,24, N. Torres-Albà18, L. Tosti13, J. van Scherpenberg14,
G. Vanzo1, M. Vazquez Acosta1, S. Ventura11, V. Verguilov25, C. F. Vigorito13, V. Vitale13, I. Vovk14,24,?, M. Will14, D. Zari´c6 External authors: S. Celli26, and G. Morlino27,?
(Affiliations can be found after the references) Received XXX, 2020; accepted XXX, 2020
ABSTRACT
Context.Diffusive shock acceleration (DSA) is the most promising mechanism to accelerate Galactic cosmic rays (CRs) in the shocks of supernova remnants (SNRs). It is based on particles scattering on turbulence ahead and behind the shock. The turbulence upstream is supposedly generated by the CRs, but this process is not well understood. The dominant mechanism may depend on the evolutionary state of the shock and can be studied via the CRs escaping upstream into the interstellar medium (ISM).
Aims.Previous observations of theγ-Cygni SNR showed a difference in morphology between GeV and TeV energies. Since this SNR has the right age and is at the evolutionary stage for a significant fraction of CRs to escape, we aim to understandγ-ray emission in the vicinity of theγ-Cygni SNR.
Methods.We observed the region of theγ-Cygni SNR with the MAGIC Imaging Atmospheric Cherenkov telescopes between May 2015 and September 2017 recording 87 h of good-quality data. Additionally we analysedFermi-LAT data to study the energy dependence of the morphology as well as the energy spectrum in the GeV to TeV range. The energy spectra and morphology were compared against theoretical predictions, which include a detailed derivation of the CR escape process and theirγ-ray generation.
Results.The MAGIC andFermi-LAT data allowed us to identify three emission regions, which can be associated with the SNR and dominate at different energies. Our hadronic emission model accounts well for the morphology and energy spectrum of all source components. It constrains the time-dependence of the maximum energy of the CRs at the shock, the time-dependence of the level of turbulence, and the diffusion coefficient immediately outside the SNR shock. While in agreement with the standard picture of DSA, the time-dependence of the maximum energy was found to be steeper than predicted and the level of turbulence was found to change over the lifetime of the SNR.
Key words. Acceleration of particles – cosmic rays – Gamma rays: general – Gamma rays: ISM – ISM: clouds – ISM: supernova remnants
1. Introduction
In the quest to identify the origin of Galactic cosmic rays (CRs), supernova remnants (SNRs) are the prime candidates. One main pillar of the so-called supernova paradigm is the mechanism of diffusive shock acceleration (DSA; see Blasi 2013; Gabici et al.
? Send offprint requests to: MAGIC Collaboration email: e-mail:
contact.magic@mpp.mpg.de. Corresponding authors: Marcel Strzys, Giovanni Morlino, Shu Masuda, and Ievgen Vovk
2019, for a review), which can efficiently transfer a fraction of the kinetic energy of the SNR shock wave to CRs. DSA pre- dicts that CRs self-generate magnetic turbulence upstream of the shock that subsequently scatter them back downstream. For the most energetic CRs it is not clear whether such scattering cen- tres are efficiently generated nor which is the principal mecha- nism responsible for their production. The answer probably de- pends on the evolutionary stage of the SNR. During the initial stage, when the shock speed is very high and the maximum en-
arXiv:2010.15854v1 [astro-ph.HE] 29 Oct 2020
ergy of CRs is expected to increase, the non-resonant instability is thought to dominate (see Schure et al. 2012, for a review). At later times, when the shock speed starts decreasing and the max- imum energy should also decrease, the amplification is proba- bly dominated by the resonant streaming instability. During both stages, at least a fraction of the highest energy CRs are expected to escape from the shock upstream (Ohira et al. 2010; Malkov et al. 2013; Celli et al. 2019a; Brose et al. 2020). The process of DSA is inevitably connected to the escape of CRs into the inter- stellar medium (ISM). In contrast to the acceleration process, the mechanism of CR escape from the accelerator is not well under- stood, also due to the lack of clear observational signatures. Such evidence could be provided byγ-rays produced from interaction of escaping particles with the interstellar medium surrounding the SNR (Aharonian & Atoyan 1996; Gabici et al. 2009).
Because the amount of CRs escaping is small, young SNRs are not expected to show clear signatures of CR-ISM interaction.
Recently the H.E.S.S. Collaboration et al. (2018) observed γ- rays beyond the X-ray emission region in the SNR RX J1713.7- 3946. However, the angular resolution of the γ-ray telescopes was insufficient to distinguish whether theγ-rays are generated by CRs escaping the SNR or if they are the signature of the shock precursor1.
During the adiabatic or Sedov-Taylor phase the shock veloc- ity decreases significantly and large fractions of particles are re- leased into the ISM. The interaction of such SNRs or their escap- ing CRs with dense molecular clouds was observed for a number of SNRs (W28, IC443, W44, W51C; see Slane et al. 2015, for a review). However, for such mature SNRs the shock has already encountered molecular clouds, and even low energy CRs have escaped from the accelerator, so the escape process cannot be studied in isolation.
With an age of∼7×10³years, theγ-Cygni SNR is slightly older than RX J1713.7-3946, but younger than the middle-aged SNRs. Its circular radio shell suggests that, on the large scale, the hydrodynamic evolution has not been affected by density anisotropies so far and X-ray observations confirm that the SNR is clearly in its adiabatic phase; it is therefore an interesting tar- get to search for signatures of escaping CRs.
1.1. Theγ-Cygni SNR (G 78.2+2.1)
The γ-Cygni SNR (also called G 78.2+2.1) is located in the heart of the Cygnus region close to the brightγ-Cygni star, Sadr (mag=2.2, Hoffleit & Warren 1991). Since it hosts the pulsar PSR 2021+4026, which is likely associated with the SNR (Hui et al. 2015), it is believed to be the debris of a core collapse su- pernova.
At radio wavelengths the SNR shows a distinctively circular shell with a diameter of∼1◦(Higgs et al. 1977; Wendker et al.
1991; Kothes et al. 2006). The emission is brighter towards the south-east and north-west of the shell than along the north-east south-west axis. Further studies from Zhang et al. (1997) and Ladouceur & Pineault (2008) found that the flux spectral index ανvaries between∼0.8 and.0.4 across the SNR. The softest in- dex is found in the bright south-eastern part, while the spectrum is harder (∼ 0.55) in the north-west and south-west (Ladouceur
& Pineault 2008). Based on radio observations and usingΣ-D relations , HI velocity measurements, and association with the Wolf-Rayet binary V444 Cyg, the distance toγ-Cygni was de- termined to be between 1.5 – 2.6 kpc (see Table 1). It is unclear
1 With “precursor” we refer to the region upstream of the shock where particles diffuse but are still bound to the shock.
whether the SNR is surrounded by a larger HI shell. Gosachin- skij (2001) reported a shell of 2◦.0 – 2◦.8×2◦.5 – 3◦.5 diameter cen- tred approximately at the SNR, but noted that the HI structures are not necessarily at the same distance. Ladouceur & Pineault (2008) observed structures in emission bordering the SNR shell, but Leahy et al. (2013) claimed that those structures are absorp- tion features by layers situated in front of the SNR. Given its position in a OB region, it is plausible that the SNR might be surrounded by a HI cavity blown by the wind of the progenitor’s stellar wind (Lozinskaya et al. 2000).
Observations of CO lines did not reveal any interaction of the SNR with molecular material (Higgs et al. 1983a) except for a hint at the south-eastern part (Fukui & Tatematsu 1988). The search for maser emission led to a negative result (Frail et al.
1996).
No optical counterpart of the SNR has been detected. Mavro- matakis (2003) searched for optical emission lines ([NII], [SII], and [OIII]) and found patchy emission towards the south, south- east, and north-west of the SNR. In the south-east hints for shock-heated gas suggest that the low density medium, in which the SNR evolves, contains clouds with pre-shock densities of
∼20 cm−3and a shock velocity of∼750 km s−1. The author fur- ther inferred that most of the hot dust and absorbing matter lies in the foreground of the SNR, which possibly obscures most of the optical emission.
In the X-ray band, the emission is dominated by shock- heated gas as expected for a Sedov-Taylor (ST) phase SNR, even in the case of efficient particle acceleration (Castro et al.
2011). The structure of the X-ray emission correlates with the radio band, except it is also bright in the south-west. The post- shock gas temperature indicates a shock speed of∼1000 km s−1 in all parts of the SNR (Higgs et al. 1983b; Lozinskaya et al.
2000; Uchiyama et al. 2002; Leahy et al. 2013). The gas temper- ature in the centre suggests that the reverse shock hit the centre about 1900 yr ago and thus the SNR is fully adiabatic (Hui et al.
2015). Towards the northern shell the X-ray emission extends beyond the SNR radio shell and may partially be produced by the stellar wind in the foreground (Leahy et al. 2013). Addition- ally, Uchiyama et al. (2002) found three clumps of hard X-ray emission in the north-west, of which two are likely of Extra- galactic origin (Leahy et al. 2013). One (C2), however, may hint at bremsstrahlung clumps and a denser medium in that region.
At GeV energies the Fermi Large Area Telescope (Fermi- LAT) observed extended emission over all of the SNR radio shell (Lande et al. 2012). The source was modelled with a disk of 0◦.63±0◦.05stat±0◦.04sys radius centred on (α = 305◦.25, δ = 40◦.52; J2000) and a power-law spectrum with index
−2.42±0.19. Later analyses of the SNR, however, found dif- ferent extensions to better describe the data (Acero et al. 2016;
Ackermann et al. 2017) and Fraija & Araya (2016) found the spectral index in the north-west of the shell to be harder com- pared to the other parts. Furthermore, the Fermi-LAT collabo- ration discovered theγ-ray bright pulsar PSR J2021+4026, the only variableγ-ray pulsar known so far. It has a spin-down power of ˙ESD∼1035erg s−1and a characteristic age ofτC∼77 kyr (Abdo et al. 2009). The pulsar spectrum follows a power-law with ex- ponential cutoffwith a cutoffenergy ofEc = 2.37±0.06 GeV (Allafort et al. 2013).
At TeV energies the VERITAS telescopes discovered ex- tended emission at the north-west of the shell, which was mod- elled with a Gaussian source (VER J2019+407) centred at (α= 305◦.02,δ = 40◦.76; J2000) Aliu et al. (2013). The observation time was 21.4 h. The spectrum of the extended emission fol- lowed a power-law (index of−2.37). In Abeysekara et al. (2018)
VERITAS updated their findings with an increased exposure of
∼40 h resulting in a softer spectral index (−2.79 ±0.39stat± 0.20sys). The source is also listed in the 2nd HAWC catalogue as 2HWC J2020+403 (Abeysekara et al. 2017). Its centre is at (α = 305◦.16,δ = 40◦.37; J2000) and the spectral index of the measured power-law is−2.95±0.10. However, the angular reso- lution of the HAWC detector was not sufficient to determine the size or to detect substructures.
Table 1 summarises the properties of theγ-Cygni SNR from the given references. In addition to the aforementioned charac- teristics, it lists the age, the density inside the shell, and the explosion energy. The age is inferred from the size of the ra- dio shell, the shock speed, and the particle density assuming a Sedov-Taylor model (see e.g. Eqs. (10) and (11)). Based on these measurements and estimates, in the following we will assume a distance of 1.7 kpc, an age of 7000 yrs, an explosion energy of 1051ergs, and a shock speed of 103km s−1. For the centre of the SNR radio shell we will use (α=305◦.3,δ=40◦.43; J2000). As the ejecta mass is unknown, but the SNR likely resulted from a core-collapse supernova of an OB star, we use a canonical value ofMej=5 Mfor type II supernovae (Chevalier 1977). It is im- portant to note that the ranges given in Table 1 just consider the optimal values from the listed publications excluding the uncer- tainties. The uncertainty ranges of all measurements are similar and thus the average values are still a reasonable representation.
The parameters are further correlated due to their connection via the Sedov-Taylor model. Combining all estimates considering their statistical uncertainties, systematic uncertainties of each in- strument and method, and their correlation is beyond the scope of this work. Accordingly, when using the extreme values from Table 1 in our estimations later on, the resulting ranges are sug- gestive rather than accurate uncertainty intervals.
Overall the observed properties make the γ-Cygni SNR a prime example for a Sedov-Taylor phase SNR and for study- ing the possible escape of CRs. The discrepancy between the morphology at GeV energies observed by Fermi-LAT and the concentrated emission at TeV energies reported by VERITAS indeed suggests an ongoing, energy dependent process (see mor- phology described above or compare Figure 25 from Lande et al.
(2012) and Figure 1 from Aliu et al. (2013)). We report on the observation of γ-Cygni with the MAGIC telescopes and com- bine them with an analysis of Fermi-LAT data to explore the discrepancy in GeV to TeV regime in greater detail.
2. Observations and data analysis
2.1. The MAGIC telescopes observations and data analysis The MAGIC (Major Atmospheric Gamma Imaging Cherenkov) telescopes are a system of two 17 m diameter imaging Cherenkov telescopes (IACTs) located at 2200 m altitude above sea level at the Observatorio del Roque de los Muchachos on the Canary island La Palma, Spain (28◦460N,17◦530W).
The telescopes detect γ-ray induced extensive air showers in the atmosphere via their Cherenkov light. The telescopes are operated in stereoscopic mode, in which only showers triggering both telescopes are recorded. The telescopes cover the energy range from ∼30 GeV toE>100 TeV and have a field of view of 3◦.5 diameter. At low zenith anglesZd<30◦and within 50 h, MAGIC can detect point sources above 200 GeV at a flux level of (0.66 ± 0.03)% of the Crab Nebula flux; at medium zenith angles 30◦<Zd<45◦ this level increases to (0.76 ± 0.04)%
(Aleksi´c et al. 2016).
The observations for this work were performed over two pe- riods between May and November 2015 and between April and September 2017. The data of the latter period include dim and moderate moon data classified according to Ahnen et al. (2017), though the sensitivity is comparable to the one under dark con- ditions. The data cover a zenith range from 10◦to 55◦. The ob- servations used two pointing positions in wobble mode with an offset of 0◦.6 from the VERITAS source location.
Starlight increases the number of photoelectrons (ph.e.) in the pixels close to the position of Sadr in the camera. Hence, the pointing directions were chosen to have the same angular distance to Sadr and thereby to reduce a systematic mismatch between both pointings. Additionally, the position of Sadr was kept outside the trigger region of the camera (up to 1◦.17 from the camera centre) so as not to increase the rate of spurious events.
If the light yield in a camera pixel exceeds the safety threshold, it is switched offto save the photo-multiplier from ageing. This condition applied to 2 – 3 pixels at the position of Sadr neigh- boured by 12 pixels with higher light content. Artefacts from these features survived the analysis procedure at images sizes of size<150 ph.e., where the additional star light or lost pixels significantly affected shower images arriving at the star’s posi- tion. We thus apply a size cut ofsize>150 ph.e. to the MAGIC data implying an energy threshold of 250 GeV. This limit was well above the energy threshold resulting from the general ob- servational conditions (Moon conditions or zenith range). The MAGIC angular resolution, characterised by the point spread function (PSF), for this study was estimated to be 0◦.08 (68%
containment radius) atE>250 GeV.
The MAGIC data were analysed using the MAGIC Analysis and Reconstruction Software (MARS, Zanin et al. 2013). The analysis involved quality selection, cleaning of the shower im- ages from night sky background, Hillas parametrisation, stereo reconstruction based on the disp method, andγ/hadron separa- tion based on a random forest classifier. The data quality was controlled by monitoring the transparency of the atmosphere with a LIDAR system during observations (Fruck et al. 2014). In this analysis we only included data with an atmospheric trans- mission above 85 % of the optimal transparency up to 12 km above the telescopes. The cleaning levels were adapted depend- ing on the night sky brightness following Ahnen et al. (2017).
After quality cuts, the total dead-time corrected observation time amounted to 85 h.
We analysed the high level data with the SkyPrism spatial likelihood analysis package (Vovk et al. 2018). SkyPrism con- tains routines for computing the event count map, the back- ground map, and the instrument response functions (PSF, energy migration matrix, and exposure map). Based on these, SkyPrism fits a user-defined source model to the measured event maps min- imising the negative log-likelihood estimate. This way the pack- age estimates detection flux normalisations and, if performed in several energy bins, extracts the source spectra for the considered model. Statistical inference in SkyPrism is based on a likelihood ratio (LRT) test defining the test statistic (TS)
T S =2 [ln (L1)−ln (L0)], (1)
whereL0 is the likelihood value of the null hypothesis andL1 the one of the hypothesis being tested. The TS value can be con- verted to statistical significance via the Wilk’s theorem (Wilks 1938). If the null hypothesis is true, TS follows aχ2distribution withndegrees of freedom, wherenis the number of additional parameters in the hypothesis model. However, when testing the
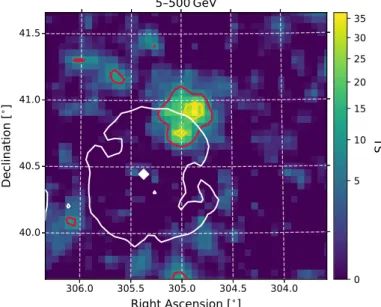
Table 1.Physical parameters of theγ-Cygni SNR based on various measurements. The ranges only reflect the values as given in the corresponding publications.
Characteristic value used in this work value range References
Radius [◦] 0.53 0.51 – 0.56 (1), (4), (9)
Distance [kpc] 1.7 1.5 – 2.6 (1), (2), (6), (7), (10)
Age [kyr] 7 4 – 13 (1), (6), (7), (10)
shock speed [km/s] 1000 600 – 1500 (1). (3), (6), (7), (10) gas density atγ-Cygni [1/cm3] 0.2 0.14 – 0.32 (5), (6), (10)
explosion energy [1051erg] 1 0.8 – 1.1 (8), (10)
References.(1) Higgs et al. (1977); (2) Landecker et al. (1980); (3) Higgs et al. (1983b); (4) Wendker et al. (1991); (5) Saken et al. (1992);
(6) Lozinskaya et al. (2000); (7) Uchiyama et al. (2002); (8) Mavromatakis (2003); (9) Kothes et al. (2006); (10) Leahy et al. (2013) presence of source component (i.e. when the LRT is performed
on the boundary of the parameter space with a single additional free parameter, the flux of the new source component), the TS is converted to Gaussian significances by S = √
T Sσ(Mattox et al. 1996; Protassov et al. 2002).
We used the "exclusion map" method for generating the background map excluding a circular region of 0◦.56 deg around the radio centre (α=305◦.3,δ=40◦.43; J2000) and around the VERITAS centre (α=305◦.02,δ=40◦.76; J2000). The consid- ered MAGIC region-of-interest (RoI), used in this work, had a size of 2◦.5×2◦.5 with a pixel size of 0◦.02×0◦.02. As the bins were smaller than the PSF, the spatial pixels were highly correlated, which is accounted for in the likelihood analysis. A description of the procedure used to estimated the systematic uncertainties on the source localisations and spectral parameters can be found in the appendix Sect. A.
2.2. TheFermi-LAT data observations and data analysis TheFermi-LAT is aγ-ray telescope onboard theFermiGamma- ray Space Telescope (Atwood et al. 2009). Using the pair- conversion technique it is designed to observe the energy range between 20 MeV andE>300 GeV.
This study used data from∼9 years of observation between 2008 Oct 27 and 2017 Sep 12 processed with the Pass 8 R2 reconstruction (Atwood et al. 2013) as provided by the Fermi Science Support Center (FSSC). The data were analysed us- ing the Fermi Science Tools (version v11r5p32) in combina- tion with the Fermipy package (version 0.17.3, Wood et al.
2017). We chose the ’Source’ selection cuts and instruments re- sponses (P8R2_SOURCE_V63) for a balance between precision and photon count statistics. Further, we split the data according to the 4 PSF classes and combined them in a joint likelihood function. As for MAGIC, theFermi-LAT analysis uses the LRT of Eq. (1) for statistical inference. Accordingly, the TS approx- imates aχ2distribution under the null hypothesis, except when testing the presence of a new component on the boundary, in which caseS = √
T Sσapplies as well.
The zenith angle was limited to 105◦, a time filter was applied (DATA_QUAL>0 && LAT_CONFIG==1), and the energy dispersion was considered for all sources except the Galactic and Extragalactic diffuse emission. The used interstellar emission model was
’gll_iem_v06.fits’ and the isotropic diffuse emission model
2 https://fermi.gsfc.nasa.gov/ssc/data/analysis/software
3 https://fermi.gsfc.nasa.gov/ssc/data/Cicerone/ Cicerone_Data_Exploration/Data_preparation.html
was ’iso_P8R2_SOURCE_V6_PSF[0,1,2,3]_v06.txt’ for the corresponding PSF class.
Below ∼10 GeV the emission from the pulsar (PSR J2021+4026) dominates over the flux from the SNR.
Using the off-pulse phase of the pulsar does not sufficiently sup- press its contribution since the flux difference between the pulse peak and the off-pulse emission is only∼30 % (Allafort et al.
2013). To reliably disentangle both components, we limited the energy range of the Fermi-LAT data to 5 GeV – 500 GeV. At E>5 GeV the 95 % containment radius of theFermi-LAT PSF is smaller than the radius of the SNR. We chose the RoI to be 10◦ × 10◦around the radio centre of the SNR, a spatial bin-size of 0◦.05, and split the energy range in 18 bins (9/decade).
To model the contribution from background sources (includ- ing PSR J2021+4026) in the RoI, we used the FL8Y source list4 as a starting point considering sources within 15◦from the centre of the analysis. The source FL8Y J2021.0+4031e corresponding to theγ-Cygni SNR was removed from the model. After running the "optimize" procedure of Fermipy, we removed all sources withT S<16 or having no predicted counts. For the Cygnus Co- coon we used the spatial template of the extended source archive V18 provided online by the FSSC. A point source search in the RoI resulted in one significant, positive excess of>5σover our model coinciding with a 2 FHL source (2FHL J2016.2+3713), which we added to our model. The remaining residuals stayed below <5σ across the entire sky map. Sources related to the γ-Cygni SNR system are discussed in Sect. 3.3. The treatment of the systematic uncertainties on the source localisations and spectral parameters are described in the appendix Sect. A.
3. Analysis results
3.1. MAGIC morphological results
The image of theγ-Cygni SNR obtained with the MAGIC tele- scopes above 250 GeV is displayed in Fig. 1 in terms of the relative flux. Relative flux is defined as the residual or excess events divided by the background events. The event count map and the background map were smoothed with a Gaussian kernel ofσ = 0◦.055, corresponding to the size of the PSF. Addition- ally, the background map was scaled to have the same median pixel values of the event count map for the area outside of the defined exclusion region (Sect. 2.1). Figure 1 also shows the 3 and 5σboundaries of the test statistic map, which for each pixel contains the deviation from a Gaussian distribution of the back- ground only hypothesis based on 500 random representations of
4 https://fermi.gsfc.nasa.gov/ssc/data/access/lat/
fl8y/
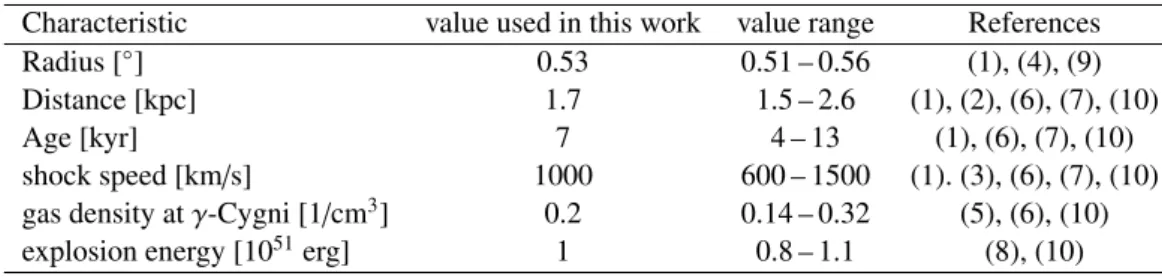
Fig. 1.Sky map in units of relative flux (excess over background) of theγ-Cygni region as observed by MAGICE> 250 GeV. Regions ex- ceeding the 3σ(5σ) local, pre-trial TS significance for a point source are indicated by red (yellow) contours. The cyan line is the 400 K con- tour of the 408 MHz observation by the CGPS. The white diamond marks the position of the PSR 2021+4026, the green X the position of VER J2019+407, and the yellow star the position of Sadr (γ-Cyg star;
mag=2.2). The inlay in the lower left corner shows the 39% and 68%
containment contours of the MAGIC PSF.
the background map. ThisT Spointvalue gives a hint of the lo- cal significance for a point source in each pixel5. The cyan lines are the 400 K contours of the 408 MHz observation by the CGPS (Taylor et al. 2003). In the following, we will continue using this surface brightness level since it agrees best with published ex- tension values in the radio band and is the level right above the brightness of the surroundings.
The emission observed by MAGIC is extended and patchy.
The most prominent feature in the map is an extended region along the north-western rim of the radio shell. It seemingly con- sists of a bright roundish component centred on the rim and an adjunct arc-like appendix extending beyond the radio shell to- wards the west. The map shows faint emission areas inside the southern part of the radio shell, which, however, are below the detection level for a point source.
Since the roundish emission in the north exhibits a higher surface brightness than the adjunct appendix, it seems implau- sible to account for both with just one source component. The former could be well modelled by a radially symmetric Gaus- sian with the position and the extension as free parameters. For the latter we used the sector of an annulus centred at the centre of the radio shell with the inner radius, the outer radius, the angular position of the centre (mathematically positive w.r.t. the decreas- ing RA axis), and the central angle as free parameters. However, it is difficult to determine the exact shape of the emission to the west of the SNR shell based on a visual inspection of the MAGIC skymap. Hence, we also applied a Gaussian to model this emis- sion region. For the fit we assume a spectral, power-law index of Γ =−2.8 agreeing with the value reported by Abeysekara et al.
(2018).
Since the Gaussian source in the north of the SNR is better defined, we scanned its position and extension first. The scan re-
5 Not to be confused with the significance estimates based on likeli- hood ratios obtained with SkyPrism and listed in Table 3
sulted in a minimum at (α, δ; J 2000)=(304◦.89±0◦.01stat,40◦.84± 0◦.01stat) and an extension ofσ=0◦.16±0◦.01stat. At this position we checked for a possible eccentricity, but the improvement over the radially symmetric Gaussian was not significant. The source was detected with a significance of 17.1σ(in the absence of any other model component). In the following we will refer to this source as MAGIC J2019+408.
Including MAGIC J2019+408 in the source model, we scanned the parameters of the arc-like source. When modelled with the annulus segment, it is detected at a significance of 10.3σ and the best-fit parameters are 0◦.45±0◦.03statfor the inner radius, 0◦.27±0◦.03statfor extension (outer - inner radius), 5◦.00±0◦.03stat for the positional angle, and 36◦.58±0◦.03statfor the central angle.
When modelling the emission towards the west of the SNR with a second Gaussian instead of the arc model, the best-fit po- sition was at (α, δ; J 2000)=(304◦.51±0◦.02stat,40◦.51±0◦.02stat) with extension ofσ=0◦.12±0◦.01stat. The detection significance was 9.2σ. We will address the question of model selection be- tween these two alternatives in Sect. 3.4 after having examined theγ-ray emission over a wider energy range taking into account observations withFermi-LAT. A search for point-sources in ad- dition to MAGIC J2019+408 and the arc or second Gaussian did not lead to any significant detection.
3.2. Energy dependent morphology
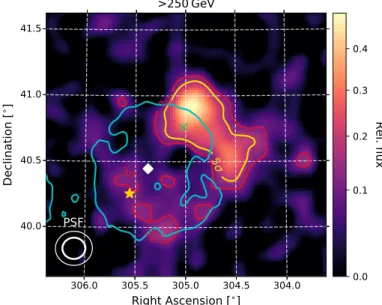
Even though the observations with MAGIC provide a more pre- cise image of the source at hundreds of GeV to TeV than pre- vious observations, its morphology still differs from previously published Fermi-LAT skymaps. To study the evolution of the emission over the entire GeV to TeV range, we analysed the data set from theFermi-LAT, which contained 1.5 times the observa- tion time of the latest extended source catalogue (Ackermann et al. 2017). We split theFermi-LAT and MAGIC data into two energy ranges each: 15 – 60 GeV and 60 – 250 GeV for the for- mer and 250 – 500 GeV and 500 GeV – 2.5 TeV for the latter.
The skymaps are shown in Fig. 2. TheFermi-LAT maps dis- play the event counts (smoothed with a Gaussian kernel with σ=0◦.075) together with point source TS contours. The count images have the advantage of being free from any model de- pendency but do not allow the exclusion of sources by includ- ing them into the background model. Thus, we chose a lower limit of 15 GeV to prevent the pulsar from dominating the im- age. TS contours are based on a point source search on top of the background source model described in Sect. 2.2. The MAGIC skymaps are presented in terms of relative flux together with point source TS contours. In the 15 to 60 GeV range the emis- sion predominantly comes from a region agreeing with the SNR radio shell. The intensity is nearly uniform across the shell and the 3 and 5σlocal significance contours seemingly agree with the radio contours. On the contrary, at 60 to 250 GeV the shell emission weakens and a slightly extended emission at the north- western rim stands out nearby MAGIC J2019+408. The position at which MAGIC observes the arc-like structure, however, does not show any significant emission.
MAGIC J2019+408 is the main component in the 250 to 500 GeV map measured by MAGIC. Emission at the arc po- sition is becoming visible but at a lower level compared to MAGIC J2019+408. The inside of the shell shows some faint emission. Finally, at 500 GeV to 2.5 TeV, the arc-like region brightens. The inside of the shell does not show any significant emission, instead, some emission towards the south of the shell becomes visible. Since this emission was not significant in the combined MAGIC data set and the TS contours are approximate
Fig. 2.Energy-dependent morphology of theγ-Cygni SNR.Upper left:Fermi-LAT count map between 15 and 60 GeV smoothed with a Gaussian kernel (σ=0◦.75) and 3 and 5σcontours of a point source search. The white line is the 400 K contour of the 408 MHz observation by the CGPS.
The white diamond identifies the position of PSR 2021+4026.Upper right:same as upper left but in the range from 60 and 250 GeV.Lower left:
relative flux map observed by MAGIC at 250 to 500 GeV together with 3 and 5σpoint source significance contours. The same radio contours as in upper panels are displayed in cyan.Lower right:same as lower left but in the energy range from 500 GeV to 2.5 TeV.
Gaussian significances, it can only be considered a hint for emis- sion.
3.3.Fermi-LAT morphological results
To quantify the Fermi-LAT results from Sect. 3.2, the likeli- hood analysis presupposes a morphological template. To ac- count for the extended uniform emission well visible in the 15 to 60 GeV skymap, previous analyses of the Fermi-LAT data used a radially symmetric disk model. When fitting the Fermi- LAT data E > 5 GeV we used a radial symmetric disk with the position and extension being free parameters and obtained (α, δ; J 2000)=(305◦.24±0◦.02stat,40◦.49±0◦.02stat) and a radius of 0◦.60±0◦.02. This result is consistent with the disk model re- ported in Ackermann et al. (2017). For the fit we used a spectral, power-law index ofΓ = 2, which is in the range of indices re- ported by the variousFermi-LAT catalogues.
As mentioned in Sect. 1, the estimated size of the disk varies between different Fermi-LAT studies (likely due to different energy ranges). All either partially or full encompass MAGIC J2019+408. However, since it is visible in the Fermi-LAT data (E>60 GeV) and MAGIC data, it might be a distinct object from
the disk. If it is not considered as such, photons might be mis- assigned to the disk pushing the fit towards a larger disk size.
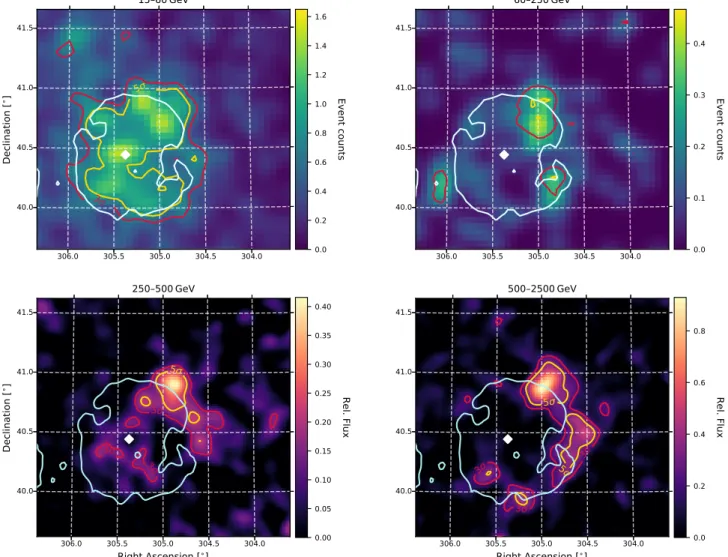
Assuming that the disk template is related to the SNR and given the approximate agreement between the TS contours and the ra- dio contours in the 15 GeV to 60 GeV range, we consider it more plausible to base the disk model on the position and extension of the radio shell. The radially symmetric disk model is centred at (α, δ; J 2000)=(305◦.30,40◦.43) with a radius of 0◦.53. Fitting this model to theFermi-LAT data resulted in remaining resid- ual counts in the north-western region. Figure 3 displays the TS map for a point source search on top of the radio disk. The con- tours suggest the presence of a source of similar morphology to MAGIC-J 2019+408.
Assuming a point-source, the source search resulted in the detection at a 6.1σlevel (T S =37) at (α, δ; J 2000)=(304◦.92± 0◦.02stat± 0◦.02sys,40◦.87 ±0◦.02stat ±0◦.02sys). Using the Fer- mipy routines we additionally fitted the extension of the source simultaneously with the position using a radially symmetric Gaussian source model. The best fit is obtained for (α, δ;
J 2000)=(304◦.98±0◦.03stat±0◦.02sys,40◦.87±0◦.03stat±0◦.02sys) and an extension of 0◦.19±0◦.02stat±0◦.01sys(68% containment;
σ=0◦.13). The extension of the source is significant with a TS
Fig. 3.Fermi-LAT TS map for a point source search on top of the back- ground sources specified in Sect. 2.2 and including the radio-based disk model. Regions exceeding the 3σ(5σ) local, pre-trial TS significance for a point source are indicated by red (yellow) contours. The white line is the 400 K contour of the 408 MHz observation by the CGPS. The white diamond marks the position of PSR J2021+4026.
value of 28.4. These values agree within errors with the position and extension of the MAGIC-J 2019+408, so we associate the Fermi-LAT and MAGIC source. The fit was based on a spectral power-law index ofΓ =2.
The two source, radio disk and MAGIC J2019+408, yield a log-likelihood value of ln (L2src) = −160597, whereas the sin- gle extended disk model give ln (L1disk) =−160621. However, both models are not nested and thus the LRT cannot be used to gauge the significance of the∆ln (L). Instead we use the Akaike information criterion (AIC, Akaike 1974) to assess the relative quality of the two model. The AIC estimate of a model is defined as
AIC=2k−2 ln (L), (2)
wherekis the number of degrees of freedom of the model and Lthe likelihood value. The model with the smaller AIC value is preferred. Since the radio disk is fixed the former model has 5 free parameter (norm of the disk and position [in 2-D], extension, and norm of the Gaussian) and the latter model has 4 (position, extension, and norm of the disk). Due to the∆loglike=24 im- provement with only one additional parameter, the two-source model is preferred over the single larger disk.
3.4. Common model and source spectra
To extract the spectra in the entire GeV to TeV range, we need to combine the findings in the Sect. above into a common source model. Particularly, based on the energy dependent brightness ratio between different parts around the SNR as described in Sect. 3.2, in the following we consider the γ-ray emission in the region to consist of three components: the interior of the SNR shell, MAGIC J2019+408, and emission west of the shell (arc/second Gaussian). The position and parameters of the mod- els for each source are given in Table 2 and sketched in Fig. 4.
For the emission from the SNR shell, we kept the disk based on the radio observation. This disk partially overlaps with MAGIC J2019+408 and the arc region, thus we updated the parameters of the MAGIC analysis including the disk.
For MAGIC J2019+408 it resulted in (α, δ; J 2000)=(304◦.89± 0◦.01stat±0◦.04sys,40◦.88±0◦.01stat±0◦.02sys) and σ = 0◦.13± 0◦.01stat±0◦.02sys. To model MAGIC J2019+408 consistently for both instruments, we further averaged the MAGIC andFermi- LAT location and extension of the Gaussian weighted with the inverse of their variances (statistical and systematic uncertain- ties added in quadrature): (α, δ; J 2000)=(304◦.93,40◦.87) and σ=0◦.13.
For the annular sector template representing the arc we fixed the inner radius at the radius of the shell (0◦.53 from the SNR centre) and rescanned the other parameters. The best-fit values were 0◦.15±0◦.04stat+0.27
−0.08sysfor extension, 7◦.00+−2.6stat4.0 +−3.6sys8.0 for the positional angle, and 33◦.0±6◦.4stat+14.0
−13.0sysfor the central angle.
When supplying a second Gaussian as an alternative to the arc model. The best-fit was obtained for (α, δ; J 2000)=(304◦.49± 0◦.02stat±0◦.05sys,40◦.56±0◦.02stat±0◦.03sys) and σ = 0◦.12± 0◦.02stat±0◦.04sys. Fitting these sources to the Fermi-LAT and MAGIC data results in the detection significances stated in Table 3.
The model consisting of two Gaussians yields a slightly better log-likelihood value of ln
L2gauss
= −36303 com- pared to the MAGIC J2019+408 and Arc model resulting in ln
Lgauss+arc
= −36306. Both models are not nested and we use the AIC (Eq. (2)) to access the relative model quality. Both models have the same number of free parameters: position (2D), extension, and the normalisation for the Gaussian and extension, positional angle, central angle, and flux normalisation for the Arc. The∆AIC=-6 can be converted to a probability estimate via exp (∆AIC/2) (see e.g. Burnham & Anderson 2004). Ac- cordingly, the arc model is 6% as likely as the second Gaussian, which is<2σin terms of Gaussian probability and thus the arc model cannot be rejected based on this statistical test. Due to the same number of free parameters in both models and the small difference in the log-likelihood, other information based model selection criteria (e.g. Bayesian information criterion) will give similar results. In the following, we will provide the spectra for both source models. However, in Sect. 4 we develop a theoreti- cal model based on CRs escaping the SNR into a homogeneous medium. The annular sector is a better spatial representation for this model. Since both spatial templates are statistically equal, for the comparison against the theoretical model we will em- ploy the annular sector. Nonetheless, it is important to note that the Gaussian model does not alter the understanding of emis- sion outside the SNR shell. The centre of the Gaussian is clearly situated outside of the SNR radio shell with the centre of the Gaussian being 0◦.1 away from the edge of the SNR shell.
We extract the spectra of the source components from the MAGIC andFermi-LAT data for the spatial components as de- fined in Table 2. For the Fermi-LAT data we used 9 bins per decade over the range from 5 to 500 GeV and the MAGIC data were binned into 4 bins per decade ranging from 250 GeV to 12.5 TeV. To consider the effect of the energy migration, the Fermi science tools and the SkyPrism analysis adjust an as- sumed spectral model via a forward folding procedure. As spec- tral model we used a power law of the form
dN dE =N0
E E0
!−Γ
, (3)
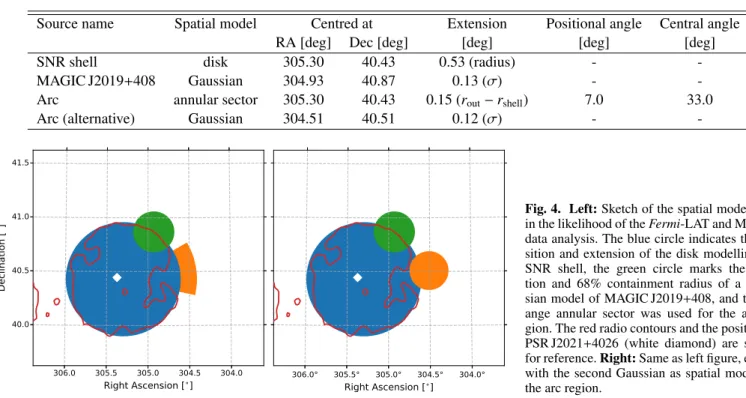
Table 2.Spatial models used for the MAGIC andFermi-LAT likelihood analysis.
Source name Spatial model Centred at Extension Positional angle Central angle
RA [deg] Dec [deg] [deg] [deg] [deg]
SNR shell disk 305.30 40.43 0.53 (radius) - -
MAGIC J2019+408 Gaussian 304.93 40.87 0.13 (σ) - -
Arc annular sector 305.30 40.43 0.15 (rout−rshell) 7.0 33.0
Arc (alternative) Gaussian 304.51 40.51 0.12 (σ) - -
Fig. 4. Left:Sketch of the spatial model used in the likelihood of theFermi-LAT and MAGIC data analysis. The blue circle indicates the po- sition and extension of the disk modelling the SNR shell, the green circle marks the posi- tion and 68% containment radius of a Gaus- sian model of MAGIC J2019+408, and the or- ange annular sector was used for the arc re- gion. The red radio contours and the position of PSR J2021+4026 (white diamond) are shown for reference.Right:Same as left figure, except with the second Gaussian as spatial model for the arc region.
with the photon indexΓ, the normalization constantN0, and the scaling energy (or pivot energy)E0. The best fit results together with their uncertainties are summarised in Table 3. The choice of the spatial template for the arc region changes the spectra of the shell and MAGIC J2019+408 at a level below the statisti- cal uncertainties. The contributions to the systematic uncertain- ties estimated as described in Sect. A and listed in Table A.1 are added in quadrature. Since, the spectral models are power- laws, the systematic uncertainty on the energy scale is converted to an uncertainty on the flux normalisation and added to it. We checked for a possible curvature of the spectrum of all sources by fitting a log-parabola spectrum (power-law exponent becomes Γ +βlog(E/E0) with the curvature factor β). For none of the components and instruments a significant curvature was detected (improvement over power law based on a likelihood ratio test led to a significance<3σ).
To better compare the data against theoretical model predic- tions, we additionally compute data points (flux in narrow energy bands). For theFermi-LAT data we rebin the 9 bins per decade to 2 bins between 5 – 13.9 GeV, 2 bins between 13.9 – 64.6 GeV, and 2 bins between 64.6 – 500 GeV. Thus, the energy bins are much wider (& 4 times) than the energy resolution (∆E<5%) and, even though the data points are not deconvolved, the corre- lation between the points can be considered negligible. Whereas, for the MAGIC data, the energy resolution (15 – 20%) is of the same order as the bin width, and the correlation between the data points needs to be taken into account. Hence, we used the for- ward folding technique for data points proposed in Vovk et al.
(2018), in which the differential flux points are interpreted as the breaks of a broken power-law with multiple energy breaks.
The arc was not detected in theFermi-LAT data and thus only spectral upper limits could be computed. The upper limits (ULs) of theFermi-LAT data are 95% confidence UL using the semi- Bayesian method of the science tools following Helene (1983) and the MAGIC UL are following the method by Rolke et al.
(2005). In Sect. 5.1 these data points are compared against a model curve.
3.5. Discussion of the observational results
Regarding the disk, given the agreement of the position and ex- tension of the emission detected byFermi-LAT with the radio shell, a random coincidence seems implausible. As explained above, fitting theFermi-LAT data resulted in a slight offset from the radio position and extension, but the fit of the Fermi-LAT data might be affected by the presence of MAGIC J2019+408.
Hence, a disk model agreeing with the radio shell seems rea- sonable. Our spectral results are in agreement with previously published results on this source by theFermi-LAT collaboration considering the difference in the area of the disk models.
MAGIC J 2019+408 is present in the MAGIC and Fermi- LAT data. Its position is offset with respect to VER J2019+407 (0◦.07 north of the latter) but still compatible (∼ 2σ discrep- ancy considering combined errors). Aliu et al. (2013) did not observe the arc structure, and not considering it as a distinct source may explain the different positions. The fact that the ex- tension of VER J2019+407 is significantly larger and the VERI- TAS collaboration claimed an asymmetric source when updat- ing their results in Abeysekara et al. (2018) supports this as- sumption. To highlight the different location and morphology, we gave this source an identifier different from the VERITAS one. In the Fermi-LAT energy range the spectrum of MAGIC J 2019+408 is slightly harder than the one of the shell, consis- tent with the findings of Fraija & Araya (2016). The authors analysedFermi-LAT data in a narrower energy range and per- formed a point-source search on top of the larger disk model from the 3FGL (whereas we used a physically-motivated radio- based model). Accordingly, they obtained a TS map different from ours (Fig. 3), associated the excess emission with VER J2019+407, and extracted the spectrum at the corresponding po- sition. For MAGIC J2019+408 the possibility for an extended source unrelated to the SNR cannot be ruled out. However, X- ray and radio data do not show any hint for a possible Galactic counterpart such as a pulsar powering a wind. Additionally, the spectral agreement with the SNR interior, particularly in the en-
Table 3. Results of the spectral analysis from theFermi-LAT and MAGIC analysis for each source component. All sources were best fit with a power-law function with flux normalisationN0, spectral indexΓ, and scaling energyE0. The model for fitting theFermi-LAT data included the model for the arc region (either annular sector or Gaussian), but was found not to be significant.
Source name MAGIC
N0[TeV−1cm−2s−1] Γ E0[TeV] Det. Sign. [σ]
SNR Shell
10±2stat+6.7
−3.5sys
×10−13 −2.55±0.16stat+−0.25sys0.30 1.0 6.1 MAGIC J2019+408
10.0±0.9stat+−3.5sys6.0
× 10−13 −2.81±0.10stat+−0.19sys0.21 1.0 16.7 Arc (annular sector)
3.9±0.7stat+2.6
−1.5sys
×10−13 −3.02±0.18stat+0.22
−0.20sys 1.0 10.1
Arc (Gaussian model)
5.2±0.8stat+3.6
−2.2sys
×10−13 −2.99±0.16stat+0.22
−0.22sys 1.0 10.3
Fermi-LAT
SNR Shell
37±2stat+4.6
−4.0sys
×10−10 −2.11±0.06stat±0.01sys 0.05 23.2 MAGIC J2019+408
9.8±1.8stat+1.1
−1.0sys
×10−10 −1.86±0.13stat±0.01sys 0.05 8.9
ergy range ofFermi-LAT, further supports the assumption of a connection with the SNR.
The arc-like region is detected by MAGIC only, though the VERITAS skymaps in Weinstein (2015) and Abeysekara et al.
(2018) show hints for an extended emission stretching out to- wards the west of the SNR. The differences in morphology can be understood as a result of the differences in the obser- vation time (tMAGIC∼2 ×tVERITAS) and different methods for reconstructing the background emission (Exclusion region for MAGIC vs. ring background model for VERITAS), of which the ring background faces issues with extended sources (Berge et al.
2007). The exclusion region method is only insensitive to emis- sion regions larger than twice the wobble distance (1◦.2 for our MAGIC data). We can thus not rule out that the arc-like struc- ture is the residual of a much larger complex such as the Cygnus Cocoon. However, given that the arc traces the rim of the SNR and its spectrum agrees with that of MAGIC J2019+408 at TeV energies, the association with theγ-Cygni SNR is very plausible.
The PSF of the HAWC experiment does not allow resolv- ing substructures in the γ-Cygni region making a comparison with the MAGIC results difficult. HAWC determined the cen- tre of the emission around the SNR close to the centre of the shell (Abeysekara et al. 2017), whereas from the MAGIC high energy skymap one would expect it to be shifted towards the north-west. This suggests additional emission surrounding the SNR likely towards the south of the shell, a region not well cov- ered by the MAGIC observations due to the presence of Sadr.
Still the steep spectral index measured by HAWC is in agree- ment with a softening of the spectrum between the energy range covered byFermi-LAT and MAGIC.
4. Interpretation and modelling 4.1. Leptonic or hadronic emission
The radio emission proves the presence of high-energy electrons inside the shell, which can also be the origin of theγ-ray emis- sion via inverse Compton scattering (IC) or bremsstrahlung radi- ation. Due to the low plasma density of 0.2 cm−3inside the SNR shell (Table 1), the former emission will dominate over the lat- ter even when only considering a CMB photon field. The high energy spectrum from the shell ofγ-Cygni up to a few hundreds of GeV has a slope of∼E−2. In contrast, the average radio spec- tral indexαRof 0.48 – 0.75 (Zhang et al. 1997; Gao et al. 2011;
Kothes et al. 2006; Ladouceur & Pineault 2008) implies an elec- tron spectrum between dN/dE∝E−1.96and∝E−2.5and thereby
a harder Inverse Compton (IC) spectrum inγ-rays. Hence, a lep- tonic scenario requires an additional breazk in the spectrum in the keV to GeV range to bring both observations into agreement.
Such a break can naturally arise from electron cooling. To obtain a synchrotron cooling time shorter than the lifetime of the SNR, the magnetic field inside the SNR needs to beB&20µG.
If the emission outside the shell originates from IC as well, the morphology of the arc and MAGIC J2019+408 re- quire either an enhancement of the radiation field in those re- gions or a specific guiding magnetic field creating an over- density of electrons compared to other parts around the shell.
Observations with the Infrared Astronomical Satellite (IRAS;
Saken et al. 1992) indeed suggest a higher IR emission towards MAGIC J2019+408 at 25µm and at 60µm. However, the mor- phology of MAGIC J2019+408 does not agree with the IR struc- ture and the peak of the former is offset with respect to the cen- tre of the latter by∼0◦.6. Additionally, the parallaxes of identi- fied IR sources in the vicinity of MAGIC J2019+408 (Gaia Col- laboration 2018) suggest that at least part of the IR emission is farther away than theγ-Cygni system. The absence of non- thermal synchrotron radiation at MAGIC J2019+408 (skymaps in Ladouceur & Pineault (2008)) also renders the magnetic field scenario unlikely. Finally, the arc region is dark in both IR and synchrotron which speaks against an IC scenario as well.
Accordingly, the most likely leptonic scenario for the arc and MAGIC J2019+408 is bremsstrahlung emission. Like a hadronic scenario, it requires a local enhancement of the target gas density and is independent from the constraints above. Nevertheless, in this case the power-law index of the electron spectrum needs to change fromΓ∼ −3 inside shell toΓ∼ −2 outside. Moreover, in order for bremsstrahlung to dominate over pion decay, the ac- celerated electron-to-proton ratio has to be10−2, whereas the studies of multi-wavelength emission from several young SNRs point towards smaller ratios of≈ 10−3 or less (see, e.g., Völk et al. 2005; Morlino & Caprioli 2012). Additionally, theoretical predictions based on particle-in-cell simulations of collisionless shocks hint at values of electron-to-proton ratios of.10−2(Park et al. 2015).
In conclusion, even if a leptonic explanation cannot be com- pletely ruled out, its realisation requires extreme conditions. Al- ternatively, theγ-ray emission can be explained in a hadronic scenario, which is not subject to the aforementioned constraints.
Hence, in the following we develop a hadronic model to explain the data and accordingly assume that the bulk of emission is due to hadronic interactions.
4.2. Escaping or precursor?
If the emission from the arc region is indeed connected to the SNR, the emission beyond the SNR shell can be either due to the CR precursor in front of the shock or produced by particles escaping from the shock. The former interpretation seems un- likely for two different reasons. Firstly, the spectrum from the arc region is softer (at most similar given the uncertainties) than the one detected from the SNR interior. Using the linear theory with a spatially constant diffusion coefficient in the precursor, the spectrum upstream of the shock is given by:
fup(x,p)= fsh(p)e−ushx/D1, (4) wherexis the distance upstream from the shock,pthe particle’s momentum,ush is the shock speed, andD1 the diffusion coeffi- cient upstream (see e.g. Blasi 2013). If the spectrum at the shock is fsh ∝p−αand the diffusion coefficient isD1(p)∝pβ (in gen- eralβ >0 andβ=1 for Bohm diffusion), the spatially-integrated spectrum upstream is
Z ∞
0
fup(x,p)dx∝p−α+β. (5)
Hence, the spectrum from the arc region should be harder than the one inside the remnant unless the diffusion coefficient is con- stant in momentum, which would be difficult to explain from both observational and theoretical grounds.
The second argument comes from the comparison of the SNR age with the acceleration time. If the arc represents the shock precursor, the thickness of the arc ∆arc corresponds to the diffusion lengthλpof particles with momentumpupstream.
Hence, we can estimate the diffusion coefficient at the central energy observed imposingλp = ∆arc'D1(p)/ush. At a distance of 1.7 kpc, the extension of the arc is∆arc∼5 pc for central en- ergy of all MAGIC data of∼800 GeV, corresponding to parent protons of∼8 TeV, leading to a diffusion coefficient upstream of the shock equal to
D1(8 TeV)'λpush=1×1027 λp
4.5 pc
! ush
103km s−1
cm2s−1. (6) Using the test particle approach and following e.g. Drury (1983), from the diffusion coefficient we can estimate the ac- celeration time needed to produce particles at 8 TeV as
tacc(p)= 3 u1−u2
D1
u1 +D2
u2
! '8 D1
u21 '4×10⁴yr, (7) which is∼5 times the estimated SNR age (D2is the diffusion co- efficient downstream,u2the velocity of the downstream plasma, andu1the shock speed).
A major uncertainty regarding this interpretation results from the unknown 3-D orientation of theγ-ray emission. The γ-ray data do not allow estimating the distance along the line-of-sight.
Hence, our analysis may e.g. misassign emission belonging to the arc-region and situated outside of the SNR shell to our disk model if, in the 2-D projection, it is mapped onto the SNR shell.
Consequently, a possible misalignment can conceal spectral dif- ferences between the arc-region and the shell. Accordingly, the
precursor could not be excluded based on the spectral similarity.
In that case however, the extension of the arc would be underes- timated by our model, strengthening the argument of the accel- eration time. In summary, a precursor scenario for the arc region seems improbable and instead it is a region where particles es- caping fromγ-Cygni interact with the ISM.
Using the observed extension of the arc we can put a lower limit to the external diffusion coefficient,Dout, assuming that par- ticles located in the arc started escaping at the beginning of the ST phase. Considering the typical energy of 8 TeV for CR pro- tons and reasonable values for the SNR parameters (see Table 1 andMej=5M), we estimate the diffusion coefficient via the length (λdiff =(6Doutt)1/2; factor 6 assumes 3 dimensions):
Dout(8 TeV)=λ2diff
6t '(RSNR+ ∆arc−RST)2
6 (tSNR−tST) '2×1027cm2s−1, (8) where RST = (Mej/ρ0)1/3 and tST = E−1/2SN Mej5/6ρ−1/30 , while
∆arc = 0◦.15 ' 5 pc. The estimated Dout is ∼7×10² times smaller than the average Galactic diffusion coefficient at 8 TeV as obtained from direct CR measurements, i.e. DGal ≈ 6β1028(E/GeV)1/3cm2s−1 (see e.g. Trotta et al. 2011; Yuan et al. 2017). Here and in the rest of the paper we assume a slope of 1/3 typical for Kolmogorov turbulence. If the turbulence were determined by other processes, the slope could be different.
However, a different slope would not affect our main conclu- sions. Even when considering the large systematic uncertainty on the extension of the arc (∆arc would instead be 12 pc), Dout
is still∼3×10²times smaller than the average DGal. Note that changing the SNR parameters in the range reported in Table 1 (always assuming that the estimated extension matches the real one), the ratio DGal/Dout ranges between ∼8×101 to 3×10³. Note, that the considerations in this section would equally apply to a leptonic scenario with the only difference that the parameters would be tested at a parent particle energy of∼2 TeV instead of 8 TeV. Furthermore, the results would also hold when taking the off-set between the SNR shell and the centre of the alternative Gaussian model for the arc-region for∆arc∼0◦.1.
The result obtained in Eq. (8) represents an underestimation for two reasons: 1) we assume that the arc mainly extends or- thogonally to the line of sight. If this is not true,∆arcwould be larger than 5 pc, resulting in a largerDout. 2) the arc could rep- resent an over-dense region. If beyond such region the density drops to a lower value,γ-rays could be undetectable even if CR have diffused beyond∆arc. A more thorough discussion on this point will be given in section 5.3.
In the escape scenario, CRs are expected to escape radially symmetrically or, in case of a dominant main magnetic field, to escape mainly along the magnetic field direction. Emission be- yond the shell should thus not be solely seen in the direction of the arc. A straightforward explanation could be that the arc has a larger density than the rest of the circumstellar medium (see dis- cussion in Sect. 5.1). Additionally, a large scale magnetic field oriented in the direction of the arc may cause a larger density of particles escaping into the arc region and can explain why emission is concentrated there (Nava & Gabici 2013). Indeed, the radio emission indicates that the magnetic field is directed along the arc. In fact, the radio shell is not homogeneous but presents two main lobes in the south-east and north-west, the latter roughly agreeing with the direction of the arc. Because the shock acceleration theory predicts a larger efficiency for the par-