• Keine Ergebnisse gefunden

Measurement of charm fragmentation ratios and fractions in photoproduction at HERA

N/A
N/A
Protected

Academic year: 2021

Aktie "Measurement of charm fragmentation ratios and fractions in photoproduction at HERA"

Copied!
37
0
0

Wird geladen.... (Jetzt Volltext ansehen)

Volltext

(1)

arXiv:hep-ex/0508019 v2 13 Sep 2005

DESY–05–147 August 2005

Measurement of charm fragmentation ratios and fractions in photoproduction at HERA

ZEUS Collaboration

Abstract

The production of D + , D 0 , D + , D s + and Λ + c charm hadrons and their antipar- ticles in ep scattering at HERA was measured with the ZEUS detector using an integrated luminosity of 79 pb 1 . The measurement has been performed in the photoproduction regime with the exchanged-photon virtuality Q 2 < 1 GeV 2 and for photon-proton centre-of-mass energies in the range 130 < W < 300 GeV.

The charm hadrons were reconstructed in the range of transverse momentum p T (D, Λ c ) > 3.8 GeV and pseudorapidity | η(D, Λ c ) | < 1.6. The production cross sections were used to determine the ratio of neutral and charged D-meson pro- duction rates, R u/d , the strangeness-suppression factor, γ s , and the fraction of charged D mesons produced in a vector state, P v d . The measured R u/d and γ s

values agree with those obtained in deep inelastic scattering and in e + e an-

nihilations. The measured P v d value is smaller than, but consistent with, the

previous measurements. The fractions of c quarks hadronising as a particular

charm hadron, f(c → D, Λ c ), were derived in the given kinematic range. The

measured open-charm fragmentation fractions are consistent with previous re-

sults, although the measured f (c → D + ) is smaller and f (c → Λ + c ) is larger

than those obtained in e + e annihilations. These results generally support the

hypothesis that fragmentation proceeds independently of the hard sub-process.

(2)

The ZEUS Collaboration

S. Chekanov, M. Derrick, S. Magill, S. Miglioranzi 1 , B. Musgrave, J. Repond, R. Yoshida Argonne National Laboratory, Argonne, Illinois 60439-4815, USA n

M.C.K. Mattingly

Andrews University, Berrien Springs, Michigan 49104-0380, USA N. Pavel, A.G. Yag¨ ues Molina

Institut f¨ ur Physik der Humboldt-Universit¨at zu Berlin, Berlin, Germany

P. Antonioli, G. Bari, M. Basile, L. Bellagamba, D. Boscherini, A. Bruni, G. Bruni, G. Cara Romeo, L. Cifarelli, F. Cindolo, A. Contin, M. Corradi, S. De Pasquale, P. Giusti, G. Iacobucci, A. Margotti, A. Montanari, R. Nania, F. Palmonari, A. Pesci, A. Polini, L. Rinaldi, G. Sartorelli, A. Zichichi

University and INFN Bologna, Bologna, Italy e

G. Aghuzumtsyan, D. Bartsch, I. Brock, S. Goers, H. Hartmann, E. Hilger, P. Irrgang 2 , H.-P. Jakob, O.M. Kind, U. Meyer, E. Paul 3 , J. Rautenberg, R. Renner, M. Wang, M. Wlasenko

Physikalisches Institut der Universit¨at Bonn, Bonn, Germany b

D.S. Bailey 4 , N.H. Brook, J.E. Cole, G.P. Heath, T. Namsoo, S. Robins

H.H. Wills Physics Laboratory, University of Bristol, Bristol, United Kingdom m M. Capua, S. Fazio, A. Mastroberardino, M. Schioppa, G. Susinno, E. Tassi Calabria University, Physics Department and INFN, Cosenza, Italy e

J.Y. Kim, K.J. Ma 5

Chonnam National University, Kwangju, South Korea g M. Helbich, Y. Ning, Z. Ren, W.B. Schmidke, F. Sciulli

Nevis Laboratories, Columbia University, Irvington on Hudson, New York 10027 o J. Chwastowski, A. Eskreys, J. Figiel, A. Galas, M. Gil, K. Olkiewicz, P. Stopa, D. Szuba, L. Zawiejski

The Henryk Niewodniczanski Institute of Nuclear Physics, Polish Academy of Sciences, Cracow, Poland i

L. Adamczyk, T. Bo ld, I. Grabowska-Bo ld, D. Kisielewska, J. Lukasik, M. Przybycie´ n, L. Suszycki, J. Szuba 6

Faculty of Physics and Applied Computer Science, AGH-University of Science and Tech- nology, Cracow, Poland p

A. Kota´ nski 7 , W. S lomi´ nski

Department of Physics, Jagellonian University, Cracow, Poland

(3)

V. Adler, U. Behrens, I. Bloch, K. Borras, G. Drews, J. Fourletova, A. Geiser, D. Gladkov, P. G¨ottlicher 8 , O. Gutsche, T. Haas, W. Hain, C. Horn, B. Kahle, U. K¨otz, H. Kowal- ski, G. Kramberger, H. Lim, B. L¨ohr, R. Mankel, I.-A. Melzer-Pellmann, C.N. Nguyen, D. Notz, A.E. Nuncio-Quiroz, A. Raval, R. Santamarta, U. Schneekloth, H. Stadie, U. St¨osslein, G. Wolf, C. Youngman, W. Zeuner

Deutsches Elektronen-Synchrotron DESY, Hamburg, Germany S. Schlenstedt

Deutsches Elektronen-Synchrotron DESY, Zeuthen, Germany G. Barbagli, E. Gallo, C. Genta, P. G. Pelfer

University and INFN, Florence, Italy e

A. Bamberger, A. Benen, F. Karstens, D. Dobur, N.N. Vlasov 9

Fakult¨at f¨ ur Physik der Universit¨at Freiburg i.Br., Freiburg i.Br., Germany b

P.J. Bussey, A.T. Doyle, W. Dunne, J. Ferrando, J.H. McKenzie, D.H. Saxon, I.O. Skil- licorn

Department of Physics and Astronomy, University of Glasgow, Glasgow, United King- dom m

I. Gialas 10

Department of Engineering in Management and Finance, Univ. of Aegean, Greece T. Carli 11 , T. Gosau, U. Holm, N. Krumnack 12 , E. Lohrmann, M. Milite, H. Salehi, P. Schleper, T. Sch¨orner-Sadenius, S. Stonjek 13 , K. Wichmann, K. Wick, A. Ziegler, Ar. Ziegler

Hamburg University, Institute of Exp. Physics, Hamburg, Germany b

C. Collins-Tooth 14 , C. Foudas, C. Fry, R. Gon¸calo 15 , K.R. Long, A.D. Tapper

Imperial College London, High Energy Nuclear Physics Group, London, United King- dom m

M. Kataoka 16 , K. Nagano, K. Tokushuku 17 , S. Yamada, Y. Yamazaki Institute of Particle and Nuclear Studies, KEK, Tsukuba, Japan f A.N. Barakbaev, E.G. Boos, N.S. Pokrovskiy, B.O. Zhautykov

Institute of Physics and Technology of Ministry of Education and Science of Kazakhstan, Almaty, Kazakhstan

D. Son

Kyungpook National University, Center for High Energy Physics, Daegu, South Korea g J. de Favereau, K. Piotrzkowski

Institut de Physique Nucl´eaire, Universit´e Catholique de Louvain, Louvain-la-Neuve, Bel-

gium q

(4)

F. Barreiro, C. Glasman 18 , M. Jimenez, L. Labarga, J. del Peso, J. Terr´on, M. Zambrana Departamento de F´ısica Te´orica, Universidad Aut´onoma de Madrid, Madrid, Spain l F. Corriveau, C. Liu, M. Plamondon, A. Robichaud-Veronneau, R. Walsh, C. Zhou Department of Physics, McGill University, Montr´eal, Qu´ebec, Canada H3A 2T8 a T. Tsurugai

Meiji Gakuin University, Faculty of General Education, Yokohama, Japan f

A. Antonov, B.A. Dolgoshein, I. Rubinsky, V. Sosnovtsev, A. Stifutkin, S. Suchkov Moscow Engineering Physics Institute, Moscow, Russia j

R.K. Dementiev, P.F. Ermolov, L.K. Gladilin, I.I. Katkov, L.A. Khein, I.A. Korzhav- ina, V.A. Kuzmin, B.B. Levchenko, O.Yu. Lukina, A.S. Proskuryakov, L.M. Shcheglova, D.S. Zotkin, S.A. Zotkin

Moscow State University, Institute of Nuclear Physics, Moscow, Russia k I. Abt, C. B¨ uttner, A. Caldwell, X. Liu, J. Sutiak

Max-Planck-Institut f¨ ur Physik, M¨ unchen, Germany

N. Coppola, G. Grigorescu, A. Keramidas, E. Koffeman, P. Kooijman, E. Maddox, H. Tiecke, M. V´azquez, L. Wiggers

NIKHEF and University of Amsterdam, Amsterdam, Netherlands h N. Br¨ ummer, B. Bylsma, L.S. Durkin, A. Lee, T.Y. Ling

Physics Department, Ohio State University, Columbus, Ohio 43210 n

P.D. Allfrey, M.A. Bell, A.M. Cooper-Sarkar, A. Cottrell, R.C.E. Devenish, B. Foster, C. Gwenlan 19 , T. Kohno, K. Korcsak-Gorzo, S. Patel, V. Roberfroid 20 , P.B. Straub, R. Walczak

Department of Physics, University of Oxford, Oxford United Kingdom m

P. Bellan, A. Bertolin, R. Brugnera, R. Carlin, R. Ciesielski, F. Dal Corso, S. Dusini, A. Garfagnini, S. Limentani, A. Longhin, L. Stanco, M. Turcato

Dipartimento di Fisica dell’ Universit`a and INFN, Padova, Italy e E.A. Heaphy, F. Metlica, B.Y. Oh, J.J. Whitmore 21

Department of Physics, Pennsylvania State University, University Park, Pennsylvania 16802 o

Y. Iga

Polytechnic University, Sagamihara, Japan f G. D’Agostini, G. Marini, A. Nigro

Dipartimento di Fisica, Universit`a ’La Sapienza’ and INFN, Rome, Italy e

(5)

J.C. Hart

Rutherford Appleton Laboratory, Chilton, Didcot, Oxon, United Kingdom m H. Abramowicz 22 , A. Gabareen, S. Kananov, A. Kreisel, A. Levy

Raymond and Beverly Sackler Faculty of Exact Sciences, School of Physics, Tel-Aviv University, Tel-Aviv, Israel d

M. Kuze

Department of Physics, Tokyo Institute of Technology, Tokyo, Japan f S. Kagawa, T. Tawara

Department of Physics, University of Tokyo, Tokyo, Japan f

R. Hamatsu, H. Kaji, S. Kitamura 23 , K. Matsuzawa, O. Ota, Y.D. Ri Tokyo Metropolitan University, Department of Physics, Tokyo, Japan f M. Costa, M.I. Ferrero, V. Monaco, R. Sacchi, A. Solano

Universit`a di Torino and INFN, Torino, Italy e M. Arneodo, M. Ruspa

Universit`a del Piemonte Orientale, Novara, and INFN, Torino, Italy e S. Fourletov, J.F. Martin

Department of Physics, University of Toronto, Toronto, Ontario, Canada M5S 1A7 a J.M. Butterworth 24 , R. Hall-Wilton, T.W. Jones, J.H. Loizides 25 , M.R. Sutton 4 , C. Targett- Adams, M. Wing

Physics and Astronomy Department, University College London, London, United King- dom m

J. Ciborowski 26 , G. Grzelak, P. Kulinski, P. Lu˙zniak 27 , J. Malka 27 , R.J. Nowak, J.M. Pawlak, J. Sztuk 28 , T. Tymieniecka, A. Ukleja, J. Ukleja 29 , A.F. ˙Zarnecki

Warsaw University, Institute of Experimental Physics, Warsaw, Poland M. Adamus, P. Plucinski

Institute for Nuclear Studies, Warsaw, Poland

Y. Eisenberg, D. Hochman, U. Karshon, M.S. Lightwood

Department of Particle Physics, Weizmann Institute, Rehovot, Israel c

E. Brownson, T. Danielson, A. Everett, D. K¸cira, S. Lammers, L. Li, D.D. Reeder, M. Rosin, P. Ryan, A.A. Savin, W.H. Smith

Department of Physics, University of Wisconsin, Madison, Wisconsin 53706, USA n S. Dhawan

Department of Physics, Yale University, New Haven, Connecticut 06520-8121, USA n

(6)

S. Bhadra, C.D. Catterall, Y. Cui, G. Hartner, S. Menary, U. Noor, M. Soares, J. Standage, J. Whyte

Department of Physics, York University, Ontario, Canada M3J 1P3 a

(7)

1 also affiliated with University College London, UK

2 now at Siemens VDO/Sensorik, Weissensberg

3 retired

4 PPARC Advanced fellow

5 supported by a scholarship of the World Laboratory Bj¨orn Wiik Research Project

6 partly supported by Polish Ministry of Scientific Research and Information Technology, grant no.2P03B 12625

7 supported by the Polish State Committee for Scientific Research, grant no. 2 P03B 09322

8 now at DESY group FEB, Hamburg, Germany

9 partly supported by Moscow State University, Russia

10 also affiliated with DESY

11 now at CERN, Geneva, Switzerland

12 now at Baylor University, USA

13 now at University of Oxford, UK

14 now at the Department of Physics and Astronomy, University of Glasgow, UK

15 now at Royal Holloway University of London, UK

16 also at Nara Women’s University, Nara, Japan

17 also at University of Tokyo, Japan

18 Ram´on y Cajal Fellow

19 PPARC Postdoctoral Research Fellow

20 EU Marie Curie Fellow

21 on leave of absence at The National Science Foundation, Arlington, VA, USA

22 also at Max Planck Institute, Munich, Germany, Alexander von Humboldt Research Award

23 Department of Radiological Science

24 also at University of Hamburg, Germany, Alexander von Humboldt Fellow

25 partially funded by DESY

26 also at L´od´z University, Poland

27 L´od´z University, Poland

28 L´od´z University, Poland, supported by the KBN grant 2P03B12925

29 supported by the KBN grant 2P03B12725

(8)

a supported by the Natural Sciences and Engineering Research Council of Canada (NSERC)

b supported by the German Federal Ministry for Education and Research (BMBF), under contract numbers HZ1GUA 2, HZ1GUB 0, HZ1PDA 5, HZ1VFA 5

c supported in part by the MINERVA Gesellschaft f¨ ur Forschung GmbH, the Israel Science Foundation (grant no. 293/02-11.2), the U.S.-Israel Binational Science Foundation and the Benozyio Center for High Energy Physics

d supported by the German-Israeli Foundation and the Israel Science Foundation

e supported by the Italian National Institute for Nuclear Physics (INFN)

f supported by the Japanese Ministry of Education, Culture, Sports, Science and Technology (MEXT) and its grants for Scientific Research

g supported by the Korean Ministry of Education and Korea Science and Engi- neering Foundation

h supported by the Netherlands Foundation for Research on Matter (FOM)

i supported by the Polish State Committee for Scientific Research, grant no. 620/E-77/SPB/DESY/P-03/DZ 117/2003-2005 and grant no.

1P03B07427/2004-2006

j partially supported by the German Federal Ministry for Education and Re- search (BMBF)

k supported by RF Presidential grant N 1685.2003.2 for the leading scientific schools and by the Russian Ministry of Education and Science through its grant for Scientific Research on High Energy Physics

l supported by the Spanish Ministry of Education and Science through funds provided by CICYT

m supported by the Particle Physics and Astronomy Research Council, UK

n supported by the US Department of Energy

o supported by the US National Science Foundation

p supported by the Polish Ministry of Scientific Research and Information Tech- nology, grant no. 112/E-356/SPUB/DESY/P-03/DZ 116/2003-2005 and 1 P03B 065 27

q supported by FNRS and its associated funds (IISN and FRIA) and by an

Inter-University Attraction Poles Programme subsidised by the Belgian Federal

Science Policy Office

(9)

1 Introduction

Charm quark production has been extensively studied at HERA using D ∗± and D ± s mesons [1–5]. The data have been compared with theoretical predictions by assuming the universality of charm fragmentation and using the charm fragmentation characteris- tics obtained in e + e annihilation for the calculations of charm production in ep scat- tering. However, the charm production mechanisms are not the same in different colli- sions. In particular, c¯ c pairs in e + e annihilation are produced dominantly in a colour- singlet state, which is not the case for ep scattering. Thus, it is important to test the charm-fragmentation universality by measuring the charm fragmentation characteristics at HERA.

In this paper, the measurement of the production of the weakly decaying charm ground states, the D 0 , D + , D s + pseudo-scalar mesons and the Λ + c baryon, is presented. The production of the charm vector meson D + has also been studied. The antiparticles of these charm hadrons have been measured as well 1 . The measurement has been per- formed in ep scattering at HERA in the photoproduction regime with exchanged-photon virtuality, Q 2 , close to zero and for photon-proton centre-of-mass energies in the range 130 < W < 300 GeV. The measured production cross sections have been used to deter- mine the ratio of neutral and charged D meson production rates, R u/d , the strangeness- suppression factor, γ s , and the fraction of charged D mesons produced in a vector state, P v d . The fractions of c quarks hadronising as a particular charm hadron, f (c → D, Λ c ), have been calculated in the accepted kinematic range. The open-charm fragmentation fractions in photoproduction are reported here for the first time. The results have been compared with the previous HERA measurements of the charm fragmentation character- istics in photoproduction [4] and in deep inelastic scattering (DIS) with Q 2 > 2 GeV 2 [6].

To compare the results with those obtained in charm production in e + e annihilations, the f(c → D, Λ c ) fractions compiled previously [7] have been updated using recent values [8]

of the relevant branching ratios.

2 Experimental set-up

The analysis was performed with data taken by the ZEUS Collaboration from 1998 to 2000. In this period, HERA collided electrons or positrons 2 with energy E e = 27.5 GeV and protons with energy E p = 920 GeV. The results are based on a sum of the e p and e + p samples corresponding to a total integrated luminosity of 78.6 ± 1.7 pb 1 . Due to

1 Hereafter, charge conjugation is implied.

2 From now on, the word “electron” is used as a generic term for electrons and positrons.

(10)

trigger considerations, D + and Λ + c production was measured using only the e + p sample corresponding to an integrated luminosity of 65.1 ± 1.5 pb 1 .

A detailed description of the ZEUS detector can be found elsewhere [9]. A brief outline of the components most relevant to this analysis is given below.

Charged particles are tracked in the central tracking detector (CTD) [10], which operates in a magnetic field of 1.43 T provided by a thin superconducting solenoid. The CTD consists of 72 cylindrical drift chamber layers, organized in nine superlayers covering the polar-angle 3 region 15 < θ < 164 . The transverse-momentum resolution for full-length tracks is σ(p T )/p T = 0.0058p T ⊕ 0.0065 ⊕ 0.0014/p T , with p T in GeV. To estimate the energy loss per unit length, dE/dx, of particles in the CTD [4,11], the truncated mean of the anode-wire pulse heights was calculated, which removes the lowest 10% and at least the highest 30% depending on the number of saturated hits. The measured dE/dx values were normalised to the dE/dx peak position for tracks with momenta 0.3 < p < 0.4 GeV, the region of minimum ionisation for pions. Henceforth dE/dx is quoted in units of minimum ionising particles (mips). The resolution of the dE/dx measurement for full-length tracks is about 9%.

The high-resolution uranium–scintillator calorimeter (CAL) [12] consists of three parts:

the forward (FCAL), the barrel (BCAL) and the rear (RCAL) calorimeters. Each part is subdivided transversely into towers and longitudinally into one electromagnetic sec- tion (EMC) and either one (in RCAL) or two (in BCAL and FCAL) hadronic sections (HAC). The smallest subdivision of the calorimeter is called a cell. The CAL energy res- olutions, as measured under test-beam conditions, are σ(E)/E = 0.18/ √

E for electrons and σ(E)/E = 0.35/ √

E for hadrons, with E in GeV.

The luminosity was determined from the rate of the bremsstrahlung process ep → eγp, where the photon was measured with a lead–scintillator calorimeter [13] located at Z =

− 107 m.

3 Event simulation

Monte Carlo (MC) samples of charm and beauty events were produced with the Pythia 6.156 [14], Rapgap 2.0818 [15] and Herwig 6.301 [16] event generators. The generation, based on leading-order matrix elements, includes direct photon processes, in which the photon couples as a point-like object in the hard scatter, and resolved photon processes,

3 The ZEUS coordinate system is a right-handed Cartesian system, with the Z axis pointing in the

proton beam direction, referred to as the “forward direction”, and the X axis pointing left towards

the centre of HERA. The coordinate origin is at the nominal interaction point.

(11)

where the photon acts as a source of partons, one of which participates in the hard scattering process. Initial- and final-state parton showering is added to simulate higher- order processes. The CTEQ5L [17] and GRV LO [18] parametrisations were used for the proton and photon structure functions, respectively. The charm and bottom quark masses were set to 1.5 GeV and 4.75 GeV, respectively. Events for all processes were generated in proportion to the predicted MC cross sections. The Lund string model [19]

as implemented in Jetset [14] was used for hadronisation in Pythia and Rapgap . The Bowler modification [20] of the Lund symmetric fragmentation function [21] was used for the charm and bottom quark fragmentation. In Herwig , the cluster model [22] was used for hadronisation. The fraction of charged D mesons produced in a vector state was set to 0.6 for all MC samples.

The Pythia and Rapgap generators were tuned to describe the photoproduction and DIS regimes, respectively. Consequently, the Pythia events, generated with Q 2 < 0.6 GeV 2 , were combined with the Rapgap events, generated with Q 2 > 0.6 GeV 2 . Diffractive events, characterised by a large rapidity gap between the proton at high rapidities and the centrally-produced hadronic system, were generated using the Rapgap generator in the diffractive mode and combined with the non-diffractive MC sample. The contribution of diffractive events was estimated by fitting the η max distribution 4 of the data with a linear combination of the non-diffractive and diffractive MC samples. The combined sample was used to evaluate the nominal acceptances. The Herwig MC sample, generated over the full range of Q 2 values, was used to estimate the model dependence of the acceptance corrections.

To ensure a good description of the data, the transverse momenta, p T (D, Λ c ), and pseu- dorapidity, η(D, Λ c ), distributions were reweighted for both combined Pythia + Rapgap and Herwig MC samples. The reweighting factors were tuned using a large D ∗± sam- ple [23]. The effect of the reweighting on the measured fragmentation ratios and fractions was small; the reweighting uncertainty was included when estimating the model depen- dence of the acceptance corrections.

The generated events were passed through a full simulation of the detector using Geant 3.13 [24] and processed with the same reconstruction program as used for the data.

4 Event selection

A three-level trigger system was used to select events online [9,25]. The first- and second- level trigger used CAL and CTD data to select ep collisions and to reject beam-gas

4 The quantity η max is defined as the pseudorapidity of the CAL energy deposit with the lowest polar

angle and an energy above 400 MeV.

(12)

events. At the third level, where the full event information was available, at least one reconstructed charm-hadron candidate was required. The efficiency of the online charm- hadron reconstruction, determined relative to the efficiency of the offline reconstruction, was above 95%.

Photoproduction events were selected by requiring that no scattered electron was identi- fied in the CAL [26]. The Jacquet-Blondel [27] estimator of W , W JB = p

2E p (E − p Z ), was used, where E − p Z = Σ i (E − p Z ) i and the sum i runs over all final state energy-flow objects [28] produced from charged tracks, as measured in the CTD, and energy clusters measured in the CAL. After correcting for detector effects, the most important of which were energy losses in inactive material in front of the CAL and particle losses in the beam pipe [26, 29], events were selected in the interval 130 < W < 300 GeV. The lower limit was set by the trigger requirements, while the upper limit was imposed to suppress re- maining DIS events with an unidentified scattered electron in the CAL [26]. Under these conditions, the photon virtuality lies below 1 GeV 2 . The median Q 2 value was estimated from a Monte Carlo simulation to be about 3 × 10 4 GeV 2 .

5 Reconstruction of charm hadrons

The production of D + , D 0 , D + , D + s and Λ + c charm hadrons was measured in the range of transverse momentum p T (D, Λ c ) > 3.8 GeV and pseudorapidity | η(D, Λ c ) | < 1.6. Charm hadrons were reconstructed using tracks measured in the CTD and assigned to the re- constructed event vertex. To ensure good momentum resolution, each track was re- quired to reach at least the third superlayer of the CTD. The combinatorial background was significantly reduced by requiring p T (D)/E T θ>10

> 0.2 and p T (Λ c )/E T θ>10

> 0.25 for charm mesons and baryons, respectively. The transverse energy was calculated as E T θ>10

= Σ i,θ

i

>10

(E i sin θ i ), where the sum runs over all energy deposits in the CAL with the polar angle θ above 10 . Further background reduction was achieved by imposing cuts on the transverse momenta and decay angles of the charm-hadron decay products.

The cut values were tuned using MC simulation to enhance signal over background ratios while keeping acceptances high.

The details of the reconstruction of the five charm-hadron samples are given in the next sub-sections.

5.1 Reconstruction of D 0 mesons

The D 0 mesons were reconstructed from the decay D 0 → K π + . In each event, tracks

with opposite charges and p T > 0.8 GeV were combined in pairs to form D 0 candidates.

(13)

The nominal kaon and pion masses were assumed in turn for each track and the pair invariant mass, M(Kπ), was calculated. The distribution of the cosine of the D 0 decay angle (defined as the angle θ (K ) between the kaon in the Kπ rest frame and the Kπ line of flight in the laboratory frame) is flat, whereas the combinatorial background peaks in the forward and backward directions. To suppress the background, | cos θ (K) | < 0.85 was required.

For selected D 0 candidates, a search was performed for a track that could be a “soft” pion (π s ) in a D + → D 0 π s + decay. The soft pion was required to have p T > 0.2 GeV and a charge opposite to that of the particle taken as a kaon. The p T cut was raised to 0.25 GeV for a data subsample, corresponding to an integrated luminosity of 16.9 ± 0.4 pb 1 , for which the low-momentum track reconstruction efficiency was smaller due to the operating conditions of the CTD [30]. The corresponding D 0 candidate was assigned to a class of candidates “with ∆M tag” if the mass difference, ∆M = M (Kππ s ) − M (Kπ), was in the range 0.143 < ∆M < 0.148 GeV. All remaining D 0 candidates were assigned to a class of candidates “without ∆M tag”. For D 0 candidates with ∆M tag, the kaon and pion mass assignment was fixed by the track-charge requirements. For D 0 mesons without

∆M tag, the mass assignment is ambiguous. The pion and kaon masses can therefore be assigned to two tracks either correctly, producing a signal peak, or incorrectly, producing a wider reflected signal. To remove this reflection, the mass distribution, obtained for D 0 candidates with ∆M tag and an opposite mass assignment to the kaon and pion tracks, was subtracted from the M (Kπ) distribution for all D 0 candidates without ∆M tag.

The subtracted mass distribution was normalised to the ratio of numbers of D 0 mesons without and with ∆M tag obtained from a fit described below.

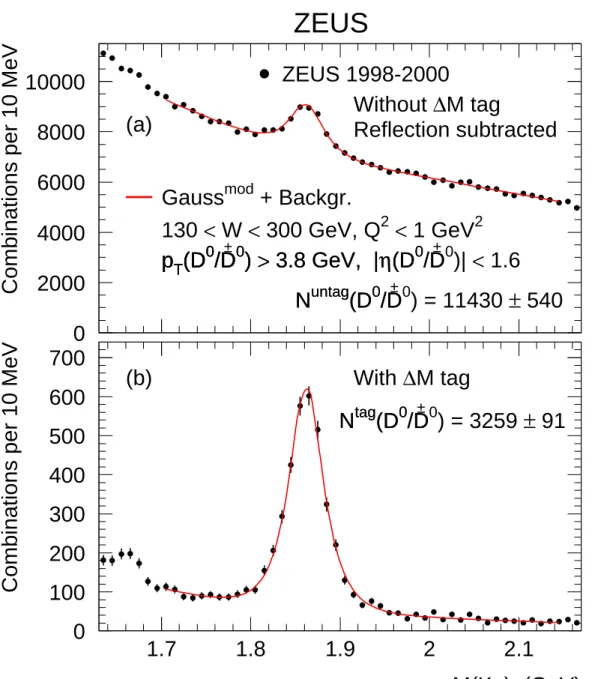
Figure 1 shows the M (Kπ) distribution for D 0 candidates without ∆M tag, obtained after the reflection subtraction, and the M(Kπ) distribution for D 0 candidates with ∆M tag. Clear signals are seen at the nominal value of M (D 0 ) in both distributions. The distributions were fitted simultaneously assuming the same shape for signals in both distributions. To describe the shape, a “modified” Gaussian function was used:

Gauss mod ∝ exp[ − 0.5 · x 1+1/(1+0.5 · x) ], (1) where x = | [M (Kπ) − M 0 ]/σ | . This functional form described both data and MC signals well. The signal position, M 0 , and width, σ, as well as the numbers of D 0 mesons in each signal were free parameters of the fit. Monte Carlo studies showed that background shapes in both distributions are compatible with being linear in the mass range above the signals. For smaller M (Kπ) values, the background shapes exhibit an exponential enhancement due to contributions from other D 0 decay modes and other D mesons.

Therefore the background shape in the fit was described by the form [A + B · M (Kπ)] for

M(Kπ) > 1.86 GeV and [A+B · M (Kπ)] · exp { C · [M (Kπ) − 1.86] } for M (Kπ) < 1.86 GeV.

(14)

The free parameters A, B and C were assumed to be independent for the two M (Kπ) distributions. The numbers of D 0 mesons yielded by the fit were N untag (D 0 ) = 11430 ± 540 and N tag (D 0 ) = 3259 ± 91 for selections without and with ∆M tag, respectively.

5.2 Reconstruction of additional D + mesons

The D + → D 0 π s + events with p T (D + ) > 3.8 GeV and | η(D + ) | < 1.6 can be consid- ered as a sum of two subsamples: events with the D 0 having p T (D 0 ) > 3.8 GeV and

| η(D 0 ) | < 1.6, and events with the D 0 outside of that kinematic range. The former sam- ple is represented by D 0 mesons reconstructed with ∆M tag, as discussed in the previous section. The latter sample of “additional” D + mesons was obtained using the same D 0 → K π + decay channel and an independent selection described below.

In each event, tracks with opposite charges and p T > 0.4 GeV were combined in pairs to form D 0 candidates. To calculate the pair invariant mass, M (Kπ), kaon and pion masses were assumed in turn for each track. Only D 0 candidates which satisfy 1.81 <

M (Kπ) < 1.92 GeV were kept. Moreover, the D 0 candidates were required to have either p T (D 0 ) < 3.8 GeV or | η(D 0 ) | > 1.6. Any additional track, with p T > 0.2 GeV and a charge opposite to that of the kaon track, was assigned the pion mass and combined with the D 0 candidate to form a D + candidate with invariant mass M (Kππ s ). Here again the p T cut was raised to 0.25 GeV for the data subsample for which the low-momentum track reconstruction efficiency was smaller.

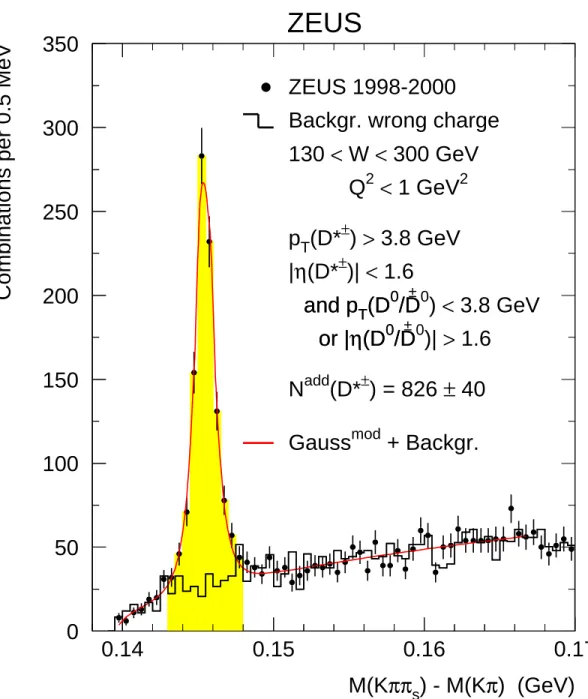
Figure 2 shows the ∆M distribution for the D + candidates after all cuts. A clear signal is seen at the nominal value of M(D + ) − M(D 0 ). The combinatorial background was estimated from the mass-difference distribution for wrong-charge combinations, in which both tracks forming the D 0 candidate have the same charge and the third track has the opposite charge. The same tracks from a wrong-charge combination can produce two D 0 candidates due to an ambiguity in the kaon and pion mass assignment to tracks with the same charge. To exclude double counting, the multiple combinations of the same tracks which passed all cuts, including the M (Kπ) requirement, were included with a weight 1/2.

The number of reconstructed additional D + mesons was determined by subtracting the wrong-charge ∆M distribution after normalising it to the distribution of D + candidates with the appropriate charges in the range 0.15 < ∆M < 0.17 GeV. The subtraction, performed in the signal range 0.143 < ∆M < 0.148 GeV, yielded N add (D + ) = 826 ± 40.

The ∆M distribution was also fitted to a sum of the modified Gaussian function (Eq. (1)) describing the signal and a threshold function describing the non-resonant background.

The threshold function had a form A · (∆M − m π ) B , where m π is the pion mass [8]

(15)

and A and B were free parameters. The results obtained using the fit instead of the subtraction procedure were used to estimate the systematic uncertainty of the signal extraction procedure.

5.3 Reconstruction of D + mesons

The D + mesons were reconstructed from the decay D + → K π + π + . In each event, two tracks with the same charges and p T > 0.5 GeV and a third track with opposite charge and p T > 0.7 GeV were combined to form D + candidates. The pion masses were assigned to the two tracks with the same charges and the kaon mass was assigned to the third track, after which the candidate invariant mass, M(Kππ), was calculated. To suppress the combinatorial background, a cut of cos θ (K) > − 0.75 was imposed, where θ (K) is the angle between the kaon in the Kππ rest frame and the Kππ line of flight in the laboratory frame. To suppress background from D + decays, combinations with M(Kππ) − M (Kπ) < 0.15 GeV were removed. The background from D + s → φπ + with φ → K + K was suppressed by requiring that the invariant mass of any two D + candidate tracks with opposite charges was not within ± 8 MeV of the φ mass [4] when the kaon mass was assigned to both tracks.

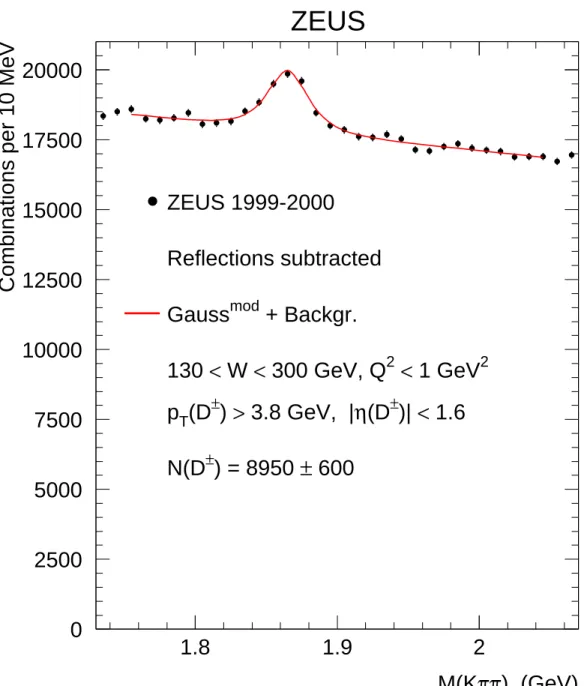
Figure 3 shows the M (Kππ) distribution for the D + candidates after all cuts. Reflections from D s + and Λ + c decays to three charged particles were subtracted using the simulated reflection shapes normalised to the measured D + s and Λ + c production rates. A clear signal is seen at the nominal value of D + mass. The mass distribution was fitted to a sum of a modified Gaussian function (Eq. (1)) describing the signal and a linear function describing the non-resonant background. The number of reconstructed D + mesons yielded by the fit was N (D + ) = 8950 ± 600.

5.4 Reconstruction of D s + mesons

The D s + mesons were reconstructed from the decay D + s → φπ + with φ → K + K . In each event, tracks with opposite charges and p T > 0.7 GeV were assigned the kaon mass and combined in pairs to form φ candidates. The φ candidate was kept if its invariant mass, M(KK ), was within ± 8 MeV of the φ mass [4]. Any additional track with p T > 0.5 GeV was assigned the pion mass and combined with the φ candidate to form a D + s candidate with invariant mass M (KKπ). To suppress the combinatorial background, the following requirements were applied:

• cos θ (π) < 0.85, where θ (π) is the angle between the pion in the KKπ rest frame

and the KKπ line of flight in the laboratory frame;

(16)

• | cos 3 θ (K) | > 0.1, where θ (K) is the angle between one of the kaons and the pion in the KK rest frame. The decay of the pseudoscalar D s + meson to the φ (vector) plus π + (pseudoscalar) final state results in an alignment of the spin of the φ meson with respect to the direction of motion of the φ relative to D + s . Consequently, the distribution of cos θ (K) follows a cos 2 θ (K ) shape, implying a flat distribution for cos 3 θ (K). In contrast, the cos θ (K ) distribution of the combinatorial background is flat and its cos 3 θ (K) distribution peaks at zero. The cut suppressed the background significantly while reducing the signal by 10%.

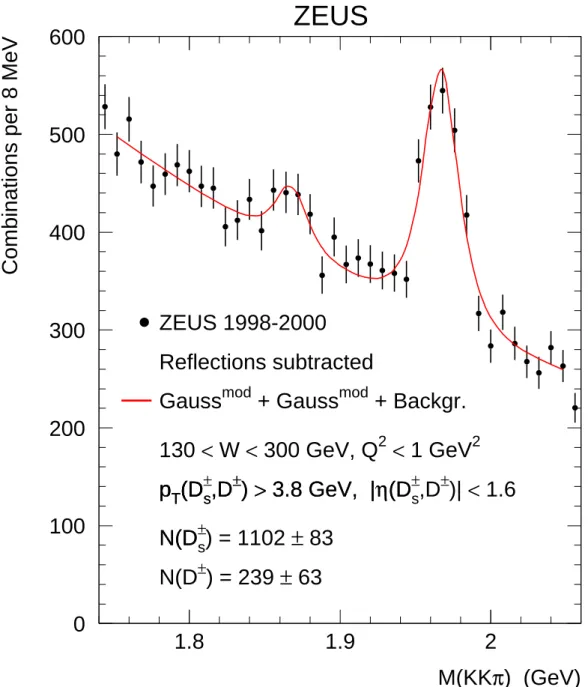
Figure 4 shows the M (KKπ) distribution for the D s + candidates after all cuts. Reflections from D + and Λ + c decays to three charged particles were subtracted using the simulated reflection shapes normalised to the measured D + and Λ + c production rates. A clear signal is seen at the nominal D + s mass. There is also a smaller signal around the nominal D + mass as expected from the decay D + → φπ + with φ → K + K . The mass distribution was fitted to a sum of two modified Gaussian functions (Eq. (1)) describing the signals and an exponential function describing the non-resonant background. To reduce the number of free parameters, the width of the D + signal was constrained to 8/9 of the D + s signal width; the constraint was verified by MC studies. The number of reconstructed D s + mesons yielded by the fit was N (D + s ) = 1102 ± 83 5 .

5.5 Reconstruction of Λ + c baryons

The Λ + c baryons were reconstructed from the decay Λ + c → K + . In each event, two same-charge tracks and a third track with opposite charge were combined to form Λ + c candidates. Due to the large difference between the proton and pion masses, the proton momentum is typically larger than that of the pion. Therefore, the proton (pion) mass was assigned to those of the two tracks with the same charges which had larger (smaller) mo- mentum. The kaon mass was assigned to the third track and the candidate invariant mass, M (Kpπ), was calculated. Only candidates with p T (K) > 0.75 GeV, p T (p) > 1.3 GeV and p T (π) > 0.5 GeV were kept. To suppress the combinatorial background, the following requirements, motivated by MC studies, were applied:

• cos θ (K) > − 0.9, where θ (K) is the angle between the kaon in the Kpπ rest frame and the Kpπ line of flight in the laboratory frame;

• cos θ (p) > − 0.25, where θ (p) is the angle between the proton in the Kpπ rest frame and the Kpπ line of flight in the laboratory frame;

• p (π) > 90 MeV, where p (π) is the pion momentum in the Kpπ rest frame.

5 The number of D + mesons, 239 ± 63, was not used further in the analysis.

(17)

To suppress the combinatorial background further, the measured dE/dx values of the three Λ + c candidate tracks were used. The parametrisations of the dE/dx expectation values and the χ 2 1 probabilities l p , l K and l π of the proton, kaon and pion hypotheses, respectively, were obtained in the same way as described in a previous publication [23].

The l p , l K and l π distributions for the Λ + c candidate tracks show sharp peaks around zero and become relatively flat towards one. To maximise the ratios of the numbers of correctly assigned protons, kaons and pions to the square roots of the numbers of background particles, the cuts l p > 0.15, l K > 0.03 and l π > 0.01 were applied. The cuts rejected those ranges where the l p , l K and l π distributions were at least twice as high as in the range 0.8 − 1.

Figure 5 shows the M (Kpπ) distribution for the Λ + c candidates after all cuts. Reflections from D + and D + s decays to three charged particles were subtracted using the simulated reflection shapes normalised to the measured D + and D s + production rates. A clear signal is seen at the nominal Λ + c mass. The mass distribution was fitted to a sum of a modified Gaussian function (Eq. (1)) describing the signal and a linear function describing the non-resonant background. The number of reconstructed Λ + c baryons yielded by the fit was N (Λ + c ) = 1440 ± 220.

6 Charm-hadron production cross sections

The charm-hadron cross sections were calculated for the process ep → eD(Λ c )X in the kinematic region Q 2 < 1 GeV 2 , 130 < W < 300 GeV, p T (D, Λ c ) > 3.8 GeV and

| η(D, Λ c ) | < 1.6. The cross section for a given charm hadron was calculated from σ(D, Λ c ) = N (D, Λ c )

A · L · B ,

where N (D, Λ c ) is the number of reconstructed charm hadrons, A is the acceptance for this charm hadron, L is the integrated luminosity and B is the branching ratio or the product of the branching ratios [8] for the decay channel used in the reconstruction. The third uncertainties quoted below for the measured cross sections and charm fragmentation ratios and fractions are due to the branching-ratio uncertainties 6 .

The combined Pythia + Rapgap MC sample was used to evaluate the nominal accep- tances. Small admixtures to the reconstructed signals from other decay modes were taken into account in the acceptance correction procedure. To correct from N tag (D 0 ) (N untag (D 0 )) to the production cross sections for D 0 mesons originating (not originating) from D + decays, small migrations between the two samples were taken into account.

6 Contributions from uncertainties of different branching ratios were added in quadrature.

(18)

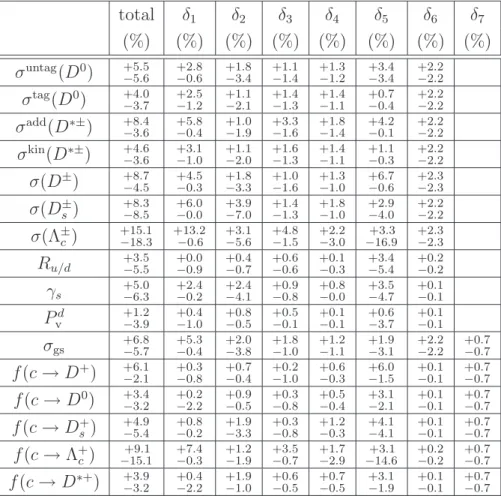
The b-quark relative contributions, predicted by the MC simulation using branching ra- tios of b-quark decays to the charmed hadrons measured at LEP [31, 32], were subtracted from all measured cross sections 7 . Subtraction of the b-quark contribution reduced the measured cross sections by 3 − 7% and changed the measured charm fragmentation ratios and fractions by less than 4%.

Using the reconstructed signals (see Section 5) the following cross sections for the sum of each charm hadron and its antiparticle were calculated. The systematic uncertainties are discussed in Section 8:

• the production cross section for D 0 mesons not originating from the D + → D 0 π s + decays:

σ untag (D 0 ) = 8.49 ± 0.44(stat.) +0.47 − 0.48 (syst.) +0.20 − 0.19 (br.) nb;

• the production cross section for D 0 mesons originating from the D + → D 0 π s + decays:

σ tag (D 0 ) = 2.65 ± 0.08(stat.) +0.11 − 0.10 (syst.) ± 0.06(br.) nb.

The ratio σ tag (D 0 )/ B D

∗+

D

0

π

+

gives the D + cross section, σ(D + ), corresponding to D 0 production in the kinematic range p T (D 0 ) > 3.8 GeV and | η(D 0 ) | < 1.6 for the D + → D 0 π s + decay. Here B D

+

→ D

0

π

+

= 0.677 ± 0.005 [8] is the branching ratio of the D + → D 0 π s + decay;

• the production cross section for additional D + mesons:

σ add (D + ) = 1.05 ± 0.07(stat.) +0.09 − 0.04 (syst.) ± 0.03(br.) nb.

The sum σ add (D + ) + σ tag (D 0 )/ B D

+

→ D

0

π

+

gives the production cross section for D + mesons in the kinematic range p T (D + ) > 3.8 GeV and | η(D + ) | < 1.6:

σ kin (D + ) = 4.97 ± 0.14(stat.) +0.23 − 0.18 (syst.) +0.13 − 0.12 (br.) nb;

• the production cross section for D + mesons:

σ(D + ) = 5.07 ± 0.36(stat.) +0.44 − 0.23 (syst.) +0.34 − 0.30 (br.) nb;

• the production cross section for D s + mesons:

σ(D s + ) = 2.37 ± 0.20(stat.) ± 0.20(syst.) +0.72 − 0.45 (br.) nb;

• the production cross section for Λ + c baryons:

σ(Λ + c ) = 3.59 ± 0.66(stat.) +0.54 − 0.66 (syst.) +1.15 − 0.70 (br.) nb.

7 The branching ratios of the b-quark decays were updated using recent values [8] of the relevant charm-

hadron decay branching ratios.

(19)

7 Charm fragmentation ratios and fractions

7.1 Ratio of neutral to charged D -meson production rates

Neglecting influences from decays of heavier excited D mesons, the ratio of neutral to charged D-meson production rates is given by the ratio of the sum of D 0 and direct D 0 production cross sections to the sum of D + and direct D + production cross sections:

R u/d = σ(D 0 ) + σ dir (D 0 ) σ(D + ) + σ dir (D + ) ,

where σ dir (D 0 ) and σ dir (D + ) are those parts of the D 0 and D + inclusive cross sections which do not originate from D 0 and D + decays. Since all D 0 decays produce a D 0 meson [8], the sum of σ(D 0 ) and σ dir (D 0 ) is the production cross section for D 0 mesons not originating from D + decays:

σ(D 0 ) + σ dir (D 0 ) = σ untag (D 0 ). (2) Subtracting from σ(D + ) the contribution from D + decays gives

σ dir (D + ) = σ(D + ) − σ(D + ) · (1 − B D

+

→ D

0

π

+

). (3) Thus, the ratio of neutral and charged D-meson production rates can be calculated as

R u/d = σ untag (D 0 )

σ(D + ) + σ(D + ) · B D

+

→ D

0

π

+

= σ untag (D 0 ) σ(D + ) + σ tag (D 0 ) .

Using the measured cross sections, the ratio of neutral to charged D-meson production rates, obtained for the kinematic region Q 2 < 1 GeV 2 , 130 < W < 300 GeV, p T (D) >

3.8 GeV and | η(D) | < 1.6, is

R u/d = 1.100 ± 0.078 (stat.) +0.038 − 0.061 (syst.) +0.047 − 0.049 (br.).

The measured R u/d value agrees with unity, i.e. it is consistent with isospin invariance, which implies that u and d quarks are produced equally in charm fragmentation.

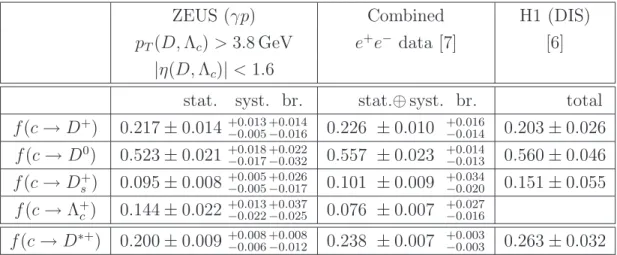
Table 1 compares the measurement with the values obtained in DIS [6] and in e + e annihilations. The latter value was calculated as

R u/d = f (c → D 0 ) − f (c → D + ) · B D

∗+

D

0

π

+

f (c → D + ) + f(c → D + ) · B D

+

D

0

π

+

using fragmentation fractions compiled previously [7] and updated with the recent branch- ing ratio values [8]. All measurements agree with unity within experimental uncertainties.

The branching ratio uncertainties of all measurements are highly correlated.

(20)

7.2 Equivalent phase-space treatment

In the subtraction of the D + contribution to D + production in Eq. (3), the cross-section σ(D + ), corresponding to D 0 production in the kinematic range p T (D 0 ) > 3.8 GeV and | η(D 0 ) | < 1.6 for the D + → D 0 π + s decay, was used. Replacing σ(D + ) with σ tag (D 0 )/ B D

+

→ D

0

π

+

gives

σ dir (D + ) = σ(D + ) − σ tag (D 0 ) · (1 − B D

∗+

D

0

π

+

)/ B D

∗+

D

0

π

+

.

To compare direct D + and D + production, the cross section σ kin (D + ) for p T (D + ) >

3.8 GeV and | η(D + ) | < 1.6 is used in Section 7.4. To compare the inclusive D + and D 0 cross sections with each other and with the inclusive D + cross section it is necessary to take into account that only a fraction of the parent D momentum is transfered to the daughter D meson. For such comparisons, the “equivalent” D + and D 0 cross sections were defined as the sums of their direct cross sections and contributions from D decays calculated using σ kin (D + ) and σ kin (D 0 ):

σ eq (D + ) = σ dir (D + ) + σ kin (D + ) · (1 − B D

+

→ D

0

π

+

), σ eq (D 0 ) = σ dir (D 0 ) + σ kin (D + ) · B D

+

→ D

0

π

+

+ σ kin (D 0 ),

where σ kin (D 0 ) is the inclusive D 0 cross section for p T (D 0 ) > 3.8 GeV and | η(D 0 ) | <

1.6. This cross section can be written as the sum σ(D 0 ) + σ add (D 0 ), where σ(D 0 ) is the part contributing to the D 0 production in the nominal kinematic range (as in Eq. (2)) and σ add (D 0 ) is the production cross section for “additional” D 0 mesons producing D 0 mesons outside of that kinematic range. The latter cross section was calculated using σ add (D + ) and the expression for R u/d :

σ add (D 0 ) = σ add (D + ) · R u/d = σ add (D + ) · σ untag (D 0 ) σ(D + ) + σ tag (D 0 ) .

Using Eqs. (2) and (3) for σ dir (D 0 ) and σ dir (D + ), respectively, and the expressions for σ kin (D 0 ) and σ kin (D + ) gives

σ eq (D 0 ) = σ untag (D 0 ) + σ tag (D 0 ) + σ add (D + ) · (R u/d + B D

∗+

→ D

0

π

+

), σ eq (D + ) = σ(D + ) + σ add (D + ) · (1 − B D

+

→ D

0

π

+

).

MC studies show that such “equivalent phase-space treatment” for the non-strange D and

D mesons minimises differences between the fragmentation ratios and fractions measured

in the accepted p T (D, Λ c ) and η(D, Λ c ) kinematic region and those in the full phase space

(see Section 7.6).

(21)

7.3 Strangeness-suppression factor

The strangeness-suppression factor for charm mesons is given by the ratio of twice the production rate of charm-strange mesons to the production rate of non-strange charm mesons. All D + and D 0 decays produce either a D + or a D 0 meson, while all D s + decays produce a D s + meson [8]. Thus, neglecting decays of heavier excited charm-strange mesons to non-strange charm mesons, the strangeness-suppression factor can be calculated as a ratio of twice the D s + production cross section to the sum of D 0 and D + production cross sections. Using the equivalent D 0 and D + cross sections gives

γ s = 2 σ(D + s )

σ eq (D + ) + σ eq (D 0 ) = 2 σ(D + s )

σ(D + ) + σ untag (D 0 ) + σ tag (D 0 ) + σ add (D + ) · (1 + R u/d ) . Using the measured cross sections, the strangeness-suppression factor, obtained for the kinematic region Q 2 < 1 GeV 2 , 130 < W < 300 GeV, p T (D) > 3.8 GeV and | η(D) | < 1.6, is

γ s = 0.257 ± 0.024 (stat.) +0.013 − 0.016 (syst.) +0.078 − 0.049 (br.).

Thus, charm-strange meson production is suppressed by a factor ≈ 3.9 in charm fragmen- tation. In simulations based on the Lund string fragmentation scheme [33], strangeness suppression is a free parameter which determines the ratio of probabilities to create s to u and d quarks during the fragmentation processes. In the absence of excited charm- strange meson decays to non-strange charm mesons, the Lund strangeness-suppression parameter would be effectively the observable, γ s . In fact, production rates of the excited charm-strange mesons are poorly known; varying these rates in wide ranges in the Pythia simulation suggests that the Lund strangeness-suppression parameter is 10 − 30% larger than the observable, γ s .

Table 2 compares the measurement with the previous ZEUS 96-97 result, calculated from the ratio of D + s to D + cross sections [4], and with the values obtained for charm produc- tion in DIS [6] and in e + e annihilations. The e + e value was calculated as

γ s = 2f (c → D + s ) f (c → D + ) + f (c → D 0 )

using fragmentation fractions compiled previously [7] and updated with the recent branch-

ing ratio values [8]. All measurements agree within experimental uncertainties. The large

branching-ratio uncertainties are dominated by the common uncertainty of the D s + → φπ +

branching ratio. This uncertainty can be ignored in the comparison with other measure-

ments using the same branching ratios.

(22)

7.4 Fraction of charged D mesons produced in a vector state

Neglecting influences from decays of heavier excited D mesons, the fraction of D mesons produced in a vector state is given by the ratio of vector to (vector+pseudoscalar) charm meson production cross sections. Only direct parts of the production cross sections for pseudoscalar charm mesons should be used. Using the expressions for σ kin (D + ) and σ dir (D + ), the fraction for charged charm mesons is given by

P v d = σ kin (D + )

σ kin (D + ) + σ dir (D + ) = σ tag (D 0 )/ B D

∗+

D

0

π

+

+ σ add (D + ) σ(D + ) + σ tag (D 0 ) + σ add (D + ) .

Using the measured cross sections, the fraction of charged D mesons produced in a vector state, obtained for the kinematic region Q 2 < 1 GeV 2 , 130 < W < 300 GeV, p T (D) >

3.8 GeV and | η(D) | < 1.6, is

P v d = 0.566 ± 0.025 (stat.) +0.007 − 0.022 (syst.) +0.022 − 0.023 (br.).

The measured P v d fraction is considerably smaller than the naive spin-counting prediction of 0.75. The predictions of the thermodynamical approach [34] and the string fragmenta- tion approach [35], which both predict 2/3 for the fraction, are closer to, but still above, the measured value. The BKL model [36, 37], based on a tree-level perturbative QCD calculation with the subsequent hadronisation of the (c, q) state, predicts ¯ P v d ≈ 0.6 for charm production in e + e annihilations where only fragmentation diagrams contribute.

For charm photoproduction, where both fragmentation and recombination diagrams con- tribute, the BKL prediction is P v d ≈ 0.66 in the measured kinematic range.

Table 3 compares the measurement with the values obtained in DIS [6] and in e + e annihilations. The latter value was calculated as

P v d = f(c → D + )

f (c → D + ) + f (c → D + ) · B D

∗+

D

0

π

+

using fragmentation fractions compiled previously [7] and updated with the recent branch- ing ratio values [8]. The measured P v d value is smaller than, but consistent with, the pre- vious measurements. The branching-ratio uncertainties of all measurements are highly correlated.

7.5 Charm fragmentation fractions

The fraction of c quarks hadronising as a particular charm hadron, f (c → D, Λ c ), is given

by the ratio of the production cross section for the hadron to the sum of the production

cross sections for all charm ground states that decay weakly. In addition to the measured

(23)

D 0 , D + , D s + and Λ + c charm ground states, the production cross sections of the charm- strange baryons Ξ + c , Ξ 0 c and Ω 0 c should be included in the sum. The production rates for these baryons are expected to be much lower than that of the Λ + c due to strangeness suppression. The relative rates for the charm-strange baryons which decay weakly were estimated from the non-charm sector following the LEP procedure [38]. The measured Ξ /Λ and Ω /Λ relative rates are (6.65 ± 0.28)% and (0.42 ± 0.07)%, respectively [8].

Assuming equal production of Ξ 0 and Ξ states and that a similar suppression is applicable to the charm baryons, the total rate for the three charm-strange baryons relative to the Λ + c state is expected to be about 14%. Therefore the Λ + c production cross section was scaled by the factor 1.14 in the sum of the production cross sections. An error of ± 0.05 was assigned to the scale factor when evaluating systematic uncertainties.

Using the equivalent D 0 and D + cross sections, the sum of the production cross sections for all open-charm ground states (gs) is given by

σ gs = σ eq (D + ) + σ eq (D 0 ) + σ(D + s ) + σ(Λ + c ) · 1.14, which can be expressed as

σ gs = σ(D + ) + σ untag (D 0 ) + σ tag (D 0 ) + σ add (D + ) · (1 + R u/d ) + σ(D s + ) + σ(Λ + c ) · 1.14.

For the measured cross sections,

σ gs = 24.9 ± 1.0 (stat.) +1.7 − 1.4 (syst.) +1.6 − 1.0 (br.) nb.

The fragmentation fractions for the measured charm ground states are given by f (c → D + ) = σ eq (D + )/σ gs = [σ(D + ) + σ add (D + ) · (1 − B D

+

D

0

π

+

)]/σ gs ,

f(c → D 0 ) = σ eq (D 0 )/σ gs

= [σ untag (D 0 ) + σ tag (D 0 ) + σ add (D + ) · (R u/d + B D

+

→ D

0

π

+

)]/σ gs , f (c → D + s ) = σ(D s + )/σ gs ,

f (c → Λ + c ) = σ(Λ + c )/σ gs .

Using σ kin (D + ), the fragmentation fraction for the D + state is given by

f (c → D + ) = σ kin (D + )/σ gs = [σ tag (D 0 )/ B D

+

D

0

π

+

+ σ add (D + )]/σ gs .

The open-charm fragmentation fractions, measured in the kinematic region Q 2 < 1 GeV 2 ,

130 < W < 300 GeV, p T (D, Λ c ) > 3.8 GeV and | η(D, Λ c ) | < 1.6, are summarised in

Table 4. The results are compared with the values obtained in DIS [6] and with the

combined fragmentation fractions for charm production in e + e annihilations compiled

(24)

previously [7] and updated with the recent branching-ratio values [8]. The branching-ratio uncertainties of all measurements are highly correlated. The measurements are consistent although the measured f(c → D + ) is smaller and f(c → Λ + c ) is larger than those obtained in e + e annihilations. About half of the difference in the f (c → D + ) values is due to the difference in the f (c → Λ + c ) values. The measurement may indicate an enhancement of Λ + c production in ep collisions with respect to e + e . However, this is unlikely to be a consequence of the baryon-number-flow effect [39] because no significant asymmetry between the Λ + c and ¯ Λ

c production rates was observed 8 .

7.6 Discussion of extrapolation effects

The charm fragmentation ratios and fractions were measured in the region p T (D, Λ c ) >

3.8 GeV and | η(D, Λ c ) | < 1.6. To minimise differences between the values measured in the accepted p T (D, Λ c ) and η(D, Λ c ) kinematic region and those in the full phase space, the equivalent phase-space treatment for the non-strange D and D mesons was used (see Section 7.2).

Table 5 shows estimates of extrapolation factors correcting the values measured in the accepted p T (D, Λ c ) and η(D, Λ c ) region to the full phase space. The extrapolation factors were determined using three different fragmentation schemes: the Peterson parameteri- sation [40] of the charm fragmentation function as implemented in Pythia , the Bowler modification [20] of the LUND symmetric fragmentation function [21] as implemented in Pythia and the cluster model [22] as implemented in Herwig . The quoted uncertainties were obtained by varying relevant parameters in the Pythia and Herwig MC genera- tors. The extrapolation factors obtained are generally close to unity. The only exceptions are the factors given by the cluster model for f(c → Λ + c ) and, to a lesser extent, for γ s

and f (c → D + s ).

This MC study suggests that the measured charm fragmentation ratios and fractions are close to those in the full p T (D, Λ c ) and η(D, Λ c ) phase space.

8 Systematic uncertainties

The systematic uncertainties of the measured cross sections and fragmentation ratios and fractions were determined by changing the analysis procedure and repeating all calcula- tions. The following groups of the systematic uncertainty sources were considered:

8 Separate fits of the M (K + ) and M (K + pπ ¯ ) distributions yielded N (Λ + c )/N (¯ Λ

c ) = 0.8 ± 0.2.

(25)

• { δ 1 } the model dependence of the acceptance corrections was estimated using the Herwig MC sample, varying the p T (D, Λ c ) and η(D, Λ c ) distributions of the reference MC sample and by changing the MC fraction of charged D mesons produced in a vector state from 0.6 to 0.5 or 0.7;

• { δ 2 } the uncertainty of the beauty subtraction was determined by varying the b- quark cross section by a factor of two in the reference MC sample and by varying the branching ratios of b-quarks to charm hadrons by their uncertainties [31, 32];

• { δ 3 } the uncertainty of the tracking simulation was obtained by varying all momenta by ± 0.3% (magnetic field uncertainty), varying the track-loss probabilities by ± 20%

of their values and by changing the track momentum and angular resolutions by +20 − 10 % of their values. The asymmetric resolution variations were used since the MC signals typically had somewhat narrower widths than observed in the data;

• { δ 4 } the uncertainty of the CAL simulation was determined by varying the CAL energy scale by ± 2%, by changing the CAL energy resolution by ± 20% of its value and by varying the first-level trigger CAL efficiencies;

• { δ 5 } the uncertainties related to the signal extraction procedures were obtained as follows:

– for the D 0 signals with and without ∆M tag: the background parametrisation and the range used for the signal fits were varied;

– for the additional D + signal: the range used for the background normalisation was varied or the fit was used instead of the subtraction procedure;

– for the D + , D s + and Λ + c signals: the background parametrisations, ranges used for the signal fits and amounts of the mutual reflections were varied. In addition, in the D s + signal-extraction procedure, the constraint used for the D + → KKπ signal width was varied. In the Λ + c signal extraction procedure, an uncertainty in the dE/dx simulation was estimated by changing the dE/dx cut values in the MC and checking the effects with respect to changes expected from the χ 2 1 distribution.

• { δ 6 } the uncertainties of the luminosities of the e p ( ± 1.8%) and e + p ( ± 2.25%) data samples were included taking into account their correlations;

• { δ 7 } the uncertainty in the rate of the charm-strange baryons (see Section 7.5).

Contributions from the different systematic uncertainties were calculated and added in

quadrature separately for positive and negative variations. The total and δ 1 -δ 7 systematic

uncertainties for the charm-hadron cross sections and charm fragmentation ratios and

fractions are summarised in Table 6. Correlated systematic uncertainties largely cancelled

in the calculation of the fragmentation ratios and fractions.

Abbildung

Table 1: The ratio of neutral to charged D-meson production rates, R u/d .
Table 5: The estimates of extrapolation factors which correct charm fragmentation ratios and fractions measured in the accepted p T (D, Λ c ) and η(D, Λ c ) region to the full phase space
Table 6: The total and δ 1 -δ 7 (see text) systematic uncertainties for the charm hadron cross sections and charm fragmentation ratios and fractions.
Figure 1: The M(Kπ) distributions (dots) for (a) the D 0 / D ¯ 0 candidates without
+5

Referenzen

ÄHNLICHE DOKUMENTE

2 
 This,
 as
 Keynes
 has
 noted,
 was
 clearly
 perceived
 300
 years
 ago
 by
 Bernard
 Mandeville
 in
 his
 1714
 Fable
 of
 the
 Bees.


In order to determine the validity range of an uncorrelated hadron resonance gas model description of the open charm sector of QCD, without using details of the open charm

Although the quark masses are not tuned to the physical values matching K mesons, and the results correspond to decays of D s to pseudoscalar strange mesons, we attempt to compare

A 2011 Chinese white paper on foreign aid – groundbreaking in its own way for publicly discussing Chinese ODA policies and data – states that the purpose of China’s foreign aid is

We can use the molar volume to calculate substance amounts and volumes of gaseous reactants and products3. Calculate the volume of chlorine gas that reacts with 15 g

Floor / Newdecò Palladian Light 9090 Wall / Newdecò

A covariant generalization of the one- dimensional cascade model for quark fragmentation functions is presented, so as to include the transverse momentum behaviour

The results presented provide a more stringent test of QCD predictions compared to [ 1 ] because the transverse momentum distribution is sampled in finer bins - with smaller