ATLAS-CONF-2014-027 20May2014
ATLAS NOTE
ATLAS-CONF-2014-027
May 19, 2014
Measurement of flow harmonics with multi-particle cumulants in Pb+Pb collisions at √
s NN = 2.76 TeV with the ATLAS detector
The ATLAS Collaboration
Abstract
ATLAS measurements of the azimuthal anisotropy in lead-lead collisions at
√ sNN =2.76 TeV are shown using a dataset of approximately 7
µb−1collected in 2010. The mea- surements are performed for charged particles with transverse momenta 0.5
<pT<20 GeV and in the pseudorapidity range
|η|<2.5. The anisotropy is characterized by the Fourier co- efficients, v
n, of the charged particle azimuthal angle distribution for
n=2
−4. The Fourier coefficients have been evaluated using multi-particle cumulants calculated with the gener- ating function method. Results on the transverse momentum, pseudorapidity and centrality dependence of the v
ncoefficients are presented. The elliptic flow (v
2) is obtained from the two-, four-, six- and eight-particle cumulants while higher-order coefficients, v
3and v
4are determined with two- and four-particle cumulants. Flow harmonics v
nmeasured with four-particle cumulants are significantly reduced compared to the measurement involving two-particle cumulants. A comparison to v
nmeasurements obtained using different analy- sis methods and previously reported from the LHC experiments is also shown. Results of measurements of flow fluctuations evaluated with multi-particle cumulants are shown as a function of transverse momentum and the collision centrality.
c Copyright 2014 CERN for the benefit of the ATLAS Collaboration.
Reproduction of this article or parts of it is allowed as specified in the CC-BY-3.0 license.
1 Introduction
The anisotropy of charged particle azimuthal angle distributions in heavy-ion collisions has been a sub- ject of extensive experimental studies at RHIC [1–6] and more recently at the LHC [7–21]. The results provide conclusive evidence that the hot and dense matter produced in these collisions behaves collec- tively and has properties resembling that of a nearly perfect fluid [22].
The final-state anisotropy is a global property of particle production that arises from the initial spa- tial asymmetry of the collision region in a plane transverse to the beam axis for non-central heavy-ion collisions. It is characterised by the coefficients, v
n, of the Fourier expansion of the measured azimuthal angle distributions [1, 23]:
v
n≡ hein(φ−Ψn)i=hcos[n(φ−Ψn)]i,(1) where
φis the azimuthal angle of the outgoing particle,
Ψndefines the azimuthal angle of the
n-ordersymmetry plane of the initial geometry [14], the angled brackets denote an average over charged particles in an event, and
nis the order of the flow harmonic. Due to the symmetry in the azimuth of the plane defined by
Ψn, all sine terms of the Fourier expansion vanish. For evaluation of the coefficients v
nin the
“event plane” method, the initial plane of symmetry is estimated from the measured correlations between particles, using the so-called sub-event method [23]. As a consequence, only the two-particle correlations are exploited in the determination of v
n(see Eq. 1). This leads to a well-known problem of disentangling all-particle flow and contributions from particle correlations unrelated to the initial geometry, known as non-flow correlations. These non-flow effects include correlations due to energy and momentum con- servation, resonance decays, quantum interference phenomena and jet production. In order to suppress non-flow correlations, methods that use genuine multi-particle correlations, defined as cumulants, have been proposed [24–27]. The cumulant approach to measure flow harmonics also provides a possibility to study event-to-event fluctuations in the amplitudes of different harmonics which can be related to the fluctuations in the initial geometry of the interaction region [28–30].
The cumulant method has been used to measure the anisotropic flow in NA49 [31], STAR [32] and recently also at the LHC experiments [7, 9, 17, 20]. The results have shown that the Fourier coefficients determined with four-particle cumulants are reduced as compared to those derived with two-particle cumulants due to the suppression in the former of non-flow two-particle correlations. In this note, the method is used to measure flow harmonics in lead-lead collisions at
√sNN=
2.76 TeV with the ATLAS detector. The elliptic flow v
2is measured using two-, four-, six- and eight-particle cumulants. For v
3and v
4measurements the two- and four-particle cumulants are exploited.
Calculating multi-particle correlations in large-multiplicity heavy-ion collisions at high energies is limited by the computing requirements needed to perform nested loops over thousand of particles per event to analyse all particle multiplets. To avoid this problem, the generating function formalism [24–
26] has been exploited, and the results obtained are presented in this note. An alternative approach has also been proposed in Ref. [27] to express multi-particle correlations in terms of the moments of the flow vector,
Qn, and is used in this note as a cross-check of multi-particle cumulants obtained with the generating function method.
This note is organised as follows. Section 2 describes the ATLAS detector, trigger, and offline event
selections and Section 3 contains the description of additional selection criteria for events and charged
particle tracks. Section 4 gives details of the simulated Monte Carlo samples used to derive the tracking
efficiency and fake rates. The analysis method and procedure is outlined in Section 5. Section 6 contains
the discussion of systematic errors. Results are presented in Section 7. Section 8 is devoted to a summary
and conclusions.
2 The ATLAS detector and trigger
The results presented in this note were obtained from a sample of minimum-bias lead-lead collisions at
√sNN =
2.76 TeV recorded by ATLAS in 2010 and corresponding to an integrated luminosity of approximately 7
µb−1. The measurements were performed using the ATLAS inner detector, forward calorimeters, trigger and data acquisition systems [33]. The inner detector has a complete azimuthal coverage and extends over the pseudorapidity region
|η|<2.5
1. The inner detector silicon tracker, used in this analysis for track reconstruction, consists of layers of pixel and microstrip detectors (SCT) immersed in a 2 T axial magnetic field. The forward calorimeters (FCal) provide both electromagnetic and hadronic energy measurements with copper-tungsten/liquid argon technology, and also feature a complete coverage in azimuth for 3.2
<|η|<4.9. A Level 1 trigger system was used to record minimum bias lead-lead collisions. It required a coincidence of signals recorded in both zero-degree calorimeters (ZDC), located symmetrically at
z=±140 m, and in the minimum-bias trigger scintillator counters (MBTS) at
z=±3.6 m.3 Event and track selections
Additional off-line event selections were also applied, requiring a time difference between the two MBTS counters of less than 3 ns and a primary vertex reconstructed from charged particle tracks with transverse momentum
pT>0.5 GeV. Events satisfying the above-described selections were also required to have a reconstructed primary vertex within 100 mm of the nominal center of the ATLAS detector.
The precision silicon tracking detectors were used to reconstruct charged particle trajectories with a minimum
pTof 0.5 GeV. Special track quality criteria are imposed to deal with high particle densities in Pb+Pb collisions. Tracks are required to have at least eight hits in the SCT, at least two pixel hits and a hit in the pixel layer closest to the interaction point if expected. A track must have no missing pixel hits and no missing SCT hits, when a hit is expected. The transverse and longitudinal impact parameters with respect to the vertex (
|d0|and
|z0sinθ
|, respectively) were each required to be less than 1 mm.
Specifically, for this analysis it was also required that
|d0/σd0|<3 and
|z0sin
θ/σz|<3, where
σd0and
σzare the uncertainties on the transverse and longitudinal impact parameters, respectively, as obtained from the covariance matrix of the track fit. The latter requirements improve both the tracking performance at high
pTand the purity of the track sample. The number of reconstructed tracks per event is denoted
Nchrec. For this analysis, the additional requirement of
Nchrec≥10 for tracks with 0.5
<pT<5 GeV was imposed to allow the measurement of correlations involving as many as eight particles.
The correlation between the summed transverse energy (ΣE
TFCal) measured in the ATLAS forward calorimeters and the number of reconstructed charged particles (N
chrec) was investigated in order to identify background events. Events having a
Nchrecvs.
ΣETFCalcorrelation distinctly different from that for the majority of Pb+Pb collisions were removed. The removed events, less than 0.01% of the sample, were found to contain multiple Pb+Pb collisions. After applying all selection requirements, the data sample consists of about 35 million minimum bias Pb+Pb collision events.
The summed transverse energy is used to define the centrality of the collision. A detailed analysis of the
ΣETFCaldistribution [14] showed that the fraction of the total inelastic cross-section sampled by the trigger and event selection requirements is 98
±2%. The
ΣETFCaldistribution was divided into centrality intervals, each representing a percentile fraction of all events after accounting for the 2% inefficiency in recording the most peripheral collisions. The analysis is performed in fine centrality intervals: 1%
1ATLAS uses a right-handed coordinate system with its origin at the nominal interaction point (IP) in the centre of the detector and thez-axis along the beam pipe. Thex-axis points from the IP to the centre of the LHC ring, and they-axis points upward. Cylindrical coordinates(r,φ)are used in the transverse plane,φbeing the azimuthal angle around the beam pipe. The pseudorapidity is defined in terms of the polar angleθasη=−ln tan(θ/2).
centrality bins for the 20% of events with the largest
ΣETFCal, and 5% centrality bins for the remaining events. These fine centrality intervals are then combined into wider bins to ensure sufficiently small sta- tistical uncertainties on the measured flow harmonics. The 20% of events with the smallest
ΣETFCal(most peripheral collisions) are not considered in this analysis, due to the inefficiency in the event triggering and the correspondingly large uncertainties of measurements performed for these low-multiplicity colli- sions. For each centrality interval, a standard Glauber Monte Carlo model [34, 35] is used to estimate the average number of participating nucleons,
hNparti, which provides an alternate measure of the collisioncentrality.
4 Monte Carlo simulations
A Monte Carlo (MC) sample was used in the analysis to determine tracking efficiencies and rates of fake tracks. The HIJING event generator [36] was used to produce minimum-bias Pb+Pb collisions.
Events were generated with the default parameters, except for the jet quenching which was turned off.
Flow harmonics were introduced into HIJING at the generator level by changing the azimuthal angle of each particle [1] in order to produce an anisotropic azimuthal angle distribution consistent with previous ATLAS v
n, n=2
−6 measurements [14, 15]. The detector response was simulated using the GEANT4 package [37] with data-taking conditions corresponding to those of the 2010 Pb+Pb run and simulated events are reconstructed in the same way as the data.
The tracking efficiency,
ε(pT,η)and fake rate corrections
f(pT,η)are determined using the Monte Carlo sample described above [38]. The MC reproduces the measured centrality dependence of the track quality parameters. The efficiency is found to depend weakly on the collision centrality. For the lowest transverse momenta (0.5–0.6 GeV), the efficiency at
|η|<1 is of the order of 50% and falls to about 30% at high
|η|. For higher transverse momenta it reaches about 70% at|η|<1 and drops to about 50%
at high
|η|. The fake rate is typically below 1%; it increases up to few percent for the lowest transversemomenta in the most central collisions.
5 Analysis procedure
Fourier coefficients, v
n, are measured using 2k-particle correlations [24–26] defined as:
hcorrn{2k}i = hhein(φ1+...+φk−φ1+k−...−φ2k)ii
= hvn{2k}2ki,
(2)
where the notation v
n{2k}is used for the v
nflow harmonic derived from the 2k-particle correlations,
and
kis an integer. Azimuthal angles of particles forming a 2k-particle cluster are denoted by
φl, where
l=1, . . . ,2k. The double angled brackets denote an average, first over charged particles in an event,
and then over events, while the single angled brackets denote averaging over events. The multi-particle
correlation,
hcorrn{2k}i, includes contributions from the collective anisotropic flow and from non-floweffects. The latter contribution, not related to the initial geometry, can result from processes such as reso-
nance decays, jet production, quantum interference or energy-momentum conservation. It was proposed
in Refs. [24–26] to exploit the cumulant expansion of multi-particle correlations in order to reduce the
non-flow contribution. The anisotropic flow related to the initial geometry is a global, collective effect
involving correlations between all outgoing particles. Thus, in the absence of non-flow effects, v
n{2k}is
expected to be independent of
k. On the other hand, most of the non-flow correlations, such as resonancedecays or interference effects, contribute only to correlations between small numbers of particles. The
idea of using 2k-particle cumulants is to suppress the non-flow contribution by eliminating the correla-
tions which act between fewer than 2k particles. More specifically, the cumulant of e.g. the four-particle
correlations, defined as:
cn{4}=hcorrn{4}i −
2hcorr
n{2}i2,(3) measures the genuine four-particle correlations. So, if the non-flow contribution is only due to the two- particle correlations, then
cn{4
}directly measures flow harmonics. Similarly, using the cumulant of the six-particle correlations allows one to remove contributions from two- and four-particle correlations. The different cumulants provide independent estimates of the same flow harmonic v
n, with the estimate based on correlations among many particles being more precise due to the suppressed non-flow correlations. In the absence of non-flow correlations, cumulants of different order should give the same estimate of v
n.
The generating function formalism (GFC method) was proposed in [26]. With this method, the number of required computing operations is proportional to the number of particles per event. The cumulant generating function of multi-particle azimuthal correlations,
Cn(z), is defined in the plane of acomplex variable
zas [24–26]:
Cn(z) =
<N>
* N
∏
j=1
1
+wj(zeinφj+z∗e−inφj) N+1/<N>
−
1
,
(4) where the angled brackets represent the average over events in a given centrality interval, and the prod- uct runs over the
Nparticles within a given Pb+Pb event. The weighting factors,
wj, are optional and may depend on particle transverse momentum, pseudorapidity and azimuthal angle. In this analysis, the weights
wj(η,φ)are used to correct for any non-uniformity in the azimuthal angle distribution of reconstructed tracks. The weights are obtained from the data using the two-dimensional
η−φdistri- bution of all reconstructed tracks. For each,
(δ η,δ φ) = (0.1,2π/64) bin
j, a weight is calculated as wj=hN(δ η)i/N(δ η,δ φ), wherehN(δ η)iis the average number of tracks in the
δ ηslice to which this bin belongs, while
N(δ η,δ φ)is the number of tracks in the
(δ η,δ φ)bin.
The expansion of the cumulant generating function in powers of
|z|provides the cumulant
cn{2k}which is equal to the coefficient of the term
|z|2k/k!2of this expansion. In practice, to construct the
cn{2k}cumulant the power series is truncated to order
|z|2kand
Cn(z)is computed at a discrete set of interpolating points
zp,q=xp,q+iyp,q[26], where:
xp,q=r0√ p·
cos
2qπ
qmax
, yp,q=r0√ p·
sin
2qπ
qmax
.
(5)
For this analysis, the parameters
p=1, ..., 5 and
q=0, ...,
qmax−1 with
qmax=11 were chosen as recommended in Ref. [26]. The
r0parameter (r
0≡ |z|/√p) should be as small as possible, chosen such
that the results remain stable under its variation. The
r0values used were chosen to be 4.0, 2.2, 1.6, 1.1 and 1.0 for centrality intervals 0–5%, 5–10%, 10–20%, 20–30% and 30–80%, respectively. For these values, the results are found to be stable when varying
r0between
r0/2 and 2r0. The only differences, up to about 2%, were seen when using the eight-particle cumulants to calculate the elliptic flow harmonic and are accounted for in the systematic uncertainty on v
2{8}.An alternative method, referred to as the QC method, was proposed in Ref. [27] to calculate multi- particle correlations and cumulants in a single pass over all particles in each event. In this method, the expressions for the multi-particle correlations are derived in terms of the moments of the flow vector
Qn, defined as
Qn=∑Nj=1wjeinφj, where the index
ndenotes the order of the flow harmonic and the sum runs over all particles in an event. The QC method is used to calculate the cumulants,
cn{2k} , which are compared with the cumulants obtained from the GFC method.
A practical application of the cumulant method involves two main steps [24–26]. First, the reference
2k-particle cumulants,
cn{2k} , are derived from the cumulant generating function calculated from parti-
cles measured over a broad range of transverse momentum and pseudorapidity. This step is equivalent
Centrality percentile 0-20% 20-40% 40-60% 60-80%
{2}2c
0 0.01 0.02
ATLAS Preliminary
= 2.76 TeV sNN
Pb+Pb
b-1
µ
≈ 7 Lint
< 5 GeV
| < 2.5 0.5 < pT
η
|
2
cGFC 2
cQC
Centrality percentile 0-20% 20-40% 40-60% 60-80%
{4}2c
-0.2 -0.1 0
10-3
×
Centrality percentile 0-20% 20-40% 40-60% 60-80%
{6}2c
0 5 10
10-6
×
Centrality percentile 0-20% 20-40% 40-60% 60-80%
{8}2c
-1 -0.5
0 10-6
×
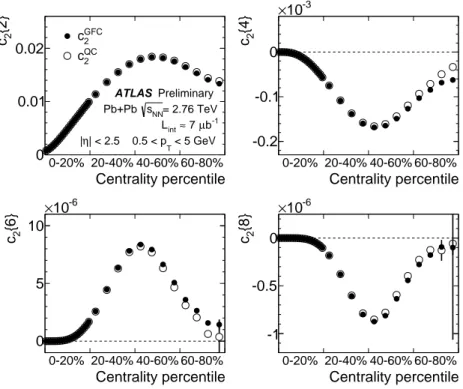
Fig. 1: Multi-particle cumulants for the second order flow harmonic,
hc2{2k}ifor
k=1,2,3,4, obtained with the GFC and QC methods shown as a function of centrality. The horizontal axis ranges from central collisions (0–20%) to more peripheral collisions (60–80%).
to the event plane estimate in the standard method (see Eq. 1) and the reference cumulants play a similar role to the event plane resolution correction [23]. In the next step, the differential flow is calculated in
pTand
ηbins using cumulants, denoted
dn{2k}, computed from a differential generating function. Todetermine the
dn{2k}cumulants, each charged particle from a
pTand
ηbin is correlated with 2k
−1 reference particles. The differential flow harmonics v
n{2k}(pT,η), are then calculated with respect tothe reference cumulants as prescribed in Refs. [25, 26]:
v
n{2}(pT,η) = dn{2}pcn{2},
(6) v
n{4}(pT,η) = −dn{4}3/4p
−cn{
4
},(7)
v
n{6}(pT,η) = dn{6}5/6p
cn{6}/4,
(8)
v
n{8}(pT,η) = −dn{8}7/8p
−cn{8}/33.
(9)
In order to calculate the reference cumulants,
cn{2k}, all charged particles with pseudorapidities|η|<
2.5 and transverse momenta 0.5
<pT <5 GeV are used in this analysis. The results for
c2are
shown as a function of centrality in Fig. 1 for two-, four-, six- and eight-particle cumulants obtained
from the GFC and QC methods. The figure shows that the two methods yield consistent results over
a wide range of collision centralities. Differences, up to
∼20 %, are observed only for the most pe-
ripheral collisions. For the most central (0–2%) Pb+Pb collisions, the cumulants
cn{2k} for
k>1 have
incorrect signs, which prevents the calculation of flow harmonics due to the square-root function in the denominator of Eqs. 7, 8 and 9.
Centrality percentile
0-20% 20-40% 40-60% 60-80%
{2}3c
0 0.005 0.01
ATLAS Preliminary = 2.76 TeV sNN
Pb-Pb b-1
µ
≈ 7 Lint
< 5 GeV
| < 2.5, 0.5 < pT
η
|
3
cGFC
3
cQC
Centrality percentile
0-20% 20-40% 40-60%
{4}3c
-0.6 -0.4 -0.2 0
10-6
×
Centrality percentile
0-20% 20-40% 40-60% 60-80%
{2}4c
0 0.005
0.01 ATLAS Preliminary = 2.76 TeV sNN
Pb-Pb b-1
µ
≈ 7 Lint
< 5 GeV
| < 2.5, 0.5 < pT
η
|
4
cGFC
4
cQC
Centrality percentile
0-20% 20-40% 40-60%
{4} 4c
0 0.05 0.1
10-6
×
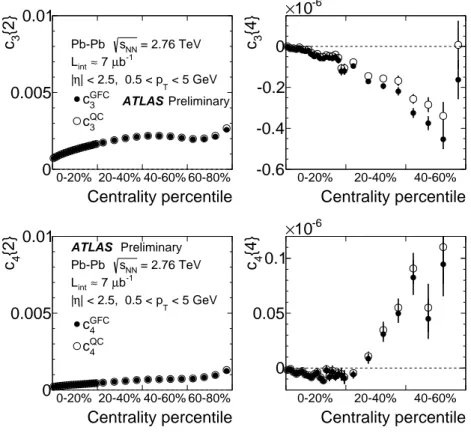
Fig. 2: Top: multi-particle cumulants for the third order flow harmonic,
hc3{2k}ifor
k=1,2 obtained with the GFC and QC methods shown as a function of centrality. Bottom: the same for the fourth order flow harmonics,
hc4{2k}i.
For higher flow harmonics, the cumulants
c3{2k}and
c4{2k}obtained from both the GFC and QC methods are consistent with zero for
k>2. Therefore, only two- and four-particle cumulants can be used to derive triangular and quadrangular flow coefficients. Figure 2 shows the centrality dependence of the two- and four-particle cumulants, obtained from the GFC and QC methods, for
n=3 and
n=4. The figure demonstrates an overall good agreement between the cumulants calculated using the two different methods. In the case of four-particle cumulants, the centrality range of the method applicability is limited to 0–60% for
n=3 and 0–25% for
n=4.
The differential flow harmonics, v
n{2k}(pT,η), are determined using the differential cumulants dn{2k}and Eqs. 6–9 in bins of transverse momentum and pseudorapidity for events from a given cen- trality interval. The pseudorapidity range
|η|<2.5 is divided into 50 bins of width 0.1 each. In trans- verse momentum, 28 bins of variable width, covering the
pTrange from 0.5 GeV to 20 GeV, are used.
These differential flow harmonics can then be integrated over wider phase-space bins or the full range
in either pseudorapidty or transverse momentum, or both. In this integration procedure, the harmonics
v
n{2k}(pT,η)measured in each small bin are weighted by the charged particle multiplicity in that bin,
corrected for tracking efficiency and fake rate, using the Monte Carlo-determined corrections,
ε(pT,η)and
f(pT,η)as described in Section 4.
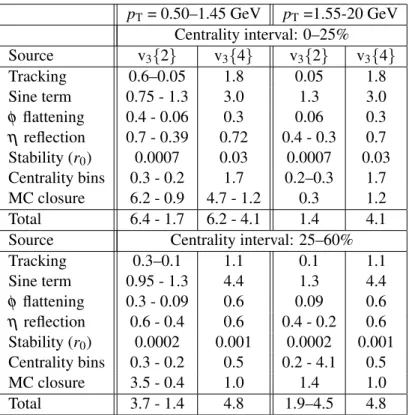
pT
= 0.50–1.45 GeV
pT=1.55-20 GeV Centrality interval: 15–20%
Source v
2{2
}v
2{4
}v
2{6
}v
2{8
}v
2{2
}v
2{4
}v
2{6
}v
2{8
}Tracking 0.6 –0.007 0.5–0.05 0.5–0.04 0.6–0.03 0.007 0.05 0.04 0.03
Sine term 0.02 0.1 0.05 0.05 0.02 0.1 0.05 0.05
φ
flattening 0.02 0.009 0.01 0.01 0.02 0.009 0.01 0.01
η
reflection 0.02 0.06 0.07 0.07 0.02 0.06 0.07 0.07
Stability (r
0)
<0.001 0.02 0.3 2.0
<0.001 0.02 0.3 2.0
Centrality bins 1.1 1.2 1.2 1.2 1.1 – 0.2 1.2 – 1.0 1.2 – 1.0 1.2 – 1.0
MC closure 5.5 – 0.3 5.7 – 0.2 5.5 – 0.2 5.5 – 0.2 0.3 0.2 0.2 0.2
Total 5.7 – 1.1 5.8 – 1.2 5.7 – 1.2 6.1 – 2.4 1.1 – 0.3 1.2 – 1 1.2 – 1.1 2.4
Source Centrality interval: 55–60%
Tracking 0.09–0.04 0.5 0.4 0.4 0.04 0.5 0.4 0.4
Sine term 0.03 0.4 0.9 0.9 0.03 0.4 0.9 0.9
φ
flattening 0.01 0.06 0.006 0.02 0.01 0.06 0.006 0.02
η
reflection 0.06 0.1 0.02 0.2 0.06 0.1 0.02 0.2
Stability (r
0) 0.001 0.007 0.1 1 0.001 0.007 0.1 1
Centrality bins 0.3 – 0.5 0.6 – 1.1 0.7 – 1.4 0.7 – 1.5 0.6 – 4.3 1.2 – 1.1 1.5 – 2.3 1.6 – 2.5
MC closure 0.02 2 2 2 0.02 2 2 2
Total 0.3 – 0.5 2.1 – 2.3 2.6 – 2.9 2.4 – 2.8 0.6 – 4.3 2.4 – 2.3 2.9 – 3.4 2.8 – 3.4 Table 1: Relative systematic uncertainties (|∆v
n|/vn, in % ) for v
2measured with two-, four-, six- and eight-particle cumulants for two
pTranges and two centrality intervals, 15–20% (top part) and 55–60%
(bottom part). A single entry is given where the uncertainty varies weakly over the selected
pTrange.
Otherwise the range in uncertainties is provided corresponding to the range in
pT.
6 Systematic uncertainties and cross-checks
6.1 Systematic uncertainties
The systematic uncertainties on the measurements presented in this note are evaluated by varying differ- ent aspects of the analysis and comparing the results obtained to the baseline results. An overall scale uncertainty (referred to as “Centrality bins”) on flow harmonics comes from the uncertainty in the frac- tion of the total inelastic cross-section accepted by the trigger and the event selection criteria. By varying the centrality bin definitions, accounting for the 2% uncertainty in the sampled fraction of the cross- section, it is found that a scale uncertainty of about 2% should be included in the systematic uncertainty on the
pT-integrated v
2. For the
pTdependence of v
2a larger scale uncertainty, up to 10% at high
pTin peripheral collisions, is added, which is due to a strong dependence of v
2on centrality in this
pTregion.
For v
3and v
4the contribution due to the centrality definition stays below 2%.
All formulas applied in the analysis are valid under the assumption that the sine terms in the Fourier
expansion vanish due to the azimuthal symmetry of the initial geometry. However, due to some distor-
tions in the detector acceptance and non-uniformities in the measured azimuthal angle distributions, a
residual sine term may be present. The magnitude of the sine term is calculated as the imaginary part
of the differential generating function. The deviation from zero of the average sine term with respect
to
hvniis treated as the systematic uncertainty (“Sine term”) and is studied as a function of transverse
momentum, pseudorapidity and collision centrality for v
2, v
3and v
4. In the case of v
2calculated with
six- and eight-particle cumulants, we observe deviations up to 5% for the
pT-dependent measurement
and up to 10% at high
ηin the 2–5% most central collisions only. In other centrality intervals the
contribution to the systematic uncertainty is below 1%. Similarly, for v
2integrated over
pTand
η, therelative magnitude of the sine term is negligibly small for all centrality intervals, except the most central collisions, where deviations of up to 10% are observed for v
2{6
}and v
2{8
}. For
pT- and
η-dependentmeasurements of v
3, deviations up to 5% are observed and are included in the systematic uncertainties.
In the case of v
4{4}even larger deviations are observed (up to 15%), but these are consistent with zero within statistical errors. Contributions to the systematic uncertainty due to the non-zero sine term of the order of 15% are estimated for the
pT- and
η-integrated v3and v
4.
A further contribution to the systematic uncertainty was evaluated as the difference between the flow harmonics measured at positive and negative pseudorapidities (“η reflection”). Relative differences below 1% (5%) for the v
2(v
3and v
4) measurements integrated over
pTare seen, while for differential flow measurements they are consistent within statistical uncertainties.
A small contribution to the systematic uncertainty, only for v
2{8}, comes from the stability of theresults with respect to the assumed value of the
r0parameter, “Stability (r
0)” (see discussion in the previous Section).
The correction applied to ensure the uniformity of the azimuthal angle distribution of reconstructed tracks (via weights
wj) is also checked by comparing the baseline results to those obtained with
wj≡1.
This change gives small contributions (“φ flattening”), of the order of 1%.
The contribution to the systematic uncertainty related to the track quality definition (“Tracking”) is evaluated by comparing results obtained with more or less restrictive requirements. Both the transverse and longitudinal impact parameter cuts,
|d0|and
|z0sin
θ|, are changed by±0.5 mm with respect to thenominal value of 1 mm and the significance cuts,
|d0/σd0|<3 and
|z0sin
θ/σz|<3, are changed by
±1.The relative differences between the different track selection cuts are found to be below 1% for v
2and below 2% for higher order flow harmonics.
The analysis procedure is also checked through MC studies by comparing the observables at the generator/particle level with those obtained in the MC simulated sample for which the same analysis chain and correction procedure is used as for the data (“MC closure”). The measured flow harmonics in data agree qualitatively with the reconstructed MC harmonics and show similar trends as a function of
η. In the phase space regions where tracking performance suffers from low efficiency and high fakerates (low
pTand high
η), we observe systematic differences between the flow harmonics calculated atthe generator level and at the reconstruction level after the corrections. In general, in this phase space region, the reconstructed flow harmonics are smaller than the truth ones and show an
ηdependence, not present at the generator level. To account for this
η-dependent bias, the MC closure is considered aspart of the systematic uncertainty. In most cases relative differences below 5% are observed between the truth and reconstructed harmonics, except in the region of very low transverse momenta (below 1 GeV) and/or high
η(|η|
>1.5) where differences up to 6% (15 %) are observed for v
2and v
3(v
4).
The total systematic uncertainty is calculated as the sum of all individual contributions added in
quadrature. For illustration, Table 1 shows the systematic uncertainties on v
2split into the different
contributions for two representative centrality intervals, 15–20% and 55–60%, and two ranges in
pT.
For higher order flow harmonics, the systematic uncertainties are listed in Tables 2 and 3 for v
3and v
4,
respectively. The largest contributions to the systematic uncertainty on higher order flow harmonics are
due to the sine term and MC closure. However, the measurements of v
3and v
4are dominated by large
statistical errors.
pT
= 0.50–1.45 GeV
pT=1.55-20 GeV Centrality interval: 0–25%
Source v
3{2}v
3{4}v
3{2}v
3{4}Tracking 0.6–0.05 1.8 0.05 1.8
Sine term 0.75 - 1.3 3.0 1.3 3.0
φ
flattening 0.4 - 0.06 0.3 0.06 0.3
η
reflection 0.7 - 0.39 0.72 0.4 - 0.3 0.7 Stability (r
0) 0.0007 0.03 0.0007 0.03 Centrality bins 0.3 - 0.2 1.7 0.2–0.3 1.7 MC closure 6.2 - 0.9 4.7 - 1.2 0.3 1.2
Total 6.4 - 1.7 6.2 - 4.1 1.4 4.1
Source Centrality interval: 25–60%
Tracking 0.3–0.1 1.1 0.1 1.1
Sine term 0.95 - 1.3 4.4 1.3 4.4
φ
flattening 0.3 - 0.09 0.6 0.09 0.6
η
reflection 0.6 - 0.4 0.6 0.4 - 0.2 0.6 Stability (r
0) 0.0002 0.001 0.0002 0.001 Centrality bins 0.3 - 0.2 0.5 0.2 - 4.1 0.5
MC closure 3.5 - 0.4 1.0 1.4 1.0
Total 3.7 - 1.4 4.8 1.9–4.5 4.8
Table 2: Relative systematic uncertainties (|∆v
n|/vn, in % ) for v
3measured with two- and four-particle cumulants for two
pTranges and two centrality intervals, 0–25% (top part) and 25–60% (bottom part).
A single entry is given where the uncertainty varies weakly over the selected
pTrange. Otherwise the range in uncertainties is provided corresponding to the range in
pT.
Centrality interval: 0–25%
pT
= 0.50–1.45 GeV
pT=1.55-20 GeV Source v
4{2}v
4{4}v
4{2}v
4{4}Tracking 0.5 - 0.07 2.3 0.07 2.3
Sine term 1 - 0.6 15 0.6 - 0.2 15
φ
flattening 2.8 - 0.5 1.5 0.5 - 0.3 1.5
η
reflection 2.3 - 0.5 2.3 0.5 2.3
Stability (r
0) 0.0002 0.03 0.0002 0.03 Centrality bins 0.3 0.6 0.3 - 0.1 0.6
MC closure 13 - 0.7 4 0.7 4
Total 14 - 1.3 16 1.2 - 1.0 16
Table 3: Relative systematic uncertainties (|∆v
n|/vn, in % ) for v
4measured with two- and four-particle
cumulants for two
pTranges and the centrality interval 0–25%. A single entry is given where the un-
certainty varies weakly over the selected
pTrange. Otherwise the range in uncertainties is provided
corresponding to the range in
pT.
6.2 Cross checks
In addition to the evaluation of the systematic uncertainty, further cross checks have been also performed.
The comparison between cumulants calculated with the GFC and QC methods is discussed in detail in Section 5. The analysis is performed separately for negatively and positively charged particles and the resulting v
ncoefficients are found to be consistent within their statistical and systematic uncertainties.
Furthermore, the consistency of v
2{2k} for
k>1 measured for same-sign particles and all combinations of charged particles confirms the global collective feature of the measured effect. Consistency is also observed between measurements obtained from sub-samples collected early and late during the data taking period. We have also evaluated the potential bias which may be due to the large spread in charged particle multiplicities in centrality intervals defined by
ΣETFCal. For this purpose, in a given centrality bin selected by
ΣETFCal, the analysis is restricted to events with multiplicities limited to the very narrow range (corresponding to
±RMS/2 around the mean multiplicity) and compared to the analysis performed for the full range of multiplicities. Both give v
nharmonics consistent within their statistical and systematic uncertainties.
7 Results
7.1 Transverse momentum dependence of flow harmonics
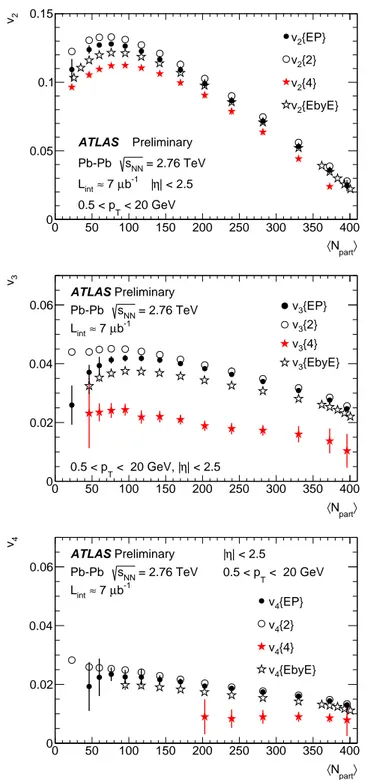
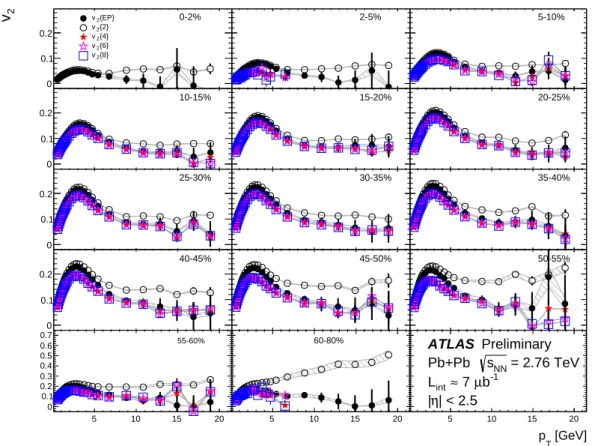
The transverse momentum dependence of v
2{2}, v2{4}, v2{6}and v
2{8}is shown in Fig. 3 in 14 centrality intervals as indicated in the plots. The v
2coefficients are integrated over the full pseudorapidity range
|η|<2.5. The elliptic flow measurements, v
2{EP}, obtained with the event plane method [23]are also shown. For this comparison, the measurements from Ref. [14] were reanalyzed with the same track quality requirements and centrality intervals as for the present analysis. The event plane v
2is systematically smaller than v
2{2
}since it is less affected by short-range two-particle correlations, which are partially removed from v
2{EP}due to the separation between the phase space region where the event plane angle is determined (3.2
<|η|<4.9) and the phase space where charged particle momenta are reconstructed (
|η|<2.5). This effect is particularly pronounced at high transverse momenta, where v
2{2}is strongly influenced by jet-related correlations. The difference between v
2{EP}and v
2{4}is predominantly due to flow fluctuations. The v
2{2k}for
k >1 is systematically smaller than v
2{2},consistent with the expected suppression of non-flow effects in v
2obtained with cumulants of more than two particles. The results for v
2{2k}with
k>1 agree with each other, within the uncertainties, for all centrality intervals, indicating that even the four-particle cumulants efficiently suppress non-flow correlations. As a function of transverse momentum, the second flow harmonic first increases with
pTup to
pT≈2
−3 GeV, then weakly decreases for
pTvalues up to about 6 GeV. This trend is consistent with hydrodynamic predictions for a collective expansion of the created system [39, 40]. Beyond
pTof about 10 GeV, a much weaker v
2dependence on
pTis observed. Interestingly the coefficients v
2{4
}remain significant at high transverse momenta, up to about 20 GeV, over a broad centrality range. v
2{4}is consistent with zero within the uncertainty of our measurements only for the most peripheral collisions (60–80%) and the 5% most central collisions. These large values of v
2{4
}at high transverse momenta may reflect both the anisotropy of the initial geometry and the path-length dependence of the parton energy loss in the dense strongly-interacting medium [41].
Figure 4 shows the comparison of our results for v
2{4}integrated over
|η|<0.8 as a function of
pT, to these coefficients measured by the CMS [17] and ALICE [9] experiments in several centrality intervals. The results on the elliptic flow harmonic measured with four-particle cumulants are consistent for the three experiments.
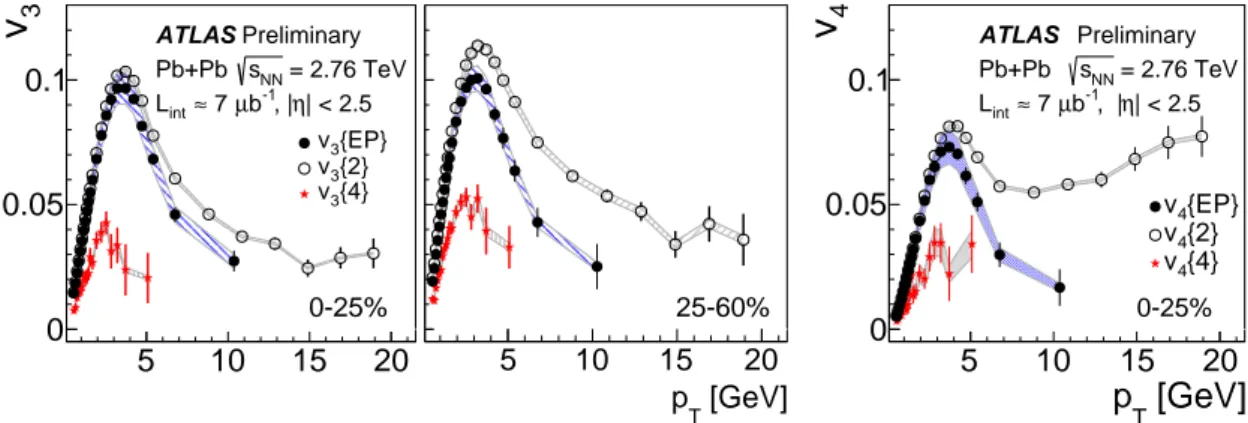
The transverse momentum dependence of the higher order harmonics, v
3and v
4, is shown in Fig. 5
and compared to the results obtained with the event plane method. Due to the large uncertainties on
[GeV]
T
5 10 15 p 20
2v
0 0.1 0.2
2{EP}
v 2{2}
v 2{4}
v 2{6}
v 2{8}
v
0-2%
[GeV]
T
5 10 15 p 20
2v
0 0.1 0.2
2-5%
[GeV]
T
5 10 15 p 20
2v
0 0.1 0.2
5-10%
5 10 15 20
0 0.1 0.2
10-15%
[GeV]
pT
5 10 15 20
2v
0 0.1 0.2
15-20%
[GeV]
pT
5 10 15 20
2v
0 0.1 0.2
20-25%
5 10 15 20
0 0.1 0.2
25-30%
[GeV]
T p
5 10 15 20
2v
0 0.1 0.2
30-35%
[GeV]
T p
5 10 15 20
2v
0 0.1 0.2
35-40%
5 10 15 20
0 0.1 0.2
40-45%
[GeV]
T
5 10 15 p 20
2v
0 0.1 0.2
45-50%
[GeV]
T
5 10 15 p 20
2v
0 0.1 0.2
50-55%
5 10 15 20
0 0.1 0.2 0.3 0.4 0.5 0.6
0.7 55-60%
5 10 15 20
0 0.1 0.2 0.3 0.4 0.5 0.6
0.7 60-80%
[GeV]
pT
5 10 15 20
0 0.1 0.2 0.3 0.4 0.5 0.6
0.7 ATLAS Preliminary = 2.76 TeV sNN
Pb+Pb b-1
µ
≈ 7 Lint
| < 2.5 η
|
Fig. 3: The second flow harmonic calculated with the two-, four-, six-, and eight-particle cumulants as a function of transverse momentum in different centrality intervals, measured over the full pseudorapidity range,
|η|<2.5. Note that for the most central collisions (0–2% centrality class) the results are available only for v
2{2}. For comparison the v2{EP}measurements obtained with the event plane method are also shown. Statistical errors are shown as bars and systematic uncertainties as bands.
the harmonics measured with four-particle cumulants, especially for events with low multiplicities, the results are shown in wide centrality ranges: for v
3in the two broad centrality intervals, 0–25% and 25- 60%, and for v
4in the full accessible centrality range, 0–25%. In addition, the results for v
n{4}are shown in fine
pTbins at low transverse momenta, up to 5 GeV, while the last
pTpoint covers the range from 5 GeV to 20 GeV. Similarly to v
2we observe a reduction of short-range jet-like correlations in v
3,4{EP}as compared to v
3,4{2}. Significantly non-zero values of the third and fourth flow harmonicscalculated with four-particle cumulants are observed with a
pTdependence similar to that of v
2. The v
n{4}harmonic is systematically smaller than v
n{2}, consistent with the suppressed non-flow effects inflow harmonics obtained with cumulants of more than two particles. It has to be noted that the difference between v
3{4}(v
4{4}) and v3{EP}(v
4{EP}), which amounts to a factor of about two, is much largerthan the difference between v
2{4}and v
2{EP}, which is of the order of 30 %. This indicates thatfluctuations of higher order flow harmonics are much stronger than fluctuations of v
2.
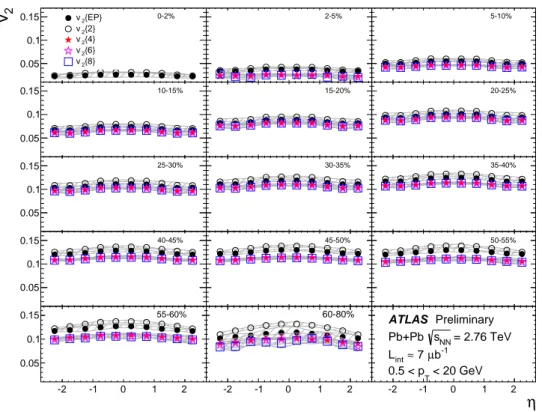
7.2 Pseudorapidity dependence
The pseudorapidity dependence of v
n{2k}is studied as a function of centrality for flow coefficients
integrated over the
pTrange from 0.5 GeV to 20 GeV. Figure 6 shows v
2{2}, v2{4}, v2{6}, v2{8}and
v
2{EP}as a function of
ηin 15 centrality intervals as indicated in the plots. Similar observations to
0 5 10 15 20
2
v
0 0.1
0.2 ATLAS Preliminary = 2.76 TeV sNN
Pb-Pb b-1
µ
≈ 7 Lint
| < 0.8 η
|
5-10%
0 5 10 15 20
0 0.1
0.2 v2{4} ATLAS CMS
2{4}
v 15-20%
0 5 10 15 20
0 0.1
0.2 25-30%
0 5 10 15 20
0 0.1
0.2 35-40%
[GeV]
pT
0 5 10 15 20
0 0.1
0.2 40-50%
0 5 10 15 20
2
v
0 0.1
0.2 ATLAS Preliminary = 2.76 TeV sNN
Pb-Pb b-1
µ
≈ 7 Lint
| < 0.8 η
|
5-10%
0 5 10 15 20
0 0.1
0.2 v2{4} ATLAS ALICE
2{4}
v 10-20%
0 5 10 15 20
0 0.1 0.2
20-30%
0 5 10 15 20
0 0.1 0.2
30-40%
[GeV]
pT
0 5 10 15 20
0 0.1 0.2
40-50%
Fig. 4: Comparison of the ATLAS and CMS [17] (top panel), and ATLAS and ALICE [9] (bottom panel) measurements of v
2{4}for selected centrality intervals at
|η|<0.8. The error bars denote statistical and systematic uncertainties added in quadrature.
5 10 15 20
3
v
0 0.05 0.1
3{EP}
v
3{2}
v
3{4}
v ATLAS Preliminary
= 2.76 TeV sNN
Pb+Pb
| < 2.5 η
-1, | µb
≈ 7 Lint
0-25%
[GeV]
pT
5 10 15 20
0 0.05 0.1
25-60%
[GeV]
p
T5 10 15 20
4
v
0 0.05 0.1
4{EP}
v
4{2}
v
4{4}
v ATLAS Preliminary
= 2.76 TeV sNN
Pb+Pb
| < 2.5 η
-1, | µb
≈ 7 Lint
0-25%
Fig. 5: The transverse momentum dependence of v
3calculated with two- and four-particle cumulants and with the event plane method v
3{EP}for the centrality interval 0–25% (left plot) and 25–60% (middle plot). The right plot shows the same results for v
4for the centrality interval 0–25%. Statistical errors are shown as bars and systematic uncertainties as bands. The highest
pTmeasurement for v
n{4}(v
n{EP})is integrated over the
pTrange 5–20 (10–20) GeV .
the case of the
pTdependence can be made: v
2{2k}for
k>1 is systematically smaller than v
2{2}and
v
2{EP}, while the results for v2{2k}with
k>1 agree with each other for all centrality intervals. No
strong dependence on pseudorapidity is observed for any of the second flow harmonic measurements
in any of the centrality bins. Some weak dependence is observed only for v
2{2}and can be attributed
to the contributions from short-range two-particle correlations. A weak pseudorapidity dependence is
observed for v
3{4}as shown in Fig. 7 for harmonics averaged over the full accessible centrality range
(0–60%. The quadrangular flow harmonics, v
4{4}, show no significant dependence on pseudorapidity,within the measurement uncertainties, over the centrality range 0–25%. A systematic reduction in the
-2 -1 0 1 2
2
v
0.05 0.1
0.15 v2{EP}
2{2}
v
2{4}
v
2{6}
v
2{8}
v
0-2%
-2 -1 0 1 2
2
v
0.05 0.1
0.15 2-5%
-2 -1 0 1 2
2
v
0.05 0.1
0.15 5-10%
-2 -1 0 1 2
0.05 0.1
0.15 10-15%
-2 -1 0 1 2
2
v
0.05 0.1
0.15 15-20%
-2 -1 0 1 2
2
v
0.05 0.1
0.15 20-25%
-2 -1 0 1 2
0.05 0.1
0.15 25-30%
-2 -1 0 1 2
2
v
0.05 0.1
0.15 30-35%
-2 -1 0 1 2
2
v
0.05 0.1
0.15 35-40%
-2 -1 0 1 2
0.05 0.1
0.15 40-45%
-2 -1 0 1 2
2
v
0.05 0.1
0.15 45-50%
-2 -1 0 1 2
2
v
0.05 0.1
0.15 50-55%
-2 -1 0 1 2
0.05 0.1
0.15 55-60%
-2 -1 0 1 2
0.05 0.1
0.15 60-80%
-2 -1 0 1 2 η
0.05 0.1
0.15 ATLAS Preliminary = 2.76 TeV sNN
Pb+Pb b-1
µ
≈ 7 Lint
< 20 GeV 0.5 < pT
Fig. 6: The second flow harmonic calculated with the two-, four-, six-, and eight-particle cumulants as a function of
ηin different centrality intervals, integrated over the
pTrange 0.5
<pT<20 GeV. The results for v
2{EP}are also shown. Statistical errors are shown as bars and systematic uncertainties as shaded bands.
-2 -1 0 1 2
η
3
v
0 0.02 0.04 0.06
3{EP}
v
3{2}
v
3{4}
v ATLAS Preliminary
= 2.76 TeV sNN
Pb+Pb
< 20 GeV , 0.5 < pT
b-1
µ
≈ 7 Lint
0-60%
-2 -1 0 1 2
η
4
v
0 0.01 0.02 0.03
4{EP}
v
4{2}
v
4{4}
v ATLAS Preliminary
= 2.76 TeV sNN
Pb+Pb
< 20 GeV , 0.5 < pT
b-1
µ
≈ 7 Lint
0-25%
Fig. 7: The pseudorapidity dependence of v
3(left plot) calculated with two- and four-particle cumulants
and with the event plane method, integrated over
pTfrom 0.5 GeV to 20 GeV for the centrality range
0–60%. The same is shown for v
4(right plot) for the centrality range 0–25%. Statistical errors are shown
as bars and systematic uncertainties as shaded bands.
non-flow contribution is observed for v
n{EP}as compared to v
n{2}.0 100 200 300 400
2
v
0.05 0.1 0.15
2{2}
v
{2,EbyE}
calc
v2
ATLAS Preliminary = 2.76 TeV sNN
Pb+Pb
| < 2.5 η | b-1
µ
≈ 7 Lint
< 20 GeV 0.5 < pT
part〉
〈N
0 100 200 300 400
ratio
1
1.05 v2{2}/vcalc2 {2,EbyE} 0 100 200 300 400
2
v
0.05 0.1 0.15
2{4}
v
{4,EbyE}
calc
v2
ATLAS Preliminary = 2.76 TeV sNN
Pb+Pb
| < 2.5 η | b-1
µ
≈ 7 Lint
< 20 GeV 0.5 < pT
part〉
〈N
0 100 200 300 400
ratio
1
1.05 v2{4}/vcalc2 {4,EbyE}
0 100 200 300 400
2
v
0.05 0.1 0.15
2{6}
v
{6,EbyE}
calc
v2
ATLAS Preliminary = 2.76 TeV sNN
Pb+Pb
| < 2.5 η | b-1
µ
≈ 7 Lint
< 20 GeV 0.5 < pT
part〉
〈N
0 100 200 300 400
ratio
1
1.05 v2{6}/vcalc2 {6,EbyE} 0 100 200 300 400
2
v
0.05 0.1 0.15
2{8}
v
{8,EbyE}
calc
v2
ATLAS Preliminary = 2.76 TeV sNN
Pb+Pb
| < 2.5 η | b-1
µ
≈ 7 Lint
< 20 GeV 0.5 < pT
part〉
〈N
0 100 200 300 400
ratio
1
1.05 v2{8}/vcalc2 {8,EbyE}
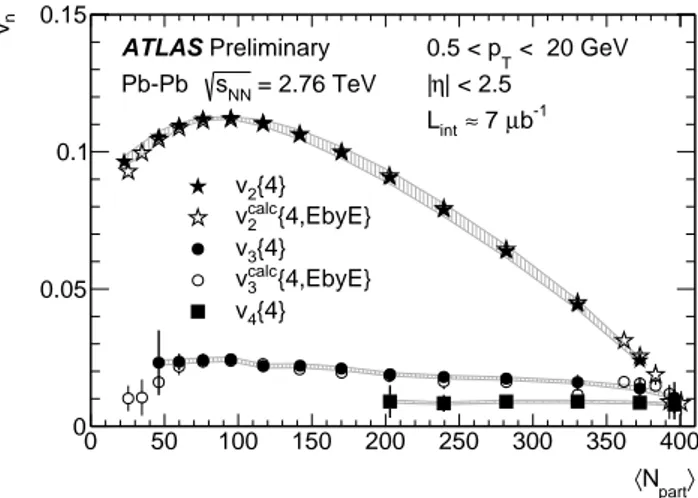
![Fig. 8: Comparison of the centrality dependence of v 2 {2k} for k = 1,2, 3,4 integrated over p T from 0.5 GeV to 20 GeV and over |η| < 2.5, and v calc 2 {2k,EbyE} calculated from the measured v 2 distribution [16]](https://thumb-eu.123doks.com/thumbv2/1library_info/4017982.1541553/15.892.154.744.145.643/comparison-centrality-dependence-integrated-ebye-calculated-measured-distribution.webp)
![Fig. 9: The ratio of v 2 {6} and v 2 {8} to v 2 {4} as a function of the average number of participating nucleons, hN part i, for elliptic flow coefficients obtained from the cumulant method (left) and calculated from the measured p(v 2 ) distribution [16]](https://thumb-eu.123doks.com/thumbv2/1library_info/4017982.1541553/16.892.163.733.117.340/function-participating-nucleons-elliptic-coefficients-obtained-calculated-distribution.webp)