A TLAS-CONF-2012-110 13 August 2012
ATLAS NOTE
ATLAS-CONF-2012-110
August 9, 2012
Search for Massive Coloured Scalars with the ATLAS Detector in Four-Jet Final States using 4.6 fb − 1 of √
s = 7 TeV proton-proton collision data
The ATLAS Collaboration
Abstract
A search for pair-produced massive coloured scalar particles decaying to a four-jet final state is performed in proton-proton collisions at √
s = 7 TeV. The analyzed data sample corresponds to an integrated luminosity of 4.6 fb
−1. No deviation from the Standard Model is observed in the invariant mass spectrum of the two jet pairs. A limit on a scalar gluon pair production cross section of 70 pb (10 pb) is obtained at the 95% confidence level for a scalar gluon mass of 150 GeV (350 GeV). Interpreting these results as mass limits on scalar gluons, masses ranging from 150 to 287 GeV are excluded at the 95% confidence level.
c
Copyright 2012 CERN for the benefit of the ATLAS Collaboration.
Reproduction of this article or parts of it is allowed as specified in the CC-BY-3.0 license.
1 Introduction
Massive coloured scalar particles that decay into gluons are predicted in several extensions of the Stan- dard Model (SM). The most prominent examples are the scalar partners of a Dirac gluino called scalar gluons (‘sgluons’) in extended supersymmetric models like the N = 1/N = 2 hybrid model [1, 2] or the R-symmetric MSSM [3, 4]. These particles are also present in compositeness models [5, 6, 7, 8, 9].
While single production of sgluons is possible, its cross section depends strongly on the masses of the supersymmetric particles. In typical scenarios, the cross section is only of the same order as the pair production cross section. The pair production cross section does not depend, at leading order, on su- persymmetric parameters except for the sgluon mass. Since the sgluon has positive R-parity [10], light sgluons, i.e. sgluons with masses of the order of 100 GeV, are expected to decay to two gluons with a branching ratio close to one [2, 4]. Therefore in the following, pair production of sgluons each decaying to two gluon jets, leading to a four-jet final state, will be used as a benchmark process. ATLAS has searched for signatures of these particles in the dataset of 34 pb
−1recorded in 2010 [11] excluding at the 95% confidence level sgluons with masses of 100 to 180 GeV with the exception of a mass window of 5 GeV around 140 GeV. The search described in this paper, using data recorded in 2011, extends signif- icantly the explored mass region up to 300 GeV. CMS has also searched for resonances in four-jet final states [12] for masses above 320 GeV.
The strategy of the analysis is to first reconstruct the masses of the two sgluons. Then the distribution of the average mass of the two sgluons is analyzed for evidence of a signal with a fit of the background, plus a signal template of variable strength.
2 The ATLAS Detector
ATLAS is a multipurpose detector [13, 14] with nearly 4π coverage in solid angle. The inner detector, consisting of silicon pixel and microstrip detectors as well as a transition radiation tracker, is immersed in a 2 T solenoidal magnetic field. In the pseudorapidity
1region |η| < 3.2, high-granularity liquid- argon (LAr) electromagnetic (EM) sampling calorimeters are used. An iron/scintillator-tile calorimeter provides hadronic coverage for |η| < 1.7. The end-cap and forward regions, spanning 1.5 < |η| < 4.9, are instrumented with LAr calorimetry for both EM and hadronic measurements. The calorimeters are surrounded by a muon spectrometer which consists of three large superconducting toroids, a system of precision tracking chambers, and fast detectors for triggering. ATLAS uses a three-level trigger system.
The first-level trigger is implemented in custom hardware, the other two trigger levels are implemented in software running on commercial PC farms.
3 Simulations, trigger and reconstruction
SM multijet Monte Carlo (MC) samples are used to develop a data-driven method for the background estimation. To incorporate detector e ff ects, these events are passed through a detailed simulation of the ATLAS detector [15] based on G 4 [16]. A [17] SM multijet samples are generated with the MLM matching scheme and interfaced to H [18] for the parton shower and fragmentation processes and to J [19] for the simulation of the underlying event. The A samples are generated with the CTEQ6L1 parton density functions (PDF) [20] (tune AUET2-CTEQ6L1 [21]). P [22] SM multijet samples are generated with the LO
∗MRST PDF [23] (tune AUET2B LO
∗∗[21]). The sgluon
1
ATLAS uses a right-handed coordinate system with its origin at the nominal interaction point (IP) in the centre of the detector and the
z-axis along the beam pipe. Thex-axis points from the IP to the centre of the LHC ring, and theyaxis points upward. Cylindrical coordinates (r, φ) are used in the transverse (x-y) plane,
φbeing the azimuthal angle around the beam axis.
The pseudorapidity is defined in terms of the polar angle
θas
η=−ln tan(θ/2).
pair production differential cross section [2] is implemented as an external process interfaced to P . The decay of the sgluons as well as fragmentation and hadronization are performed by P . For the normalisation of the signal the next-to-leading order (NLO) cross section of [24] is used.
Signal samples of 40k to 120k events each were generated with masses of 150, 250, 300 and 350 GeV and passed through the detailed simulation of the ATLAS detector. All samples as well as a sample with a mass of 200 GeV were passed through a fast simulation which reproduces well the detailed simulation.
)/2 [GeV]
+M
2(M
10 100 200 300 400 500
Arbitrary units / 20 GeV
0 0.05 0.1 0.15 0.2 0.25 0.3 0.35
0.4
MC sgluonm=150 GeV m=250 GeV m=350 GeV preliminary
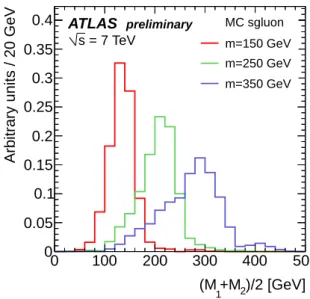
ATLAS
= 7 TeV sFigure 1: The reconstructed average mass distribution after all analysis cuts for the signal samples with m
sgluon= 150, 250 and 350 GeV.
Jets are reconstructed using the anti-k
tjet clustering algorithm [25] with a radius parameter of 0.4.
The inputs to the jet algorithm are three-dimensional clusters [26] formed from energy deposits in the calorimeters. The jets are calibrated using transverse momentum ( p
T) and η-dependent correction factors based on MC simulations and validated by test beam and collision data studies [27]. Quality criteria are applied to reject jets produced by out-of-time or fake energy deposits in the calorimeters [28]. Such jets are typically produced by hardware problems in the calorimeters, LHC beam-gas interactions or cosmic-ray induced showers.
The analysis uses collision data collected in the year 2011 at a centre-of-mass energy of √ s = 7 TeV and corresponding to an integrated luminosity of 4.6 fb
−1. The data were recorded with a multijet trigger requiring at least four jets with p
Tthresholds leading to a trigger plateau of 80 GeV for the p
Tof the reconstructed jets used in the analysis. To ensure full trigger efficiency, the four highest-p
T(‘leading’) jets in a selected event are required to be separated from each other by ∆ R > 0.6 (where
∆ R = p
(∆ φ)
2+ (∆ η)
2with ∆ φ and ∆ η being the difference in azimuth and pseudorapidity of the two jets). The resulting trigger efficiency of at least 99% obtained with simulated events was verified in data with the use of an independent single-electron trigger.
4 Analysis
A selected event must contain at least one reconstructed primary vertex with five or more associated
tracks each having p
T> 400 MeV. At least four jets with p
T> 80 GeV and |η| < 1.4 are required
as the signal is produced centrally in contrast to the background. These selection criteria together with
the trigger requirements are referred to as preselection in the following. To improve the sensitivity of the analysis, the jet p
Tthreshold is defined as a function of the probed sgluon mass: p
T(4
thjet) >
max(0.30 × m
sgluon+ 30, 80) GeV. The stringent p
Trequirements lead to a boost of the selected sgluons and hence to an accumulation of jet pairs from sgluon decays with ∆ R ≈ 1. To increase the sgluon reconstruction e ffi ciency, the four leading jets in a preselected event are paired by minimizing the quantity
| ∆ R
pair1− 1 | + | ∆ R
pair2− 1 | . The event is rejected if, for the chosen combination, a jet pair has ∆ R > 1.6.
The reconstructed masses of the sgluons are denoted M
1and M
2. The reconstructed average mass is ( M
1+ M
2)/2. The scattering angle | cos(θ
∗)| of the reconstructed sgluons in the rest frame of the four leading jets is required to be less than 0.5. The SM multijet background is peaked in the forward region, reflecting t-channel gluon exchange, while the signal is produced centrally due to the scalar nature of the sgluon. Finally, to further improve the rejection of the SM multijet background, the relative di ff erence between the two reconstructed masses |M
1− M
2|/(M
1+ M
2) is required to be less than 0.15. The selection efficiency of the signal is 0.6% for all simulated samples of the different sgluon masses.
The reconstructed average mass distribution after all cuts is shown for sgluon signals with varying masses in Fig. 1. As the mass of the sgluon increases, the requirement on the transverse momentum of the jets becomes less stringent. An increase of 100 GeV in the sgluon mass leads to an increase of only 30 GeV in the requirement on the jet transverse momenta. As a consequence the tails to lower masses are more evident in the figure, as they are not sculpted as much by the p
Tcut.
After applying preselection and jet pairing, the primary variables used in the analysis are compared to the A and P multijet simulation. Backgrounds other than SM multijet events are estimated to be smaller than 1% of the total background sample and are thus neglected. Since the analysis requires at least four jets, A is expected to give a better description than P where the third and fourth jets are generated via a parton shower. However, due to a larger available sample size of the P MC, both samples are used in this analysis.
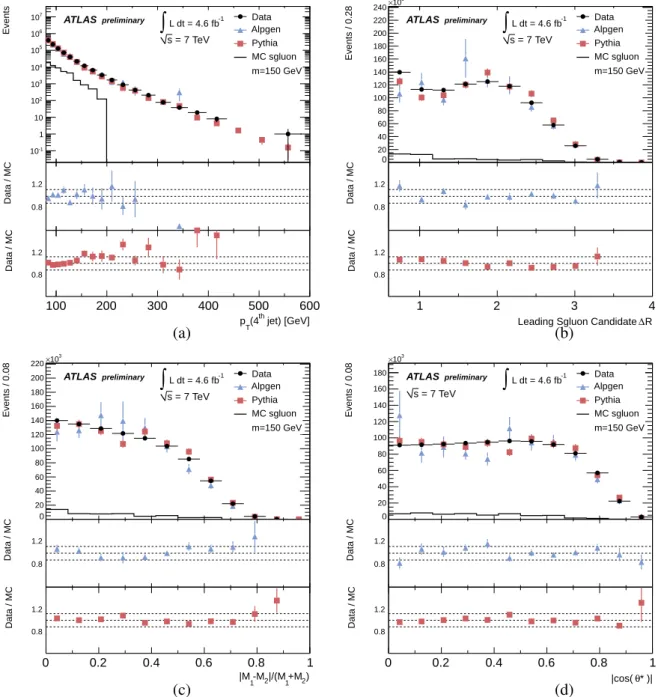
The MC is normalised to the data after the preselection described above. The obtained normalisation factor of 1.25 for A is compatible with the one (1.26) obtained in [11]. For P the normalisation factor is 0.75, reasonably close to the value of 0.65 [29] obtained with the 2010 data using a di ff erent tune (AMBT1). After this normalisation, for all variables, namely the transverse momentum (Fig. 2(a)), the separation of the two jets of the sgluon candidate with the highest transverse momentum (Fig. 2(b)), the relative mass di ff erence (Fig. 2(c)) and the scattering angle (Fig. 2(d)), the description of the data by the MC simulation is in general at the 20% level. To reduce the dependence on simulation, the background is estimated from data, taking advantage of the kinematic properties of the sgluon signal.
Table 1: Definition of the four regions for the background determination. Region A is the signal region.
Region Selection
A | cos(θ
∗)| < 0.5 and |M
1− M
2|/(M
1+ M
2) <15%
B | cos(θ
∗)| > 0.5 and |M
1− M
2|/(M
1+ M
2) <15%
C | cos(θ
∗)| < 0.5 and |M
1− M
2|/(M
1+ M
2) >15%
D | cos(θ
∗)| > 0.5 and |M
1− M
2|/(M
1+ M
2) >15%
The main discriminating variable of the analysis is the reconstructed average mass. To determine the
background normalisation as well as the shape of the background in the signal region, an ABCD method
is used. The data sample is divided into one signal region (A) and three background dominated regions
(B, C and D). The variables used to define the four regions are | cos(θ
∗)| and |M
1− M
2|/(M
1+ M
2). The
regions defined in Table 1, are chosen as a compromise between the statistical significance of the signal
in region A and the statistical uncertainty in the regions B, C and D which feeds into the uncertainty on
the background prediction.
Events
10-1 1 10 102 103 104 105 106
107 Data
Alpgen Pythia MC sgluon m=150 GeV L dt = 4.6 fb-1
∫
preliminary
ATLAS
= 7 TeV s
100 200 300 400 500 600
Data / MC
1.2 0.8
jet) [GeV]
(4th
pT
100 200 300 400 500 600
Data / MC
1.2 0.8
Events / 0.28
0 20 40 60 80 100 120 140 160 180 200 220 240
103
×
Data Alpgen Pythia MC sgluon m=150 GeV L dt = 4.6 fb-1
∫
preliminary
ATLAS
= 7 TeV s
0
1 2 3 4
Data / MC
1.2 0.8
∆R Leading Sgluon Candidate
1 2 3 4
Data / MC
1.2 0.8
(a) (b)
Events / 0.08
0 20 40 60 80 100 120 140 160 180 200 220
103
×
Data Alpgen Pythia MC sgluon m=150 GeV L dt = 4.6 fb-1
∫
preliminary
ATLAS
= 7 TeV s
0
0 0.2 0.4 0.6 0.8 1
Data / MC
1.2 0.8
2)
1+M
2|/(M
1-M
|M
0 0.2 0.4 0.6 0.8 1
Data / MC
1.2 0.8
Events / 0.08
0 20 40 60 80 100 120 140 160 180
103
×
Data Alpgen Pythia MC sgluon m=150 GeV L dt = 4.6 fb-1
∫
preliminary
ATLAS = 7 TeV s
0
0 0.2 0.4 0.6 0.8 1
Data / MC
1.2 0.8
θ* )|
|cos(
0 0.2 0.4 0.6 0.8 1
Data / MC
1.2 0.8
(c) (d)
Figure 2: The kinematic variables of the analysis are shown after applying the preselection and pairing the four leading jets: (a) is the transverse momentum of the 4
thjet. (b) is the ∆ R distribution between the two jets of the reconstructed sgluon candidate with the highest transverse momentum jet. (c) is the relative mass difference. (d) is the scattering angle in the 4-jet centre-of-mass frame. The black histogram is the signal for a sgluon mass of 150 GeV normalised to the NLO cross section. Data (dots) are compared to the A (triangles) and P (rectangles) SM multijet samples where the MC samples are normalised to the data. The ratio data/MC is also shown separately for A and P
with its statistical uncertainty.
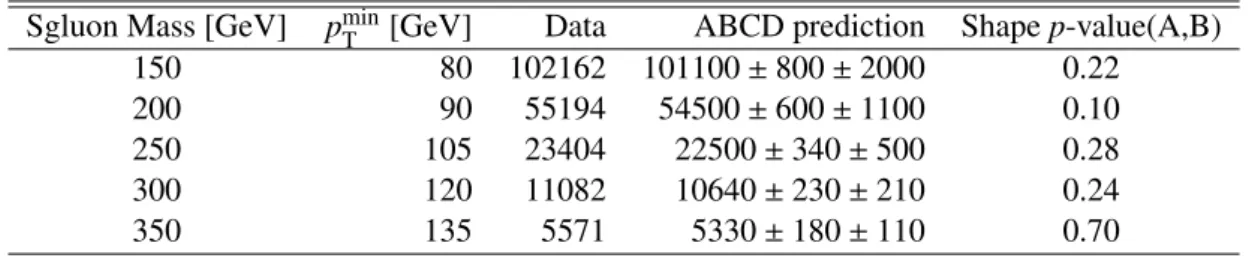
Table 2: Comparison of the data in the signal region with the background prediction. The first column is the sgluon mass hypothesis, the second column is the corresponding minimum p
Trequirement on the four jets, followed by the number of observed data events in the signal region A (third column) and the number of predicted events using the ABCD method (fourth column), where the first uncertainty given is statistical and the second systematic. The last column gives the p-value obtained from a Kolmogorov- Smirnov test between the shapes of the reconstructed average mass distributions in regions A and B.
Only statistical uncertainties are considered in this test.
Sgluon Mass [GeV] p
minT[GeV] Data ABCD prediction Shape p-value(A,B)
150 80 102162 101100 ± 800 ± 2000 0.22
200 90 55194 54500 ± 600 ± 1100 0.10
250 105 23404 22500 ± 340 ± 500 0.28
300 120 11082 10640 ± 230 ± 210 0.24
350 135 5571 5330 ± 180 ± 110 0.70
The correlation between the two variables is less than 0.1% in the four regions in the data and less than 1% in the P samples, so the normalisation of the background in the region A is derived from the ratio of events in the control samples using N
0A= N
B· N
C/N
D. A closure test is performed with the P and A MC samples and shows that N
A0reproduces the actual number of events in region A, N
A, within 2% accuracy, which is assigned as systematic uncertainty on the background prediction.
Table 2 summarises the results for the five sgluon mass hypotheses and corresponding signal re- gions A obtained in data, together with the corresponding background predictions. Good agreement is observed. The last column gives the p-value obtained from a Kolmogorov-Smirnov test between the shapes of the reconstructed average mass distributions in regions A and B, which, in the ABCD method, are assumed to be equal. Satisfactory p-values are found in this test, which considers statistical uncer- tainties only.
5 Results
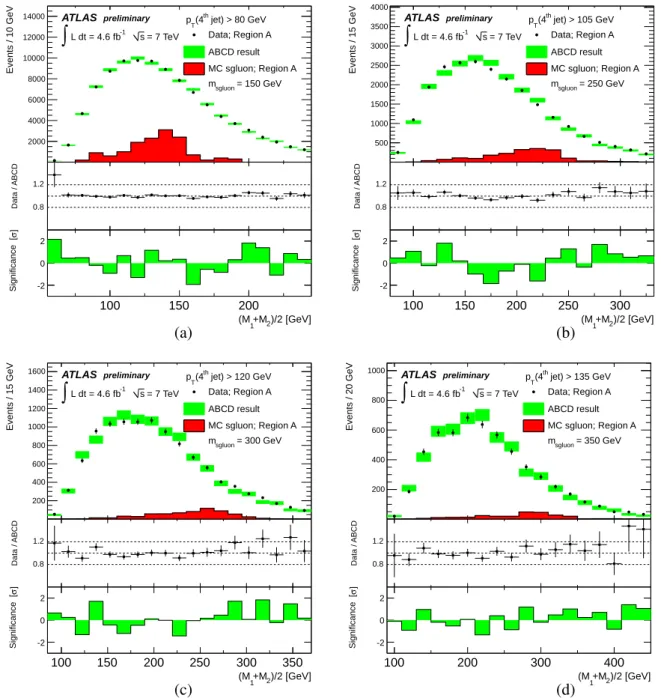
The result of the background estimation is shown in Fig. 3 for sgluon masses of 150, 250, 300 and 350 GeV. The data in region A are compared to the data in the control region B normalised using the ABCD method. The expected signal in region A is also shown. The ratio of background to data as well as the significance, in standard deviations, of the difference between the data and the prediction are shown as a function of the reconstructed average mass. The significance takes into account only statistical uncertainties.
The average mass distribution of the data in region A is compared to the background only prediction and to the background plus signal prediction using a binned likelihood test, which incorporates system- atic uncertainties via nuisance parameters. Systematic uncertainties a ff ecting the simulated sgluon signal shapes are incorporated in the fit by varying signal templates.
The systematic uncertainties on the acceptance, and the correlation assumed for each uncertainty source between the four regions, are listed in Table 3 for an sgluon mass of 300 GeV. The uncertainty on the jet energy scale as well as the uncertainty on the jet energy resolution have an impact on both the signal shape and the acceptance. These uncertainties were measured with the complete 2010 data set [31]
to which an extra uncertainty for the higher pile-up in the 2011 run was added. The variation of the
P parameters controlling initial state and final state radiation in a range consistent with experimental
data [30] produces only a small effect on the reconstructed average mass distribution. Therefore, this
systematic uncertainty is taken only on the signal acceptance. An uncertainty of 1% is assigned to the
Events / 10 GeV
2000 4000 6000 8000 10000 12000 14000
Data; Region A ABCD result MC sgluon; Region A
= 150 GeV
sgluon
m preliminary
ATLAS L dt = 4.6 fb-1
∫
s = 7 TeV (4th jet) > 80 GeV pT100 150 200
Data / ABCD
1.2 0.8
)/2 [GeV]
+M2
(M1
100 150 200
]σSignificance [ -2
0 2
Events / 15 GeV
500 1000 1500 2000 2500 3000 3500 4000
Data; Region A ABCD result MC sgluon; Region A
= 250 GeV
sgluon
m preliminary
ATLAS L dt = 4.6 fb-1
∫
s = 7 TeV (4th jet) > 105 GeV pT100 150 200 250 300
Data / ABCD
1.2 0.8
)/2 [GeV]
+M2
(M1
100 150 200 250 300
]σSignificance [ -2
0 2
(a) (b)
Events / 15 GeV
200 400 600 800 1000 1200 1400 1600
Data; Region A ABCD result MC sgluon; Region A
= 300 GeV
sgluon
m preliminary
ATLAS L dt = 4.6 fb-1
∫
s = 7 TeV (4th jet) > 120 GeV pT100 150 200 250 300 350
Data / ABCD
1.2 0.8
)/2 [GeV]
+M2
(M1
100 150 200 250 300 350
]σSignificance [ -2
0 2
Events / 20 GeV
200 400 600 800 1000
Data; Region A ABCD result MC sgluon; Region A
= 350 GeV
sgluon
m preliminary
ATLAS L dt = 4.6 fb-1
∫
s = 7 TeV (4th jet) > 135 GeV pT100 200 300 400
Data / ABCD
1.2 0.8
)/2 [GeV]
+M2
(M1
100 200 300 400
]σSignificance [ -2
0 2
(c) (d)
Figure 3: The comparison of the data in the signal region with the background prediction is shown for:
(a) m
sgluon= 150 GeV, (b) m
sgluon= 250 GeV, (c) m
sgluon= 300 GeV and (d) m
sgluon= 350 GeV. The
points are the data in the signal region (region A). The plain histogram (red) is the estimated signal in
region A normalised to the NLO cross section. The prediction of background in region A based upon
the data in region B normalised using the ABCD method is shown as the rectangles which include the
statistical uncertainty. The data / background ratio and the statistical significance, in standard deviations,
are also shown in the lower panels.
Table 3: The systematic uncertainties on the signal due to the jet energy scale (JES), jet energy resolution (JER), initial and final state radiation (ISF/FSR), the trigger efficiency (Trigger), the Monte Carlo signal statistics (MC Statistics), the choice of parton distribution functions (PDF) and the integrated luminosity (Luminosity). The relative uncertainty of the signal acceptance is given for the four regions and for an sgluon mass of 300 GeV. The JES uncertainty is treated as asymmetric, corresponding to an upward (downward) fluctuation of JES. For the JER uncertainty, only a upward fluctuation of the JER is consid- ered, i.e. only a degradation of the JER, with respect to the nominal MC JER. The last column shows the expected correlation among the four regions.
Systematic A B C D Correlation ABCD
JES + 10%,-10% + 11%,-11% + 11%,-13% + 15%,-10% 100%
JER +0%,-2% +0%,-7% +0%,-1% +0%,-2% 100%
ISR / FSR + 3.5%,-3.5% + 3.5%,-3.5% + 3.5%,-3.5% + 3.5%,-3.5% 100%
Trigger ±1% ±1% ±1% ±1% 100%
MC Statistics ±4% ±11% ±5% ±8% 0%
PDF ±3% ±3% ±3% ±2% 0%
Luminosity ±1.8% ±1.8% ±1.8% ±1.8% 100%
trigger e ffi ciency for sgluon signals. The uncertainty on the signal acceptance due to the signal MC statistical uncertainty is uncorrelated among the four regions. The acceptance uncertainty due to the PDF is estimated with the use of independent CT10 [20] error sets. The uncertainty on the luminosity is taken to be 1.8% [32].
To probe for the presence of signal, a fit with a freely varying signal strength parameter is performed for each mass hypothesis. No significant deviation from zero is found, and limits on sgluon production are derived in the following.
The profile likelihood ratio ˜ q
µ[33] is used as test statistic and exclusions are determined using the CL
sapproach [34]. Limits are computed using samples of pseudo-experiments generated taking into account all uncertainties and also the signal contamination in the control regions. The normalisation and shape of region B are used, whereas for regions C and D only the normalisation is used. MC templates are used to generate the shape of the signal in each toy experiment. In each pseudo-experiment the statistical and systematic uncertainties are randomized, using Poisson and Gaussian distributions, according to their measured values.
Fig. 4 shows the expected and observed 95% CL upper bounds on the product of the scalar pair production cross sections and the branching ratio to gluons as a function of the scalar mass. For a mass of 150 GeV (350 GeV), a limit of 70 pb (10 pb) on the scalar gluon pair production cross section at the 95% confidence level is obtained. The solid line is the prediction of the sgluon pair production cross section at NLO [24] which increases the leading order cross section by a factor of about 1.6. The hatched band indicates the systematic uncertainty due to the choices of renormalisation and factorisation scales. Due to this recent calculation, the previously unexcluded mass region around 140 GeV [11] is now excluded by reinterpreting the limits obtained with the data recorded in 2010. For the analysis of the data recorded in 2011, sgluons with a mass from 150 GeV to 287 GeV are excluded. The endpoint of the mass limit is defined as the intersection of the cross section limit with the NLO cross section minus one standard deviation of the theory uncertainty.
The dashed line is the prediction for the hyperpion cross section of a compositeness model, obtained
by rescaling the sgluon cross section according to the ratios of [7]. Since the ratios were calculated at
leading order, this line should only be considered as an approximate indication of the excluded mass
region.
Mass [GeV]
100 150 200 250 300 350
BR [pb] × σ 9 5 % C L L im it
10 10
210
310
4Observed Expected
σ
± 1 σ
± 2
Scalar gluon Hyperpion ATLAS 2010
PreliminaryATLAS
L dt = 4.6 fb-1
∫
= 7 TeV s