A TLAS-CONF-2012-158
14/11/2012ATLAS NOTE
ATLAS-CONF-2012-158
November 14, 2012
Update of the H → WW
(∗)→ eνµν analysis with 13.0 fb
−1of √
s = 8 TeV data collected with the ATLAS detector
The ATLAS Collaboration
Abstract
An update of the H→ WW
(∗)→ eνµν analysis has been performed using proton-proton collision data corresponding to an integrated luminosity of 13.0 fb
−1at a centre-of-mass energy of 8 TeV collected during 2012 with the ATLAS detector at the Large Hadron Collider. The analysis focuses on the mass region around 125 GeV where a discovery of a new neutral boson was made in summer 2012. An excess of events over the expected background is observed corresponding to a local p
0-value of 3 × 10
−3or 2.8 standard deviations. The signal strength, which is defined as the ratio of the observed cross section to the value predicted for a Standard Model Higgs boson, is measured to be µ = 1.5 ± 0.6 for m
H= 125 GeV.
c
Copyright 2012 CERN for the benefit of the ATLAS Collaboration.
Reproduction of this article or parts of it is allowed as specified in the CC-BY-3.0 license.
1 Introduction
The Standard Model (SM) of particle physics [1, 2, 3] has been tested by many experiments over the last four decades and has been shown to successfully describe the interactions of fundamental particles at the highest energies accessible by current experiments. The mechanism for electroweak symmetry breaking in the SM is hypothesised to give mass to all massive elementary particles [4, 5, 6]. It also predicts the existence of a scalar particle, knows as the Higgs boson.
The ATLAS and CMS collaborations have recently reported on significant excesses of events in the searches for the SM Higgs boson [7, 8]. These searches combine multiple final states and use LHC pp collision data corresponding to 5 fb
−1of integrated luminosity at √
s = 7 TeV and 6 fb
−1at √
s = 8 TeV. The ATLAS collaboration reported a new neutral boson with a measured mass of m
H= 126.0 ± 0.4 (stat) ±0.4 (syst) GeV with a local significance of 5.9 standard deviations.
The CMS collaboration reported a similar observation, with an excess of 5.0 standard deviations at m
H= 125.3 ± 0.4 (stat) ± 0.5 (syst) GeV.
Now that the existence of a new particle has been established by these searches, the focus of ex- perimental work turns to the consistency of the observed particle with the predictions of the Standard Model. The H→ WW
(∗)→ `ν`ν channel (with ` = e, µ) provides important information on both the overall production rate and the coupling to W bosons. The branching ratio to WW falls off with de- creasing m
Hbelow m
H= 2m
Wbut is still just over 20% at m
H= 125 GeV [9], and the dilepton final state allows the selection of events with a favourable signal-to-background ratio. The leading backgrounds are continuum WW → `ν`ν production and t¯ t events in which both W bosons decay to `ν. Additional sources of background include Drell-Yan (Z/γ
∗→ ``), W + jets, single top quark, W(Z/γ
(∗)), and ZZ events.
The ATLAS paper [7] describing the observation of a new particle in the SM Higgs boson search includes results [10] from the H→ WW
(∗)→ `ν`ν channel, in which an excess is seen corresponding to 2.8 standard deviations using the combined √
s = 7 and √
s = 8 TeV data, collected through mid-June 2012. The results reported here use the √
s = 8 TeV data collected between the beginning of April and the middle of September 2012, which, after requiring that all detector components are functioning nominally, corresponds to 13.0 fb
−1of pp collisions, an additional 7 fb
−1at √
s = 8 TeV. Along with adding data, the analysis has been further refined with respect to the √
s = 8 TeV 6 fb
−1analysis [10]
and the √
s = 7 TeV 5 fb
−1analysis [11]. A significant improvement has been made in the modelling of the dominant background from continuum WW production. Due to these improvements, a consis- tent combination of the results presented here and the results of Ref. [11] requires a re-analysis of the √
s = 7 TeV data, which is in progress and will be presented in a future update of this channel.
The analysis presented here is predominantly sensitive to Higgs boson production via the domi- nant gluon-gluon fusion (ggF) process. The hypothesis of a SM Higgs boson with m
H= 125 GeV, compatible with the observed excess, is used to characterise the signal. As with the earlier 2012 analysis, only results in the eνµν final state, which provide the large majority of the sensitivity of the analysis, are presented here. The occurrence of multiple pp collisions per bunch crossing, referred to as “pile-up”, has increased over time. The average number of interactions per bunch crossing in 2011 was around 10. In 2012, the average has increased to around 20. The extra interactions de- grade the missing transverse energy resolution, significantly increasing the Drell-Yan background in the same-flavour (eνeν and µνµν) final states in 2012 data compared to 2011.
After the completion of the 6 fb
−12012 analysis, the 2012 data were re-blinded for the re-
optimisation of the analysis and the incorporation of new data. The same blinding criteria as for
the summer analysis were used, with events passing the kinematic selection designed to isolate a sig-
nal from a SM Higgs boson with a mass between 110 and 140 GeV excluded from consideration. The
signal region data were unblinded once the agreement between data and the background model in the control regions corresponding to the dominant backgrounds was judged to be reasonable.
2 Data and simulated samples
The data used for this analysis were collected in 2012 using the ATLAS detector, a multi-purpose particle physics experiment with a forward-backward symmetric cylindrical geometry and near 4π coverage in solid angle [12]. ATLAS consists of an inner tracking detector surrounded by a thin su- perconducting solenoid, electromagnetic and hadronic calorimeters, and an external muon spectrom- eter incorporating large superconducting air-core toroid magnets. The combination of these systems provides charged particle measurements together with efficient and precise lepton measurements over the pseudorapidity
1range |η| < 2.5. Jets are reconstructed over the full coverage of the calorimeters,
|η| < 4.9; this calorimeter coverage also provides a measurement of the missing transverse energy E
Tmiss.
The data used for this analysis were collected using inclusive single-muon and single-electron triggers. The two main triggers require the transverse momentum of the lepton with respect to the beam line, p
T, to exceed 24 GeV and that the lepton be isolated: the scalar sum of the p
Tof charged particles within ∆ R = p
∆ φ
2+ ∆ η
2= 0.2 of the lepton direction is required to be less than 0.12 and 0.10 times the lepton p
Tfor the muon and electron, respectively. Because of the detector geometry, the acceptance of the muon trigger is limited to |η| < 2.4. The lepton trigger e ffi ciencies are measured as a function of p
T, η, and data-taking period using Z events. The efficiencies are approximately 90%
for electrons, and 90% (70%) for muons in the endcap (barrel).
In this analysis, the signal contributions considered include the dominant gluon fusion production process (gg → H, denoted as ggF), the vector-boson fusion production process (qq
0H, denoted as VBF) and the Higgs-strahlung process (qq
0→ W H, ZH, denoted as W H / ZH). The t¯ tH production mechanism is negligible due to its smaller cross section. For the decay of the Higgs boson, only the H → WW
(∗)→ eνµν mode is considered, including the small contributions from leptonic τ decays.
The branching fraction for this decay as a function of m
His calculated using the P 4 [13, 14]
program, with HDECAY also used in calculating the total width [15].
The signal cross section is computed to next-to-next-to-leading order (NNLO) [16, 17, 18, 19, 20, 21] in QCD for the ggF process using the MSTW2008 PDF set [22]. Next-to-leading order (NLO) electroweak (EW) corrections are also applied [23, 24], as well as QCD soft-gluon resummations up to next-to-next-to-leading log (NNLL) [25]. These calculations are detailed in Refs. [26, 27], and assume factorisation between the QCD and EW corrections.
Approximate NNLO QCD corrections [28] and full NLO QCD and EW corrections [29,30,31] are used to calculate the cross sections for VBF signal production. The cross sections of the associated W H/ZH production processes are calculated including NNLO QCD corrections [32, 33] and NLO EW corrections [34].
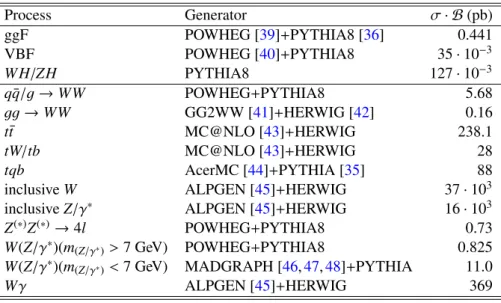
The Monte Carlo (MC) generators used to model signal and background processes are listed in Table 1. For most processes, separate programs are used to generate the hard scattering process and to model the parton showering, hadronisation, and the underlying event. PYTHIA [35] or PYTHIA8 [36] are used for these latter three steps for the signal and some of the background processes. When
1ATLAS uses a right-handed coordinate system with its origin at the nominal interaction point (IP) in the centre of the detector, and thez-axis along the beam line. Thex-axis points from the IP to the centre of the LHC ring, and they-axis points upwards. Cylindrical coordinates (r, φ) are used in the transverse plane,φbeing the azimuthal angle around the beam line. The pseudorapidity is defined in terms of the polar angleθasη=−ln tan(θ/2).
Table 1: Monte Carlo generators used to model the signal and background processes, and the corre- sponding cross sections at √
s = 8 TeV (given m
H= 125 GeV in the case of the signal processes).
The ggF Higgs boson p
Tspectrum in POWHEG [9] is weighted to agree with the prediction from HqT [37]. Heavy quark mass e ff ects in the gluon-gluon production are also included [38]. The rel- evant single top quark production channels (s-channel and Wt) are included. The number quoted for the inclusive Z/γ
∗process (also referred to in the text as the Drell-Yan process) is for generated dilepton invariant masses greater than 10 GeV. Kinematic criteria are also applied in the generation of W( → `ν)γ and W( → `ν)γ
∗( → `
0`
0) events. For Wγ events, the photon must have p
T> 8 GeV and be separated from the charged lepton by ∆ R = p
(∆ η
2) + (∆ φ
2) > 0.25. For Wγ
∗, at least two leptons have p
Tlarger than 5 GeV and |η| < 3 for the ee and µµ case, and |η| < 5 for the ττ case and a lower invariant mass cut of m
``> 2m
eis also applied. Interference between the Z
(∗)and the γ
∗is included for WZ
(∗)and Wγ
∗, and the boundary between the samples is at m
``= 7 GeV. For WZ
(∗)a dilepton filter requiring at least two charged leptons with p
T> 5 GeV and |η| < 2.8 is also applied.
The Z
(∗)Z
(∗)→ 4` samples are generated with an invariant mass cut of m
``> 4 GeV. Leptonic decays of W /Z bosons are always assumed, with the exception of the W H/ZH processes which also include semi-leptonic decays. The quoted cross sections include the branching ratios and are summed over lepton flavours. The exception is top quark production, for which inclusive cross sections are quoted.
Process Generator σ · B (pb)
ggF POWHEG [39]+PYTHIA8 [36] 0.441
VBF POWHEG [40] + PYTHIA8 35 · 10
−3W H/ZH PYTHIA8 127 · 10
−3q q/g ¯ → WW POWHEG + PYTHIA8 5.68
gg → WW GG2WW [41] + HERWIG [42] 0.16
t t ¯ MC@NLO [43] + HERWIG 238.1
tW/tb MC@NLO [43] + HERWIG 28
tqb AcerMC [44] + PYTHIA [35] 88
inclusive W ALPGEN [45]+HERWIG 37 · 10
3inclusive Z/γ
∗ALPGEN [45] + HERWIG 16 · 10
3Z
(∗)Z
(∗)→ 4l POWHEG + PYTHIA8 0.73 W(Z/γ
∗)(m
(Z/γ∗)> 7 GeV) POWHEG+PYTHIA8 0.825 W(Z/γ
∗)(m
(Z/γ∗)< 7 GeV) MADGRAPH [46, 47, 48] + PYTHIA 11.0
Wγ ALPGEN [45] + HERWIG 369
HERWIG [42] is used for the hadronisation and parton showering the underlying event is modelled using JIMMY [49]. The MLM matching scheme [50] is used for the description of the W +jets, Z/γ
∗+jets and Wγ processes. The cross sections for the Wγ and Wγ
∗/WZ
(∗)processes are normalised to the MCFM [51] NLO predictions. These normalisation factors (K-factors) are calculated to be 1.15 for Wγ and 2.01 for Wγ
∗. The K-factor for Wγ
∗is calculated for the phase space criteria m
``< 7 GeV, p
leadT> 25 GeV, p
subleadT> 15 GeV, and |η
`| < 2.5, where p
leadTand p
subleadTrefer to the transverse momenta of the leading and subleading leptons, respectively.
The CT10 parton distribution function (PDF) set [52] is used for the POWHEG and MC@NLO
samples, and CTEQ6L1 [53] is used for the ALPGEN, MadGraph, and PYTHIA8 samples. Ac-
ceptances and e ffi ciencies are obtained from a full simulation [54] of the ATLAS detector using
GEANT4 [55]. The simulation incorporates a model of the pile-up conditions in the 2012 data, in-
cluding both the effects of multiple pp collisions in the same bunch crossing (“in-time” pile-up) and
in nearby bunch crossings (“out-of-time” pile-up).
3 Event selection
Events are required to have a primary vertex consistent with the beam spot position, with at least three associated tracks with p
T> 400 MeV. Data quality criteria are applied to events in order to suppress non-collision backgrounds such as cosmic-ray muons, beam-related backgrounds, or noise in the calorimeters.
H→ WW
(∗)→ `ν`ν candidates (with ` = e, µ) are pre-selected by requiring exactly two oppositely charged leptons of di ff erent flavours, with p
Tthresholds of 25 GeV and 15 GeV for the leading and sub-leading lepton, respectively. Events are classified into two exclusive lepton channels depending on the flavour of the leading lepton: in the following, eµ (µe) will refer to events with a leading electron (muon). The dilepton invariant mass is required to be greater than 10 GeV. For muons, the range |η| < 2.5 is used; for electrons, the range |η| < 2.47 is used, with the region 1.37 < |η| < 1.52, corresponding to the boundary between barrel and end-cap calorimeters, excluded.
Electron candidates are selected by applying a set of tight identification criteria using a combi- nation of tracking and calorimetric information. The fine lateral and longitudinal segmentation of the calorimeter and transition radiation capability of the ATLAS detector have allowed the previous levels of electron performance [56] to be retained in the increased pile-up environment of the 2012 data taking. Muon candidates are identified by matching tracks reconstructed in the inner detector and in the muon spectrometer [57]. Requirements on the number of hits in all three components of the inner detector (pixels, SCT, and TRT) provide background rejection, particularly against pion / kaon decays-in-flight.
At least one of the selected leptons is required to match a triggering object. Leptons from heavy- flavour decays and jets satisfying the lepton identification criteria are suppressed by requiring the leptons to be isolated: the scalar sum of the p
Tof charged particles and of the calorimeter energy deposits within ∆ R = p
∆ φ
2+ ∆ η
2of 0.2 − 0.3 of the lepton direction (excluding the lepton itself) are each required to be less than 0.12 − 0.20 times the lepton p
T. The exact values of the cone size and the isolation requirement itself di ff er between the track- and calorimeter-based criteria, electrons and muons, and depend on the lepton p
T. Impact parameter requirements are imposed on the leptons;
only leptons originating close to the primary vertex are selected.
Drell-Yan and multijet events are suppressed by requiring large E
Tmiss[58]. The E
Tmissis the mag- nitude of E
missT, the opposite of the vector sum of the transverse energy of the reconstructed ob- jects, including muons, electrons, photons, jets, and clusters of calorimeter cells not associated with these objects. The quantity E
T,relmissused in this analysis is defined as: E
T,relmiss= E
missTsin ∆ φ
min, with
∆ φ
min≡ min( ∆ φ,
π2). Here, ∆ φ is the minimum azimuthal angle between E
missTand the leading lepton, the sub-leading lepton or any jet with p
T> 25 GeV. Compared to E
missT, the use of E
T,relmissincreases the rejection of events with significant mismeasurement of a jet or a lepton, since in such events the direction in φ of the E
missTis correlated with the direction of the mismeasured object.
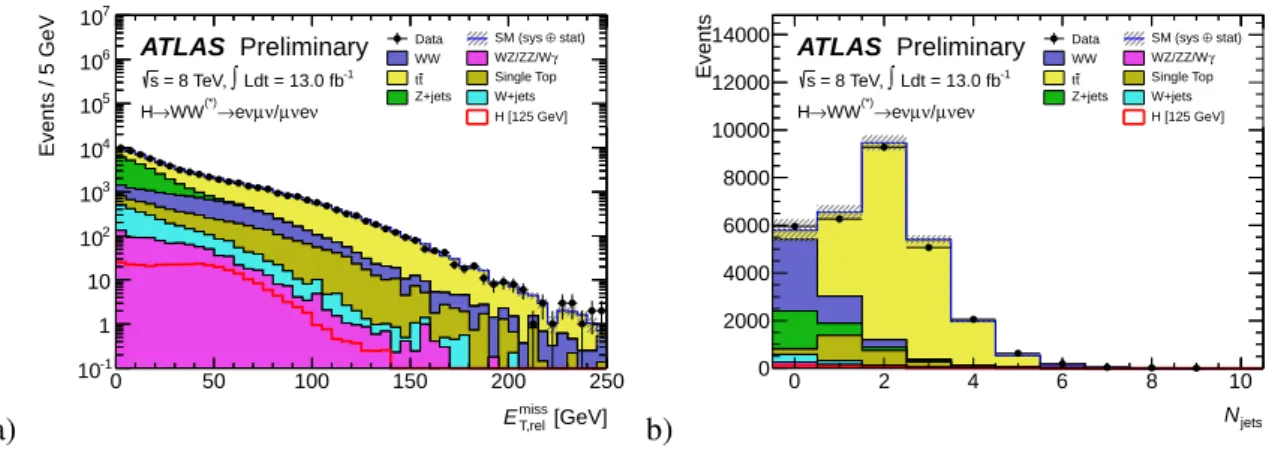
Figure 1a shows the distribution of E
missT,relin dilepton events passing all of the selection above, up to but not including the E
missT,relthreshold. The threshold applied in this analysis is 25 GeV. After the lepton isolation and E
missT,relrequirements, the multijet background is negligible and the Drell-Yan background is much reduced. Any multijet background present at this stage is included in the W + jets background estimate.
Figure 1b shows the multiplicity distribution of jets reconstructed using the anti-k
talgorithm [59],
with distance parameter R = 0.4, for all events satisfying the pre-selection criteria described above
a)
ET,relmiss [GeV]0 50 100 150 200 250
Events / 5 GeV
10-1
1 10 102
103
104
105
106
107
Data SM (sys ⊕ stat)
WW WZ/ZZ/Wγ
t
t Single Top
Z+jets W+jets H [125 GeV]
ATLAS Preliminary
Ldt = 13.0 fb-1
∫
= 8 TeV, s
ν νe µ ν/ µ ν
→e WW(*)
→ H
b)
Njets0 2 4 6 8 10
Events
0 2000 4000 6000 8000 10000 12000
14000 Data SM (sys ⊕ stat)
WW WZ/ZZ/Wγ
t
t Single Top
Z+jets W+jets H [125 GeV]
ATLAS Preliminary
Ldt = 13.0 fb-1
∫
= 8 TeV, s
ν νe µ ν/ µ ν
→e WW(*)
→ H
Figure 1: E
T,relmiss(left) and multiplicity of jets (right) for events satisfying the pre-selection criteria described in the text. No E
missT,relrequirement is applied in the E
T,relmissdistribution. Jets are required to fulfil p
T> 25 GeV for |η| < 2.5 and p
T> 30 GeV for 2.5 < |η| < 4.5 . The lepton channels are combined. The hashed area indicates the total uncertainty on the background prediction. The WW and top backgrounds are scaled to use the normalisation derived from the corresponding control regions described in the text. The expected signal for a SM Higgs boson with m
H= 125 GeV is superimposed.
including the E
missT,relrequirement. Only jets with p
T> 25 GeV and |η| < 4.5 are considered. The jet p
Tthreshold is increased to 30 GeV in the forward region 2.5 < |η| < 4.5 to reduce the contribution from jets produced by pile-up. In order to reject such jets that are produced in the central part of the detector, a selection criterion is applied to each jet with |η| < 2.5 on a quantity called the jet vertex fraction (JVF). The JVF is defined, using the charged particle tracks associated with a given jet, to be the p
Tsum of the tracks originating from the primary vertex divided by the p
Tsum of all of the tracks.
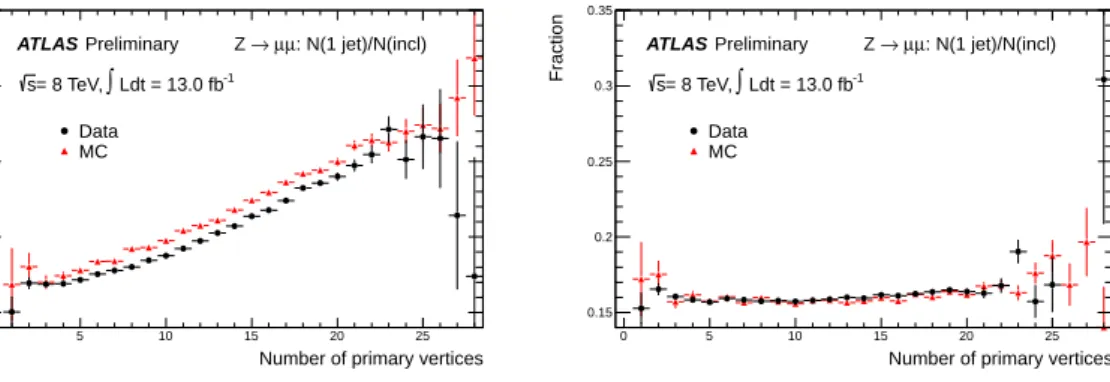
Jets are required to have | JVF | > 0.5. This selection was found to be robust against pile-up, based on studies of the dependence of the jet multiplicity on the number of reconstructed vertices in the 2012 Z + jet data. Figure 2 shows the ratio of Z → µµ + 1-jet events to all Z → µµ events as a function of the number of reconstructed primary vertices, with and without applying the JVF requirement. The events are selected by applying the pre-selection criteria (excluding the E
missT,relrequirement) with two muons and an additional requirement on the invariant mass (|m
µµ− m
Z| < 15 GeV) in order to select Z events.
No significant dependence is seen with the jet selection described above when the JVF requirement is applied, while a clear slope is seen if the JVF requirement is removed.
The background rate and composition depend significantly on the jet multiplicity, as does the signal production mechanism. Without accompanying jets, the signal originates almost entirely from the ggF process and the background is dominated by WW events. In contrast, when produced in association with two or more jets, the signal contains a much larger contribution from the VBF process and the background is dominated by t¯ t production. In this note only the zero and one jet analyses, which are most sensitive to a ggF signal, are presented. To further maximise the sensitivity, different selection criteria for events with zero and one accompanying jets passing the jet requirements defined above, are applied to the pre-selected sample. The di ff erent requirements for the H + 0-jet and H + 1-jet channels are described in more detail below.
Due to spin correlations in the WW
(∗)system arising from the spin-0 nature of the SM Higgs
boson and the V-A structure of the W boson decay, the charged leptons tend to emerge from the
interaction pointing in the same direction. This kinematic feature is exploited for both jet multiplicities
by requiring that the dilepton invariant mass, m
``, be less than 50 GeV and that the azimuthal angular
Number of primary vertices
0 5 10 15 20 25
Fraction
0.15 0.2 0.25 0.3 0.35
ATLAS Preliminary Z →µµ: N(1 jet)/N(incl) Ldt = 13.0 fb-1
∫
= 8 TeV, s
Data MC
Number of primary vertices
0 5 10 15 20 25
Fraction
0.15 0.2 0.25 0.3 0.35
ATLAS Preliminary Z →µµ: N(1 jet)/N(incl) Ldt = 13.0 fb-1
∫
= 8 TeV, s
Data MC
Figure 2: Fraction of Z → µµ + 1-jet events to all Z → µµ candidates as a function of the number of reconstructed primary vertices in the event. The selected events must pass the pre-selection criteria, excluding the E
missT,relrequirement, without any JVF requirement applied (left) and with the |JVF| > 0.5 requirement applied (right). Only statistical uncertainties are included.
difference between the leptons, ∆ φ
``, be less than 1.8 radians.
In the H + 0-jet channel, the magnitude p
``Tof the transverse momentum of the dilepton system, p
``T= p
`1T+ p
`2T, is required to be greater than 30 GeV. In addition, the opening angle between the dilepton system and the transverse missing energy is required to be larger than π/2 to remove potential pathological events in which the E
missTis pointing in the direction of the lepton pair. This improves the rejection of the Drell-Yan background.
In the H + 1-jet channel, backgrounds from top quark decays are suppressed by rejecting events containing a jet identified as being consistent with originating from the decay of a b or c quark (b- tagged jet), using a b-tagging algorithm based on a neural network that exploits the topology of weak decays of b- and c-hadrons [60]. The algorithm is tuned to achieve an 85% b-jet identification effi- ciency in an inclusive sample of simulated t¯ t events while yielding a light-jet tagging rate of approx- imately 11% [61]. Approximately 74% of top events are rejected by this requirement at this stage of the selection.
The ττ invariant mass, m
ττ, is computed under the assumption that the reconstructed leptons are τ lepton decay products, that the neutrinos produced in the τ decays are collinear with the leptons [62], and that they are the only source of E
missT. Events with |m
ττ− m
Z| < 25 GeV are rejected if the energy fractions carried by the visible decay products are positive (the collinear approximation does not always yield physical solutions).
In the H→ WW
(∗)→ `ν`ν analysis with 5.8 fb
−1, reported in Ref. [10], a requirement that the total transverse momentum, p
totT, must be smaller than 30 GeV was imposed to suppress top background events that have additional jets with p
Tbelow threshold. Further study showed that this requirement reduces the signal strength measurement precision for m
H= 125 GeV, so it is not used.
A transverse mass variable, m
T, is used in this analysis to test for the presence of a signal for both jet multiplicities. This variable is defined as:
m
T= q
(E
T``+ E
Tmiss)
2− |p
``T+ E
missT|
2, where E
``T= q
|p
``T|
2+ m
2``. The statistical analysis uses a fit to the m
Tshape in the signal region
data after the ∆ φ
``requirement (see Section 6). The signal sensitivity for a SM Higgs boson mass
hypothesis m
Hcan also be enhanced by selecting events with m
Tin the range 0.75 m
H< m
T< m
H,
and this additional selection is used later in this document to illustrate the background model and the observed excess. The expected signal-to-background ratios after this selection for a SM Higgs boson with m
H= 125 GeV are about 0.14 and 0.16 for the H + 0-jet and H + 1-jet selections, respectively.
4 Background normalisation and control samples
For the H + 0-jet and H + 1-jet analyses, the leading backgrounds from SM processes producing two isolated high-p
Tleptons are WW and top quark production. In this note, “top background” always includes both t¯ t and single top (tW , tb and tqb), unless explicitly stated otherwise. The contributions from WW and top quark processes, as well as the smaller but significant Z/γ
∗→ ττ background, are normalised to observed rates in data in control regions dominated by the relevant background source.
The W +jets background is fully estimated from data. The shapes and normalisation of back- grounds from diboson processes other than WW are estimated using simulation. The simulation pre- dictions for these backgrounds are however cross-checked, together with the W +jets data-driven esti- mation, in a selection in which the two lepton candidates are required to have the same charge. This
“validation region” distinguishes from the “control regions”, which are used to directly normalise the corresponding backgrounds.
The control and validation regions are defined by selections similar to those used in the signal region but with some criteria reversed or modified to obtain signal-depleted samples enriched in a particular background. The WW background in both the H + 0-jet and H + 1-jet analyses and the top background in the H + 1-jet analysis are normalised to the data yields in the corresponding control regions, after subtracting contributions from processes other than the targeted one. The resulting estimated event yield for that process is extrapolated from the control region to the signal region using the ratio of event yields in the simulation. Using only a ratio of event yields from the simulation rather than the absolute prediction reduces the sensitivity of the background predictions to the systematic uncertainties, which are detailed in Section 5.
The correlations introduced among the backgrounds by the presence of other processes in the con- trol regions are fully incorporated in the profile likelihood used to test the background-only hypothesis and extract the signal strength (see Section 6). In the following, each background estimate is described after any others on which it depends. Because of this, the largest background (WW ) is described last.
4.1 W + jets estimation and the same-charge validation sample
The W +jets background contribution is estimated using a control sample of events in which one of
the two leptons satisfies the identification and isolation criteria described in Section 3, and the other
lepton (denoted “anti-identified”) fails these criteria but satisfies a loosened selection. Anti-identified
electrons satisfy loosened isolation requirements and must fail at least one electron identification
requirement, which may be on the shower shapes or track quality. Anti-identified muons satisfy
loosened isolation and impact parameter requirements and must fail at least one muon identification
requirement related to the track quality. Otherwise, events in this sample are required to pass all of
the signal selection requirements. The dominant contribution to this background comes from W + jets
events in which a jet produces an object which is reconstructed as a lepton. This object may be either
a true electron or muon from the decay of a heavy quark, or else, primarily in the case of electrons,
a product of the fragmentation incorrectly reconstructed as an isolated electron candidate (electrons
from photon conversions or charged hadrons). The fraction of W + jets events in the control region is
about 90% in the electron channel and 80% in the muon channel.
[GeV]
mT
50 100 150 200 250 300
Events / 10 GeV
0 10 20 30 40 50
60 Data SM (sys ⊕ stat)
WW WZ/ZZ/Wγ
t
t Single Top
Z+jets W+jets H [125 GeV]
ATLAS Preliminary
Ldt = 13.0 fb-1
∫
= 8 TeV, s
(0 jets) ν νe µ ν/ µ ν
→e WW(*)
→ H
[rad]
φll
∆
0 0.5 1 1.5 2 2.5 3
Events / 0.13 rad
0 5 10 15 20 25 30
35 Data
stat)
⊕ SM (sys
WW WZ/ZZ/Wγ
t
t Single Top
Z+jets W+jets H [125 GeV]
ATLAS Preliminary
Ldt = 13.0 fb-1
∫
= 8 TeV, s
(0 jets) ν νe µ ν/ µ ν
→e WW(*)
→ H
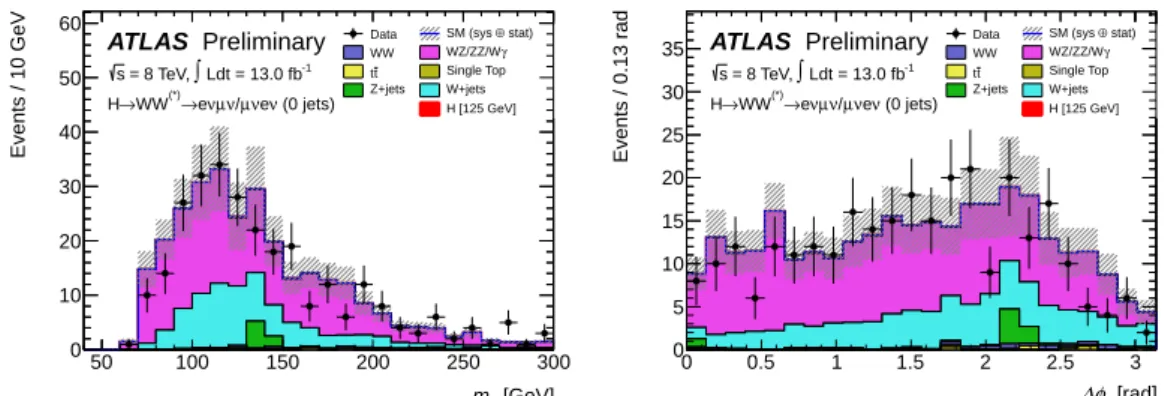
Figure 3: Distribution of m
T(left) and ∆ φ
``(right) in the same-charge validation region in the zero jet sample after the p
``Trequirements. The lepton flavours are combined. The negligible signal shown is for m
H= 125 GeV. The hashed area indicates the total uncertainty on the background prediction.
The W + jets background in the signal region is obtained by scaling the number of events in the data control sample by a “fake factor”. The fake factor is defined as the ratio of the number of fully identified lepton candidates passing all selections to the number that are anti-identified. It is estimated as a function of the anti-identified lepton p
Tusing an inclusive dijet data sample, after subtracting the residual contributions from leptons produced by leptonic W and Z decays. The remaining lepton contamination, which includes Wγ and Wγ
∗/WZ
(∗)events, is subtracted using MC simulation.
The fake factor uncertainty is the main uncertainty on the W + jets background contribution. It is dominated by differences in jet composition between dijet and W +jets samples as observed in MC simulation, accounting also for differences between the heavy-flavour (b and c quark) content of the simulated W + jets events and what has been measured in data. The total systematic uncertainty on the fake factor also includes smaller contributions originating from trigger effects and the subtraction of the contamination from leptonic W and Z decays. The total relative uncertainty on this background is approximately 50% for mis-identified electrons and muons.
The processes producing the majority of same-charge dilepton events, W +jets, Wγ
(∗), WZ
(∗), and Z
(∗)Z
(∗)are all backgrounds to H→ WW
(∗)→ `ν`ν. W +jets and Wγ
(∗)are particularly important for the analysis optimised for a low Higgs boson mass hypothesis, because the lepton kinematics resem- ble those of the signal. Therefore the normalisation and kinematic features of same-charge dilepton events are used to validate the estimation of these backgrounds based on simulation. The diboson backgrounds aside from WW , listed above, are estimated using simulation to model the acceptance, with the normalisation taken from the calculated cross sections described in Section 2. The total sys- tematic uncertainty on the sum of the non-WW diboson backgrounds is 16% for the H + 0-jet analysis and 23% for the H + 1-jet analysis. The W + jets background is estimated from data as described above. The predicted and observed numbers of events and distributions in the same-charge dilepton sample agree well overall within the uncertainties, which are substantial due to limited data statistics and the large systematic uncertainties on the contributing backgrounds, particularly W + jets. As an example, the m
Tand ∆ φ
``distributions of same-charge zero-jet events passing the pre-selection and the ∆ φ
``,METand p
``Trequirements, are shown in Fig. 3.
The Wγ background arises from the photon converting into a electron-positron pair, while the W
decay provides the muon and the E
missTsignatures. The simulation of the Wγ background is tested in a
modified same-charge validation region in which the electron criteria that remove photon conversions
are reversed. In this region, a high Wγ purity is obtained (approximately 80%). The number of
observed events are 202 and 228 for the H + 0-jet and H + 1-jet Wγ validation regions, which can be compared with the expected 228 ± 9 (stat) and 221 ± 9 (stat) events, respectively. The final estimate is taken from MC simulation since there are insu ffi cient data in the Wγ validation region to derive an accurate normalisation, but the agreement between data and MC is within the statistical uncertainty.
4.2 Z/γ
∗→ ττ control sample
The Z/γ
∗→ ττ background is a small background in the signal region. It is completely negligible in the H + 0-jet channel and contributes approximately 10% of the background in the H + 1-jet channel. The contribution from Z/γ
∗→ ττ events is however dominant in a control region defined by m
``< 80 GeV and ∆ φ
``> 2.8 in addition to the pre-selection. Events without an accompanying jet are used to derive the H + 0-jet rate in data, while events with one or more jets define the H + 1-jet Z/γ
∗→ ττ control region. Purities of about 90% and 70% are reached for the zero jet and jet inclusive control regions, respectively. Contamination from other backgrounds is subtracted from the data, using simulation and data-driven W + jets estimate.
The normalisation factors, used to scale the prediction from simulation, are obtained from the ratio of the number of events in data, with backgrounds not originating from Z/γ
∗subtracted, and the number of events in Z/γ
∗→ ττ MC. These normalisation factors are 0.87 ± 0.03 (stat) for the zero jet channel and 0.85 ± 0.03 (stat) for the one jet channel. The systematic uncertainties on these ratios are defined as the difference with unity, which amounts to 15% and 18%, respectively. The total uncertainty on the Z/γ
∗→ ττ estimate in the H + 0-jet signal region is dominated by the large statistical uncertainty of the MC sample, see Table 4. The total uncertainties on the Z/γ
∗→ ττ background in the H + 0-jet and H + 1-jet analyses, including the systematic and statistical components, are about 100% and 42%, respectively.
4.3 Top-quark control sample
The number of background events from top quark production in the H + 0-jet signal region is nor- malised to the number of events satisfying the pre-selection criteria described in Section 3, namely, the selection up to but not including the jet multiplicity requirements. This sample is dominated by top quark events, as shown in Fig. 1. The small contribution of non-top backgrounds to this sample is esti- mated from simulation, except for the W +jets contribution, which is estimated from data. The fraction f
0−jetMCof top quark events in the pre-selected sample that pass the jet veto is initially estimated in simu- lation. The estimated fraction is corrected using kinematic information from a control sample defined by the requirement of a b-tagged jet in addition to the dilepton and E
T,relmissselection. Specifically, the correction uses the probability P
b−tag1for an event in the control sample to have no jets reconstructed in addition to the one that is tagged. Because b-tagging selects a nearly pure sample of top quark events, P
b−tag1can be calculated in both data and simulation. Then f
0−jetdatais estimated by multiplying f
0−jetMCby the ratio (P
b1−tag,data)
2/(P
b1−tag,MC)
2, exploiting the stability of the ratio f
0−jet/(P
b1−tag)
2with respect to experimental uncertainties and, to a lesser extent, assumptions about top quark event kinematics [63].
The efficiency for the remaining requirements on p
``T, m
``, and ∆ φ
``is taken from simulation. The ratio of the resulting prediction to the one from simulation alone is 1.04 ± 0.05 (stat). The total uncer- tainty on the estimate is 14%, which includes both statistical and systematic uncertainties, which are described in Section 5.
In the H + 1-jet analyses, the top background prediction is normalised to the data in a control sam-
ple defined by reversing the b-jet veto and removing the requirements on ∆ φ
``and m
``. The resulting
samples are primarily top quark events, and the small contribution from other sources is accounted
[GeV]
mT
50 100 150 200 250 300
Events / 10 GeV
0 50 100 150 200 250 300 350 400
Data SM (sys ⊕ stat)
WW WZ/ZZ/Wγ
t
t Single Top
Z+jets W+jets H [125 GeV]
ATLAS Preliminary
Ldt = 13.0 fb-1
∫
= 8 TeV, s
(1 jet) ν νe µ ν/ µ ν
→e WW(*)
→ H
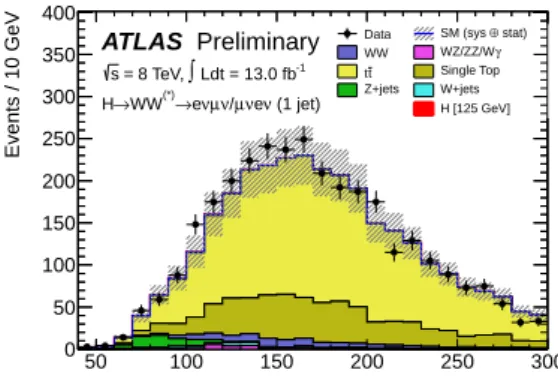
Figure 4: Distributions of the m
Tvariable in the H + 1-jet top background control region, before normalising the simulation to the rate in data. The lepton flavours are combined. The negligible signal shown is for m
H= 125 GeV. The hashed area indicates the total uncertainty on the background prediction.
for using simulation and the data-driven W +jets estimate. The predicted and observed dilepton trans- verse mass distributions of events in these samples are shown in Fig. 4. A good agreement is observed between data and MC for the number of events in the control region (see Table 4). The resulting normalisation factor for the H + 1-jet analysis is 1.03 ± 0.02 (stat) and the total uncertainties on the estimated top quark background in the signal region, including both statistical and systematic e ff ects (which are described in Section 5), is 37%.
4.4 WW control sample
The WW background predictions in the H + 0-jet and H + 1-jet analyses, summed over lepton flavours, are normalised using control regions defined with the same selection as the signal region except that the ∆ φ
``requirement is removed and the upper bound on m
``is replaced with a lower bound, m
``> 80 GeV. Extrapolation from a control region instead of relying on the direct prediction from simulation and the theoretical cross section results in the cancellation of many experimental and the- oretical uncertainties, and in particular the acceptance of the zero and one-jet requirements, which are affected both by the theoretical scale and parton showering uncertainties and by the knowledge of the jet energy scale.
The numbers of events in the WW control regions show significant disagreement with the direct MC predictions, as can be seen in Table 4. The use of control regions is designed to correct for mismodellings in the jet multiplicity, so the analysis is insensitive to this kind of normalisation effect.
The discrepancy seems attributable at least in part to the over-prediction of the jet multiplicity by the current ATLAS implementation and tuning of the showering algorithm in POWHEG + PYTHIA8, resulting in a deficit in the predicted zero-jet yield and a corresponding excess for events with one jet.
Validation of the kinematics, especially m
T, m
lland ∆ φ
ll, in the WW control region demonstrates that
the discrepancy in the jet yield does not a ff ect the WW background extrapolation. As an example,
Figure 5 shows the m
Tshape predicted and observed for events in the WW control regions. The offset
in the normalisation is clearly visible, but the shapes are in satisfactory agreement. Events from WW
contribute about 70% of the total events in the zero jet control region and about 40% for the one jet
control region. Contributions from sources other than WW are derived as they are for the signal region,
including the top and W + jets backgrounds. The resulting WW normalisation factors are 1.13 ± 0.04
[GeV]
mT
50 100 150 200 250 300 350 400 450
Events / 10 GeV
0 50 100 150 200 250
Data SM (sys ⊕ stat)
WW WZ/ZZ/Wγ
t
t Single Top
Z+jets W+jets H [125 GeV]
ATLAS Preliminary
Ldt = 13.0 fb-1
∫
= 8 TeV, s
(0 jets) ν νe µ ν/ µ ν
→e WW(*)
→ H
[GeV]
mT
50 100 150 200 250 300 350 400 450
Events / 10 GeV
0 20 40 60 80 100 120 140
160 Data SM (sys ⊕ stat)
WW WZ/ZZ/Wγ
t
t Single Top
Z+jets W+jets H [125 GeV]
ATLAS Preliminary
Ldt = 13.0 fb-1
∫
= 8 TeV, s
(1 jet) ν νe µ ν/ µ ν
→e WW(*)
→ H
Figure 5: m
Tdistributions in the WW control region in the H + 0-jet (left) and H + 1-jet (right) analyses, before normalising the simulation to the rate in data. The lepton flavours are combined. The negligible signal shown is for m
H= 125 GeV. The top backgrounds are scaled using the normalisation derived from the corresponding control regions described in the text. The hashed area indicates the total uncertainty on the background prediction.
(stat) for the H + 0-jet channel and 0.84 ± 0.08 (stat) for the H + 1-jet channel. The total uncertainty on the predicted WW background in the signal region, including both statistical and systematic e ff ects (which are described in Section 5), is 13% for the H + 0-jet analysis and 54% for the H + 1-jet analysis.
Note that for the H + 1-jet analysis the WW and top background estimates are anti-correlated due to the substantial presence of top quark events in the WW control region and the b-veto and b-tag used to define the WW and top background control regions, respectively.
5 Systematic uncertainties
The systematic uncertainties on the signal yields and cross section can be divided into two categories:
experimental uncertainties such as the those on the jet energy scale and the b-jet tagging efficiency, and theoretical uncertainties such as the estimation of the e ff ect of higher-order terms through variations of the QCD scale inputs to Monte Carlo calculations. Some of these uncertainties are correlated between the signal and background predictions, so the impact of each uncertainty is calculated by varying the parameter in question and coherently recalculating the signal and backgrounds. For the backgrounds normalised using control regions (WW for the H + 0-jet and H + 1-jet analyses and top in the H + 1-jet analysis), the theoretical and experimental uncertainties on the extrapolation are described below and the total uncertainties on these backgrounds, as quoted in Section 4, are summarised at the end of this section.
5.1 Theoretical uncertainties
Theoretical uncertainties on the signal production cross sections include uncertainties on the QCD renormalisation and factorisation scales, on the PDF model used to evaluate the cross section and acceptance, and on the underlying event (U.E.) and parton shower used in the signal model [9]. To evaluate the uncertainties from the QCD factorisation and renormalisation scales, the scales are in- dependently varied up and down by a factor of two. For the ggF signal, the QCD scale uncertainties on the inclusive cross sections for events with ≥ 0, ≥ 1, and ≥ 2 jets are assumed to be independent.
Those uncertainties, calculated for m
H= 125 GeV, are 8%, 20%, and 70%, respectively, and are
converted into uncertainties on the cross sections in exclusive jet multiplicity final states according to the prescription of Refs. [64, 65, 9]. The uncertainties on the inclusive cross sections are shared across the exclusive jet multiplicity categories, and in practice introduce anti-correlations between the predicted signal yield for the zero- and one-jet final states, representing the migration of events between different jet multiplicities. The sum in quadrature of those uncertainties for m
H= 125 GeV amounts to 17% for the H + 0-jet, and 36% for H + 1-jet, final states. The e ff ect of these uncertainties is somewhat diluted for the total signal because of contributions from other production mechanisms with smaller theoretical uncertainties, most significantly the VBF contribution to the H + 1-jet analy- sis. The corresponding uncertainties on the total signal yield are 17% and 30% for the H + 0-jet and H + 1-jet analyses, respectively. The total QCD scale uncertainty on the signal includes an additional contribution of about 4%, corresponding the QCD scale uncertainty on the acceptance alone, which is correlated between the H + 0-jet and H + 1-jet analyses.
PDF uncertainties on the signal cross section and acceptance are evaluated following Refs. [66, 52, 22, 67], using the envelopes of error sets as well as different PDF sets, applied separately to quark- quark, quark-gluon, and gluon-gluon initiated processes. For m
H= 125 GeV, the relative PDF un- certainty is 8% for the ggF process. Uncertainties on the POWHEG+PYTHIA8 modelling of signal processes, particularly the sensitivity to the underlying event and parton shower model, are estimated by comparison to MC@NLO + HERWIG. The resulting uncertainties are 3% for the H + 0-jet signal and 10% for the H + 1-jet signal, anti-correlated between the jet multiplicity bins.
For backgrounds such as WW and top which are evaluated through extrapolation from a signal- depleted control region, theoretical uncertainties are reduced compared to those on the absolute nor- malisation. The extrapolation to the signal region must still be derived from simulation, so some theoretical uncertainties associated with that extrapolation remain. The extrapolation parameters are defined in general as α = N
SR/N
CR, the ratio of the number of events passing the signal region selec- tion to the number passing the control region selection, as evaluated in simulation.
For the case of WW background, extrapolation parameters α
0jWWand α
1jWWare defined for the H + 0-jet and H + 1-jet analyses, respectively. The uncertainties on these parameters are evaluated according to the prescription of Ref. [9]. Four main sources of uncertainty on the normalisation have been considered: QCD renormalisation and factorisation scales, dependence on PDF, dependence on the choice of Monte Carlo generator, and dependence on the underlying event and parton shower model. Scale uncertainties have been computed using the MC@NLO generator by varying the renor- malisation and factorisation scales by a factor of 2 while keeping the ratio between them between 0.5 and 2. PDF uncertainties are calculated as for the signal. Modelling uncertainties have been computed by comparing the MC@NLO, POWHEG, and MCFM extrapolation parameters in a sample with no cut on the number of jets. The underlying event and parton shower uncertainties were evaluated comparing the POWHEG + PYTHIA8, POWHEG + PYTHIA6 and POWHEG + HERWIG predictions.
Both α parameters were found to be positively correlated in all the cases above. The quoted uncertain- ties are summarised in Table 2, and total to 7.2% for the H + 0-jet analysis and 7.5% for the H + 1-jet analysis.
Because the m
Tdistribution is used in the analysis to estimate the signal yield, an additional theo- retical uncertainty is evaluated on the shape of this distribution for the dominant WW background. The uncertainty is computed by comparing the m
Tshape predicted by the MCFM, SHERPA, POWHEG, and MC@NLO + HERWIG generators. The envelope of the distributions from the four generators, which is dominated by the differences between MCFM and MC@NLO, is taken as a relative shape uncertainty around the POWHEG m
Tdistribution. The maximum differences observed are about 10%
and are concentrated at the low end of the m
Tdistribution.
The dominant uncertainties on the top background for the H + 0-jet analysis are the theoretical
Table 2: Scale, PDF, parton-shower / underlying event (PS / UE), and modelling uncertainties on the WW extrapolation parameters α for the NLO qq, gg → WW processes. The errors are taken to be fully correlated between the 0-jet and 1-jet bins.
WW background extrapolation uncertainties Scale PDFs PS/UE Modelling
α
0jWW2.5% 3.7% 4.5% 3.5%
α
1jWW4% 2.9% 4.5% 3.5%
uncertainties on the component derived from MC simulation. These total to 10% and include the effects of QCD scale, initial- and final-state radiation, generator/parton-shower model, the relative normalisation of t¯ t and single top, and the interference between single top and t¯ t, which is neglected when using separate t¯ t and single top Monte Carlo samples. The top background for the H + 1-jet analysis is evaluated by extrapolation from a signal-depleted control region, as is the case for WW , but the associated uncertainty is dominated by experimental uncertainties, to be described in the next section. The theoretical uncertainty on the extrapolation is evaluated by comparison of simulated t¯ t and single top events with different QCD tunings for initial- and final-state radiation and is 8%.
The smaller diboson backgrounds evaluated directly from MC simulation have significant theo- retical uncertainties because calculated cross sections are used for their normalisation. Uncertainties on the Wγ background normalisation are evaluated for each jet bin using the procedure described in Ref. [64], similar to the treatment of the signal. The resulting uncertainty relative to the predicted Wγ background is 11% for the H + 0-jet analysis and 50% for the H + 1-jet analysis, and is the dominant source of uncertainty on this background. For Wγ
∗with m
``< 7 GeV, the MadGraph prediction, which is leading-order only, is scaled by an inclusive K-factor of 2.0 ± 0.2, which corresponds to the di ff erence to the MCFM NLO calculation. In addition, the jet multiplicity distribution from Mad- Graph is reweighted to match the one produced by SHERPA. The resulting additional scalings applied are 0.7 ± 0.1 for H + 0-jet and 1.4 ± 0.3 for H + 1-jet. It was found that for generated MadGraph Wγ
∗events with m
``< 3 MeV, the phase space integrations did not converge. These events were removed from the sample and remaining events reweighted to recover the lost cross section. The full difference between the reweighted prediction and the nominal MadGraph prediction is taken as a systematic un- certainty. PDF and QCD scale uncertainties are evaluated for ZZ
∗and WZ
(∗)with m
``> 7 GeV, and total to about 6%.
5.2 Experimental uncertainties
The experimental uncertainties affect both the expected signal and background yields, and are primar- ily associated with the reconstruction efficiency and energy/momentum scale and resolution for the di ff erent objects (leptons, jets, and E
Tmiss) in the event. The most significant contributions are from the jet energy scale and resolution, and for the H +1-jet analysis, from the b-tagging efficiency. Additional significant experimental uncertainties are the 50% uncertainty on the fake factor used to calculate the W + jets background (see Section 4.1) and the 3.6% uncertainty on the integrated luminosity [68, 69].
The jet energy scale is determined from a combination of test beam, simulation, and in situ mea-
surements. Its uncertainty is split into several independent components: baseline (calorimeter re-
sponse for |η| < 0.8), topologies with close-by jets, di ff erent quark / gluon composition and response,
the b-jet energy scale, impact from in-time and out-of-time event pile-up, and forward jet response
(|η| > 0.8). The jet energy scale uncertainty, for jets with p
T> 25 GeV and |η| < 4.5, varies between 1% to 13% depending on jet p
Tand η. The maximal jet energy scale uncertainty quoted here has increased with respect to Ref. [10] due to the higher average pile-up in the new data. However, the overall impact of these uncertainties has been reduced compared to the previous version of the analy- sis due to the more detailed treatment of the effects of specific sources of uncertainty. The jet energy resolution varies from 5% to 25% as a function of jet p
Tand η, and the relative uncertainty on it, as determined from in situ measurements, ranges from 2% to 5%. The reconstruction, identification, and trigger efficiencies for electrons and muons, as well as their momentum scales and resolutions, are estimated using Z → ``, J/ψ → ``, and W → `ν decays (` = e, µ). With the exception of the uncertainty on the electron selection efficiency, which varies between 2% and 5% as a function of p
Tand η, the resulting uncertainties are all smaller than 1%.
The e ffi ciency of the b-tagging algorithm is calibrated using samples containing muons recon- structed in the vicinity of jets [61]. The resulting uncertainty on the b-jet tagging efficiency varies between 5% and 18% as a function of jet p
T.
Jet energy scale and lepton momentum scale uncertainties are propagated to the E
missTcomputation.
Additional contributions to the E
missTuncertainty arise from jets with p
T< 20 GeV as well as from low-energy calorimeter deposits not associated with reconstructed physics objects [58]; their effect on the total signal and background yields is about 3%.
For all of the backgrounds except W +jets, the analysis uses the predicted m
Tshape from simu- lation in the fit to the m
Tdistribution used to extract the signal yield. The impact of experimental uncertainties on the m
Tshapes for the individual backgrounds and signal are evaluated, and no statis- tically significant dependence is observed for the majority of the experimental uncertainties. Those experimental uncertainties which do produce statistically significant variations of the shape have no appreciable e ff ect on the final results, because the uncertainty on the m
Tshape of the total background is dominated by the uncertainties on the normalisations of the individual backgrounds.
5.3 Uncertainties on backgrounds normalised to control regions
For the backgrounds normalised using control regions (WW for the H +0-jet and H +1-jet analyses and top in the H + 1-jet analysis), the sources of uncertainty can be grouped into four categories: the statis- tical uncertainty, the theoretical and experimental uncertainties on the simulation-based extrapolation from the control region to the signal region, and the uncertainty on the other contributing processes in the control region which must be in effect subtracted from the data yield to get the estimated number of events from the targeted background. These four sources, and the resulting total uncertainty, are summarised in Table 3. The uncertainties on the extrapolation are described above, and the statistical uncertainty is derived from the number of events in the corresponding control region, which can be found in Table 4 in the next section. The uncertainties from the normalisation of other processes in the control region, as represented here, are necessarily approximate because of the correlations among the backgrounds, but the correlations are fully represented in the fit to the data used to extract the results.
6 Results
This section covers in detail the results from the full 8 TeV dataset corresponding to 13.0 fb
−1. These
are subdivided into a discussion of the observed data and expected signal and background rates in
section 6.1, followed by a discussion of the fit results and the quantification of the signal strength in
section 6.2.
Table 3: Summary of the total uncertainties on backgrounds normalised using control regions (WW for the H + 0-jet and H + 1-jet analyses and top in the H + 1-jet analysis). The statistical component (“Stat.”) is from the number of events in the control region, “Theory” and “Expt.” correspond to the theoretical and experimental uncertainties on the extrapolation parameter α derived from simula- tion, and “Crosstalk” refers to the approximate uncertainty on the normalisation of other processes contributing to the control region. The numbers in the “Theory” column for the WW background correspond to the totals from Table 2. Note also that the WW and top backgrounds for the H + 1-jet analysis are anti-correlated through the presence of a b-tag veto/requirement in the corresponding control regions, so that the uncertainties partially cancel in the calculation of the total background uncertainty.
Background Stat. (%) Theory (%) Expt. (%) Crosstalk (%) Total (%)
WW , H + 0-jet 3.3 7.2 1.5 6.2 13
WW , H + 1-jet 9 8 12 34 54
top, H + 1-jet 2 8 29 1 37
6.1 Expected signal and background rates
The expected numbers of signal (m
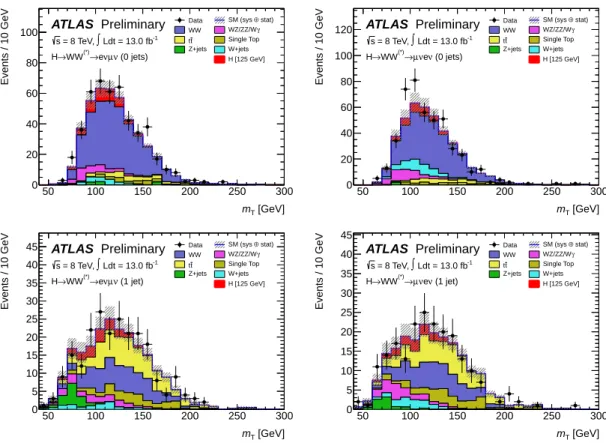
H= 125 GeV) and background events at several stages of the selection are presented in Table 4. The rightmost column shows the observed numbers of events in the data. The uncertainties shown for the various background contributions, as predicted from simulation, include only the statistical uncertainties. After all selection criteria, the dominant background in the H + 0-jet channel comes from continuum WW production, with smaller contributions from top, non-WW diboson, and W +jets events. In the H + 1-jet channel, the WW and top backgrounds are comparable. An excess of events relative to the predicted background is observed in the data. Figure 6 shows the distributions of the transverse mass after all selection criteria in the H + 0-jet and H + 1-jet analyses, for the eµ and µe channels separately.
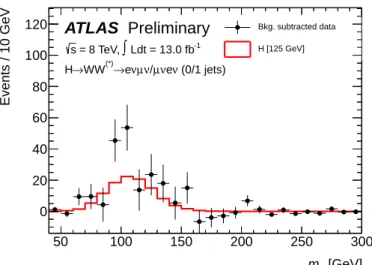
Figure 7 shows the transverse mass distributions in data after all selection criteria have been ap- plied, with the total estimated background subtracted. The H + 0-jet and H + 1-jet channels are summed and the signal predicted for m
H= 125 GeV is superimposed. No systematic uncertainties are included.
Table 5 shows the numbers of events expected from signal and background and observed in data, after application of all selection criteria. To reflect better the sensitivity of the analysis, additional thresholds on m
Thave been applied: 0.75 m
H< m
T< m
H. The results are shown for the eµ and µe channels combined. The uncertainties shown include the systematic uncertainties discussed in Sec- tion 5, and correspond to those entering into the fitting procedure described below, with the exception that the uncertainties on the control-region-derived backgrounds (WW, top in the H + 1-jet analysis) do not include the uncertainty from the subtraction of other processes to the control region. The to- tal uncertainty on the background is calculated accounting for the correlations among the individual backgrounds and includes all contributions.
Table 6 shows the magnitude of the main sources of systematic uncertainty on the signal (m
H=
125 GeV) and background predictions for the H + 0-jet and H + 1-jet analyses. Similarly to Table 5, the
additional m
Tcut is applied and the constraints from control regions are included. The main di ff erence
is that for Table 6, the impact of the uncertainties is shown by source rather than by their impact on
the signal or a particular background. For example, the jet energy scale and resolution affects the
signal and backgrounds in a correlated way, but only its impact on the total signal and background
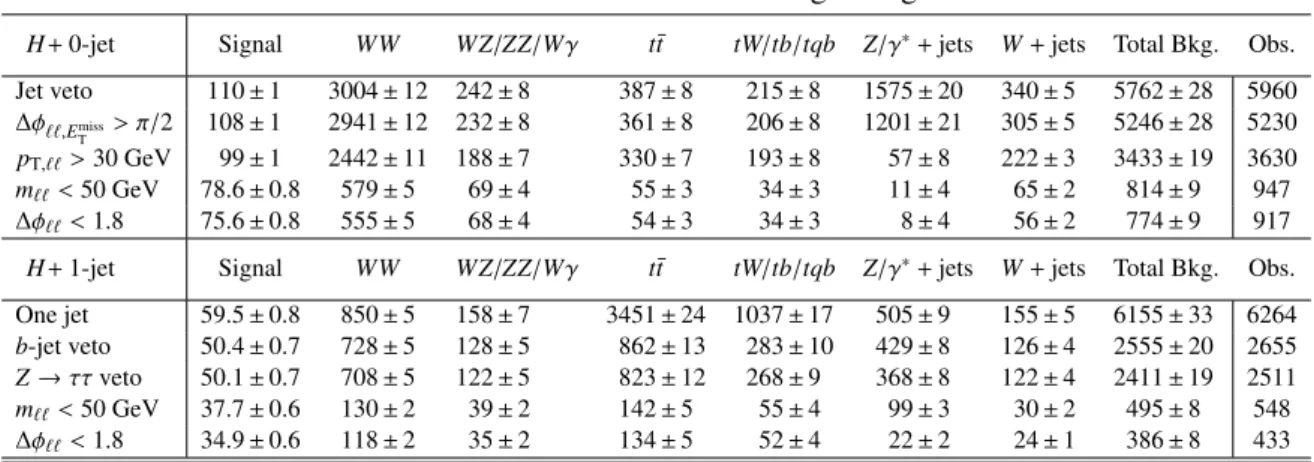
Table 4: The expected numbers of signal and background events after the requirements listed in the first column, as well as the observed numbers of events, are shown for the di ff erent signal regions (upper table) and the main control regions (middle table). The signal is shown for m
H= 125 GeV.
The W +jets background is estimated entirely from data, whereas MC predictions normalised to data in control regions are used for the WW , t¯ t, tW/tb/tqb and Z/γ
∗→ ττ processes in all the stages of the selection. Contributions from other diboson background sources are taken entirely from MC pre- dictions. For the middle table, the W +jets contribution is also estimated entirely from data, however no normalisation factors are applied, except that the top normalisation factor is applied for the top background estimate in the WW control regions. The lower table lists the numbers of expected and observed events after the ∆ φ
``cut, for both 0-jet and 1-jet events and separately depending on the flavour of the leading lepton. Only statistical uncertainties associated with the numbers of events in the MC samples are shown.
Cutflow evolution in the di ff erent signal regions
H+0-jet Signal WW WZ/ZZ/Wγ t¯t tW/tb/tqb Z/γ∗+jets W+jets Total Bkg. Obs.
Jet veto 110±1 3004±12 242±8 387±8 215±8 1575±20 340±5 5762±28 5960
∆φ``,EmissT > π/2 108±1 2941±12 232±8 361±8 206±8 1201±21 305±5 5246±28 5230 pT,``>30 GeV 99±1 2442±11 188±7 330±7 193±8 57±8 222±3 3433±19 3630 m``<50 GeV 78.6±0.8 579±5 69±4 55±3 34±3 11±4 65±2 814±9 947
∆φ``<1.8 75.6±0.8 555±5 68±4 54±3 34±3 8±4 56±2 774±9 917 H+1-jet Signal WW WZ/ZZ/Wγ t¯t tW/tb/tqb Z/γ∗+jets W+jets Total Bkg. Obs.
One jet 59.5±0.8 850±5 158±7 3451±24 1037±17 505±9 155±5 6155±33 6264 b-jet veto 50.4±0.7 728±5 128±5 862±13 283±10 429±8 126±4 2555±20 2655 Z→ττveto 50.1±0.7 708±5 122±5 823±12 268±9 368±8 122±4 2411±19 2511 m``<50 GeV 37.7±0.6 130±2 39±2 142±5 55±4 99±3 30±2 495±8 548
∆φ``<1.8 34.9±0.6 118±2 35±2 134±5 52±4 22±2 24±1 386±8 433
Composition of main control regions
Signal WW WZ/ZZ/Wγ t¯t tW/tb/tqb Z/γ∗+jets W+jets Total Bkg. Obs.
WW0-jet 1.2±0.2 1102±7 71±5 208±6 115±6 13±4 78±2 1587±13 1725 WW1-jet 1.2±0.2 466±4 52±3 492±9 152±7 22±3 51±2 1235±13 1160 Top 1-jet 7.8±0.3 117±2 27±6 2405±20 699±14 55±2 29±3 3332±25 3431
Signal region yield foreµandµechannels separately 0-jeteµ 0-jetµe 1-jeteµ 1-jetµe Total bkg. 392±7 382±6 202±6 184±5 Signal 41.8±0.6 33.8±0.5 18.9±0.4 16.0±0.4
Observed 469 448 226 207