A TLAS-CONF-2012-098 24/09/2012
ATLAS NOTE
ATLAS-CONF-2012-098
August 30, 2012
Observation of an Excess of Events in the Search for the Standard Model Higgs Boson in the H → WW ( ∗ ) → ℓνℓν Channel with the ATLAS
Detector
The ATLAS Collaboration
Abstract
A Standard Model Higgs boson search in the H → WW
(∗)→ eνµν decay mode has been performed using proton-proton collision data corresponding to an integrated lumi- nosity of 5.8 fb
−1at a centre-of-mass energy of 8 TeV collected during 2012 with the ATLAS detector at the Large Hadron Collider. The search focuses on the mass region around 125 GeV, not previously excluded, where an excess of events over the expected background is observed corresponding to a local p
0-value of 6 × 10
−4or 3 . 2 standard deviations. In a combined analysis of the 2012 data with the 4.7 fb
−1of data acquired at
√ s = 7 TeV in 2011, the observed excess in the H → WW
(∗)→ ℓνℓν channel corresponds to a minimum local p
0of 3 × 10
−3or 2.8 standard deviations.
This note has been modified from the original version dated 17 July to correct and improve the presentation. The results of the analysis are unchanged. The systematic uncertainties given in Table 4 were for the expected signal and backgrounds without upper and lower m
Tthresholds, and have been changed to the uncertainties with the m
Tthresholds applied. The systematic uncertainty on the muon fake factor was incorrectly
stated as 60%; it is 40% and has been corrected. The single top and Z → 4ℓ cross
sections have been corrected in Table 1. The uncertainty on the normalisation factor for
the top background in the H+ 2-jet analysis now includes the statistical uncertainty from
the number of events in the control region. The best-fit µ value is quoted at m
H= 126 GeV,
not 125 GeV, for consistency with the published results. Finally, there have been some
small modifications to clarify the text.
1 Introduction
The Standard Model (SM) of particle physics [1–3] has been tested by many experiments over the last four decades and has been shown to successfully describe high energy phenomena. However, the mechanism that breaks electroweak symmetry in the SM still remains to be confirmed experimentally.
This mechanism [4–6], which gives mass to all massive elementary particles, predicts the existence of a scalar particle, the Higgs boson. It is the only elementary particle in the SM that has not yet been observed and the search for the Higgs boson is a centrepiece of the LHC physics programme.
Indirect limits on the Higgs boson mass of m
H< 158 GeV at 95% confidence level (CL) have been set using global fits to precision electroweak results [7]. Direct searches at LEP and the Tevatron have excluded at 95% CL a SM Higgs boson with a mass below 114 . 4 GeV [8] and in the regions 147 GeV < m
H< 180 GeV and 100 GeV < m
H< 103 GeV [9], respectively.
The results of searches in various channels using √
s = 7 TeV data corresponding to an inte- grated luminosity of approximately 5 fb
−1have been reported recently by the ATLAS Collaboration, excluding the mass ranges 112.9 GeV–115.5 GeV, 131 GeV–238 GeV, and 251 GeV–466 GeV [10];
and by the CMS Collaboration, excluding the mass range from 127 GeV to 600 GeV [11]. Due to the narrow region remaining in m
Hafter the exclusions made from the 2011 data, the hypothesis of m
H= 125 GeV is used to characterise the signal for many aspects of the search presented here.
The H → WW
(∗)→ ℓνℓν channel (with ℓ = e, µ) is particularly sensitive in the mass range 120 <
m
H< 200 GeV. This channel can play an important role in the determination of the coupling of the Higgs boson to W bosons. The branching ratio to WW falls off with decreasing m
Hbelow m
H= 2m
Wbut is still just over 20% at m
H= 125 GeV [12], and the dilepton final state allows the selection of events with a favourable signal-to-background ratio. The leading backgrounds are continuum WW → ℓνℓν production and t t ¯ events in which both W bosons decay to ℓν. Additional sources of background include Drell-Yan (pp → Z/γ
∗→ ℓℓ), W+jets, single top, W(Z/γ
(∗)), and ZZ events.
The previous H → WW
(∗)→ ℓνℓν search results reported by the ATLAS collaboration used the full 2011 dataset, corresponding to 4.7 fb
−1of proton-proton (pp) collisions at √
s = 7 TeV, and excluded a SM Higgs boson in the mass range 133 GeV < m
H< 261 GeV at 95% CL [13]. A similar search has been performed by the CMS Collaboration [14]. The analysis described here uses a dataset collected between the beginning of April to the middle of June 2012, which after requiring that all detector components are fully functional, corresponds to 5.8 fb
−1of pp collision data at a centre-of-mass of 8 TeV. The production cross section of a Higgs boson with m
H= 125 GeV increases by about 30%
with the increase of the centre-of-mass energy of the Large Hadron Collider from 7 TeV to 8 TeV. The analysis methodology reported in Ref. [13] is mostly unchanged, but some selection criteria have been modified to reduce background contributions while coping with the higher instantaneous luminosity of the LHC in 2012. In particular, the data are affected by the occurrence of multiple pp collisions per bunch crossing, referred to as “pile-up”. In the 2011 data the average number of interactions per bunch crossing was around 10. In 2012, the average has increased to around 20. This results in significantly larger Drell-Yan background to the same-flavour final states, due to an increased rate of fake missing transverse energy. Since the eµ final state provides the large majority of the sensitivity of the search, only this final state has been used in the analysis reported here. Finally, more stringent isolation criteria are applied, to further reduce the W+ jets background.
Motivated by the 2011 combined Higgs searches [10], the analysis procedure was modified to
blind the kinematic region where a signal might be expected. Events passing the kinematic selection
designed to isolate a signal from a SM Higgs boson with a mass between 110 and 140 GeV were
excluded during the development of the 2012 analysis. The signal region data were unblinded once
the agreement between data and the background model in the control regions corresponding to the
dominant backgrounds was judged to be reasonable.
In the last part of this document, the results obtained at √
s = 8 TeV with 5.8 fb
−1of data are combined with the published H → WW
(∗)→ ℓνℓν results from the 2011 dataset.
2 Data and simulated samples
The data used for this analysis were collected in 2012 using the ATLAS detector, a multi-purpose particle physics experiment with a forward-backward symmetric cylindrical geometry and near 4π coverage in solid angle [15]. ATLAS consists of an inner tracking detector surrounded by a thin su- perconducting solenoid, electromagnetic and hadronic calorimeters, and an external muon spectrom- eter incorporating large superconducting air-core toroid magnets. The combination of these systems provides charged particle measurements together with efficient and precise lepton measurements over the pseudorapidity
1range | η | < 2.5. Jets are reconstructed over the full coverage of the calorimeters,
| η | < 4 . 9; this calorimeter coverage also provides a measurement of the missing transverse momentum E
Tmiss.
The data used for this analysis were collected using inclusive single-muon and single-electron triggers. The two main triggers require the transverse momentum of the lepton with respect to the beam line, p
T, to exceed 24 GeV and that the lepton be isolated: the scalar sum of the p
Tof charged particles within ∆R = p
∆φ
2+ ∆η
2= 0.2 of the lepton direction is required to be less than 0.12 and 0.10 times the lepton p
Tfor the muon and electron, respectively. Because of the detector geometry, the acceptance of the muon trigger is limited to | η | < 2.4. The trigger efficiencies are measured as a function of p
T, η, and data-taking period using Z events. The efficiencies are approximately 90% for electrons, and 90% (70%) for muons in the endcap (barrel).
In this analysis, the signal contributions considered include the dominant gluon fusion production process (gg → H, denoted as ggF), the vector-boson fusion production process (qq
′H, denoted as VBF) and the Higgs-strahlung process (qq
′→ W H, ZH, denoted as W H/ZH). The t¯ tH production mechanism is negligible due to its smaller cross section. For the decay of the Higgs boson, only the H → WW
(∗)→ eνµν mode is considered, including the small contributions from leptonic τ decays.
The branching fraction for this decay as a function of m
His calculated using the P 4 [30, 31]
program, with HDECAY also used in calculating the total width [32].
The signal cross section is computed to next-to-next-to-leading order (NNLO) [33–38] in QCD for the ggF process using the MSTW2008 PDF set [39]. Next-to-leading order (NLO) electroweak (EW) corrections are also applied [40, 41], as well as QCD soft-gluon resummations up to next-to-next-to- leading log (NNLL) [42]. These calculations are detailed in Refs. [43, 44], and assume factorisation between the QCD and EW corrections.
Approximate NNLO QCD corrections [45] and full NLO QCD and EW corrections [46–48] and are used to calculate the cross sections for VBF signal production. The cross sections of the associated W H/ZH production processes are calculated up to NNLO QCD corrections [49, 50] and NLO EW corrections [51].
The Monte Carlo (MC) generators used to model signal and background processes are listed in Table 1. For most processes, separate programs are used to generate the hard scattering process and to model the parton showering, hadronisation, and the underlying event. PYTHIA [28] or PYTHIA8
1ATLAS uses a right-handed coordinate system with its origin at the nominal interaction point (IP) in the centre of the detector, and thez-axis along the beam line. Thex-axis points from the IP to the centre of the LHC ring, and they-axis points upwards. Cylindrical coordinates (r, φ) are used in the transverse plane,φbeing the azimuthal angle around the beam line. The pseudorapidity is defined in terms of the polar angleθasη=−ln tan(θ/2).
Table 1: MC generators used to model the signal and background processes, and the corresponding cross sections at √
s = 8 TeV (given m
H= 125 GeV in the case of the signal processes). The ggF Higgs boson p
Tspectrum in POWHEG [12] is tuned to agree with the prediction from HqT [16].
Finite heavy quark mass effects in the gluon-gluon production are also included [17]. The rele- vant single-top production channels (s-channel and Wt) are included. The number quoted for the inclusive Z/γ
∗process (also referred to in the text as the Drell-Yan process) is for generated dilep- ton invariant masses greater than 10 GeV. Kinematic criteria are also applied in the generation of W( → ℓν)γ events (the photon must have p
T> 8 GeV and be separated from the charged lepton by
∆R = p
(∆η
2) + (∆φ
2) > 0.25) and W( → ℓν)γ
∗( → ℓ
′ℓ
′) events (at least two leptons have p
Tlarger than 5 GeV and | η | < 3 for the ee and µµ case, and | η | < 5 for the ττ case). The Z
(∗)Z
(∗)→ 4ℓ samples are generated with an invariant mass cut of m
ℓℓ> 4 GeV. For the WZ
(∗)and Wγ
∗processes, MAD- GRAPH includes the interference between the Z
(∗)and the γ
∗, and the boundary between the samples is at m
ℓℓ= 7 GeV. For the Wγ
∗a lower invariant mass cut of m
ℓℓ> 2m
eis applied. Leptonic decays of W/Z bosons are always assumed, and the quoted cross sections include the branching ratios and are summed over lepton flavours. The exception is top quark production; for which inclusive cross sections are quoted.
Process Generator m
H(GeV) σ · Br (pb) ggF POWHEG [18]+PYTHIA8 [19] 125 0.441 VBF POWHEG [20]+PYTHIA8 125 35 · 10
−3W H/ZH PYTHIA8 125 25 · 10
−3q¯ q/g → WW MC@NLO [21]+HERWIG [22] 5.68
gg → WW GG2WW [23]+HERWIG 0.16
t¯ t MC@NLO + HERWIG 238
tW /tb MC@NLO+HERWIG 28
tqb AcerMC [24]+PYTHIA 88
inclusive W ALPGEN [25]+HERWIG 37 · 10
3inclusive Z/γ
∗ALPGEN+HERWIG 16 · 10
3Z
(∗)Z
(∗)→ 4l POWHEG+PYTHIA8 0.73
WZ
(∗)MADGRAPH [26, 27]+PYTHIA [28] 1.54
Wγ
∗MADGRAPH [29]+PYTHIA 9.26
Wγ ALPGEN+HERWIG 369
[19] are used for these latter three steps for the signal and some of the background processes. When HERWIG [22] is used for the hadronisation and parton showering the underlying event is modelled using JIMMY [52]. The MLM matching scheme [53] is used for the description of the W+jets, Z/γ
∗+jets and Wγ processes. The cross sections for the Wγ and Wγ
∗/WZ
(∗)processes are normalised to the MCFM [54] NLO predictions. These normalisation factors (K-factors) are calculated to be 1.15 for Wγ, 1.3 for Wγ
∗(m
ℓℓ< 7 GeV) and 1.51 for WZ
(∗)(m
ℓℓ> 7 GeV).
The CT10 parton distribution function (PDF) set [55] is used for the POWHEG and MC@NLO
samples, and CTEQ6L1 [56] is used for the ALPGEN, MadGraph, and PYTHIA8 samples. Ac-
ceptances and efficiencies are obtained from a full simulation [57] of the ATLAS detector using
GEANT4 [58]. The simulation incorporates a model of the pile-up conditions in the 2012 data, in-
cluding both the effects of multiple pp collisions in the same bunch crossing (“in-time” pile-up) and
in nearby bunch crossings (“out-of-time” pile-up).
3 Event selection
Events are required to have a primary vertex consistent with the beam spot position, with at least three associated tracks with p
T> 400 MeV. Data quality criteria are applied to events in order to suppress non-collision backgrounds such as cosmic-ray muons, beam-related backgrounds, or noise in the calorimeters.
H → WW
(∗)→ ℓνℓν candidates (with ℓ = e, µ) are pre-selected by requiring exactly two oppositely charged leptons of di ff erent flavours, with p
Tthresholds of 25 GeV and 15 GeV for the leading and sub-leading lepton, respectively. Events are classified into two exclusive lepton channels depending on the flavour of the leading lepton: in the following, eµ (µe) will refer to events with a leading electron (muon). The dilepton invariant mass is required to be greater than 10 GeV. For muons, the range | η | < 2.5 is used; for electrons, the range | η | < 2.47 is used, with the region 1.37 < | η | < 1.52, corresponding to the boundary between barrel and end-cap calorimeters, excluded.
Electron candidates are selected by applying a set of tight identification criteria using a combi- nation of tracking and calorimetric information. The fine lateral and longitudinal segmentation of the calorimeter and transition radiation capability of the ATLAS detector have allowed the previous levels of electron performance [59] to be retained in the increased pile-up environment of the 2012 data taking. Muon candidates are identified by matching tracks reconstructed in the inner detector and in the muon spectrometer [60]. Requirements on the number of hits in all three components of the inner detector (pixels, SCT, and TRT) provide background rejection, particularly against pion/kaon decays-in-flight.
At least one of the selected leptons is required to match a triggering object. Leptons from heavy- flavour decays and jets satisfying the lepton identification criteria are suppressed by requiring the leptons to be isolated: the scalar sum of the p
Tof charged particles and of the calorimeter energy deposits within ∆R = p
∆φ
2+ ∆η
2= 0.3 of the lepton direction (excluding the lepton itself) are each required to be less than 0.12 − 0.20 times the lepton p
T. The exact value differs between the track- and calorimeter-based criteria, between electrons and muons, and depend on the lepton p
T.
Drell-Yan and QCD multijet events are suppressed by requiring large E
missT[61]. The E
missTis the magnitude of E
missT, the opposite of the vector sum of the transverse momenta of the reconstructed objects, including muons, electrons, photons, jets, and clusters of calorimeter cells not associated with these objects. The quantity E
T,relmissused in this analysis is defined as: E
missT,rel= E
missTsin ∆φ
min, with
∆φ
min≡ min(∆φ,
π2). Here, ∆φ is the minimum azimuthal angle between E
missTand the leading lepton, the sub-leading lepton or any jet with p
T> 25 GeV.
Compared to E
Tmiss, the use of E
T,relmissincreases the rejection of events with significant mismea- surement of a jet or a lepton, since in such events the direction in φ of the E
missTis correlated with the direction of the mismeasured object. Figure 1 shows the distribution of E
missT,relin dilepton events passing all of the selection above, up to but not including the E
missT,relthreshold. The threshold applied in this analysis is 25 GeV. Any multijet background present at this stage is included in the W+jets background estimate. After the lepton isolation and E
missT,relrequirements, the multijet background is negligible and the Drell-Yan background is much reduced. The Drell-Yan contribution becomes neg- ligible after the topological selections, described later in this section, are applied.
Figure 1 shows the multiplicity distribution of jets reconstructed using the anti-k
talgorithm [62], with distance parameter R = 0.4, for all events satisfying the pre-selection criteria described above including the E
T,relmissrequirement. Only jets with p
T> 25 GeV and | η | < 4.5 are considered. The jet p
Tthreshold is increased to 30 GeV in the forward region 2.5 < | η | < 4.5 to reduce the contribution from
jets produced by pile-up. In order to reject jets that are produced in the central part of the detector by
[GeV]
T,rel
Emiss
0 50 100 150 200 250
Events / 5 GeV
10-2
10-1
1 10 102
103
104
105
106 Data BG (sys ⊕ stat)
WW WZ/ZZ/Wγ
t
t Single Top
Z+jets W+jets H [125 GeV]
ATLAS Preliminary
Ldt = 5.8 fb-1
∫
= 8 TeV, s
eν ν /µ ν µ eν
(*)→
→WW H
Njets
0 2 4 6 8 10
Events
0 1000 2000 3000 4000 5000
6000 Data
stat)
⊕ BG (sys
WW WZ/ZZ/Wγ
t
t Single Top
Z+jets W+jets H [125 GeV]
ATLAS Preliminary
Ldt = 5.8 fb-1
∫
= 8 TeV, s
eν ν /µ ν µ eν
(*)→
→WW H
Figure 1: E
T,relmiss(left) and multiplicity of jets (right) for events satisfying the pre-selection criteria described in the text. (No E
missT,relrequirement is applied in the E
missT,reldistribution.) The jet selection applied is p
Tjet> 25 GeV for | η
jet| < 2.5 and p
Tjet> 30 GeV for 2.5 < | η
jet| < 4.5 . The lepton channels are combined. The hashed area indicates the total uncertainty on the background prediction.
The WW and top backgrounds are scaled to use the normalisation derived from the corresponding control regions described in the text. The expected signal for a SM Higgs boson with m
H= 125 GeV is superimposed.
pile-up interactions, a selection criterion is applied to each jet with | η | < 2.5 on a quantity called the jet vertex fraction (JVF). The JVF is defined, using the charged tracks associated with a given jet, to be the p
Tsum of the tracks originating from the primary vertex divided by the p
Tsum of all of the tracks. Jets are required to have JVF > 0.5. This selection was found to be robust against pile-up, based on studies of the dependence of the jet multiplicity on the number of reconstructed vertices in the 2012 Z+jet data. Figure 2 shows the ratio of Z → µµ + 1-jet events to all Z → µµ events as a function of the number of reconstructed primary vertices. The events are selected by applying the pre-selection criteria (excluding the E
missT,relrequirement) with two muons and an additional requirement on the invariant mass ( | m
µµ− m
Z| < 15 GeV) in order to select Z events. No dependence is seen with the jet selection described above.
The background rate and composition depend significantly on the jet multiplicity, as does the sig- nal topology. Without accompanying jets, the signal originates almost entirely from the ggF process and the background is dominated by WW and Drell-Yan events. In contrast, when produced in associ- ation with two or more jets, the signal contains a much larger contribution from the VBF process and the background is dominated by t¯ t production. To maximise the sensitivity, further selection criteria that depend on the jet multiplicity are applied to the pre-selected sample. The data are subdivided into H + 0-jet, H+ 1-jet and H + 2-jet channels according to the jet counting defined above (with the H+ 2-jet channel also including higher jet multiplicities at this stage). The different requirements for these channels are described in more detail below.
Due to spin correlations in the WW
(∗)system arising from the spin-0 nature of the SM Higgs boson
and the V-A structure of the W boson decay, the charged leptons tend to emerge from the interaction
point in the same direction. This kinematic feature is exploited for all jet multiplicities by requiring
that the azimuthal angular difference between the leptons, ∆φ
ℓℓ, be less than 1.8 radians, and that the
dilepton invariant mass, m
ℓℓ, be less than 50 GeV for the H + 0-jet and H + 1-jet channels. For the
H+ 2-jet channel, the m
ℓℓupper bound is increased to 80 GeV. The m
ℓℓdistribution is somewhat harder
Number of vertices
0 5 10 15 20 25
)µµ→ + 1jet)/(Zµµ→(Z
0.1 0.12 0.14 0.16 0.18 0.2 0.22 0.24
Data MC Ldt = 5.8 fb-1
∫
= 8 TeV, s
ATLASPreliminary
Figure 2: Ratio of Z → µµ + 1-jet events to all Z → µµ candidates as a function of the number of reconstructed primary vertices in the event. The selected events must pass the pre-selection criteria, excluding the E
missT,relrequirement, with the additional selection of | m
µµ− m
Z| < 15 GeV. Only statistical uncertainties are included.
for the H + 2-jet topology since the Higgs boson is more strongly boosted, reducing the alignment of the Ws and decorrelating the lepton directions.
In the H + 0-jet channel, the magnitude p
ℓℓTof the transverse momentum of the dilepton system, p
ℓℓT= p
ℓ1T+ p
ℓ2T, is required to be greater than 30 GeV. This improves the rejection of the Drell-Yan background.
In the H + 1-jet channel, backgrounds from top quark decays are suppressed by rejecting events containing a jet identified as being consistent with originating from the decay of a b or c quark (b- tagged jet), using a b-tagging algorithm based on a neural network that exploits the topology of weak decays of b- and c-hadrons [63]. The algorithm is tuned to achieve an 85% b-jet identification ef- ficiency in t t ¯ events while yielding a light-jet tagging rate of approximately 11% [64]. The total transverse momentum, p
totT, defined as the magnitude of the vector sum p
totT= p
ℓ1T+ p
ℓ2T+ p
jT+ E
missT, is required to be smaller than 30 GeV to suppress top background events that have additional jets with p
Tbelow threshold. The ττ invariant mass, m
ττ, is computed under the assumption that the reconstructed leptons are τ lepton decay products, that the neutrinos produced in the τ decays are collinear with the leptons [65], and that they are the only source of E
Tmiss. Events with | m
ττ− m
Z| < 25 GeV are rejected if the energy fractions carried by the putative visible decay products are positive (the collinear approximation does not always yield physical solutions).
The H + 2-jet selection follows the H + 1-jet selection described above (with the p
totTdefinition modified to include all selected jets). In addition, several additional jet-related criteria are applied to the two highest-p
Tjets in the event, referred to as the “tag” jets. The tag jets must be separated in rapidity by a distance | ∆y
jj| of at least 3.8. Events with an additional jet with p
T> 20 GeV in between the tag jets (y
j1< y < y
j2) are vetoed. Finally, the invariant mass of the two tag jets, m
jj, must be at least 500 GeV.
A transverse mass variable, m
T[66], is used in this analysis to test for the presence of a signal for all jet multiplicities. This variable is defined as:
m
T= q
(E
Tℓℓ+ E
Tmiss)
2− | p
ℓℓT+ E
missT|
2, where E
ℓℓT=
q
| p
ℓℓT|
2+ m
2ℓℓ. The statistical analysis of the candidate data uses a fit to the m
Tshape in
the signal region data after the ∆φ
ℓℓrequirement (see Section 6). The signal sensitivity for a SM Higgs
mass hypothesis m
Hcan also be enhanced by selecting events with m
Tin the range 0.75 m
H< m
T<
m
H, and this additional selection is used later in this document to illustrate the background model and the observed excess. The signal-to-background ratios after this selection for a SM Higgs boson with m
H= 125 GeV, with the added m
Trequirement, are about 0.14, 0.19, and 1.0 for the H + 0-jet, H+ 1-jet, and H + 2-jet selections, respectively.
4 Background normalisation and control samples
For the H + 0-jet and H + 1-jet analyses, the leading backgrounds from SM processes producing two isolated high- p
Tleptons are WW and top (in this note, “top” background always includes both t¯ t and single top (tW , tb, and tqb) unless explicitly stated otherwise). These are estimated using partially data-driven techniques based on normalising the MC predictions to the data in control regions dominated by the relevant background source. The W+jets background is fully estimated from data for all jet multiplicities. Only the backgrounds from Drell-Yan, diboson processes other than WW , and the WW background for the H+ 2-jet analysis are estimated using simulation.
The control and validation regions are defined by selections similar to those used in the signal region but with some criteria reversed or modified to obtain signal-depleted samples enriched in a particular background. The control regions for WW and top are used to normalise the corresponding backgrounds in the fit, which helps reduce the sensitivity of the background predictions to the system- atic uncertainties detailed in Section 5. The normalisation and m
Tshape of the W+ jets background are also derived from a control region and extrapolated into the signal region using a “fake factor” defined below. Same-sign dilepton events are produced primarily by the W+jets, Wγ
(∗)/WZ
(∗)and Z
(∗)Z
(∗)processes. These events are thus used as a validation region to check those background predictions.
The term “validation region” distinguishes these regions from the control regions, which are used to directly normalise the corresponding backgrounds.
Some control regions have significant contributions from backgrounds other than the targeted one, which introduces dependencies among the background estimates. These correlations are fully incorporated in the profile likelihood used to test the background-only hypothesis (see Section 6). In the following subsections, each background estimate is described after any others on which it depends.
Because of this, the largest background (WW ) is described last.
4.1 W + jets estimation and the same-sign validation sample
The W+jets background contribution is estimated using a control sample of events in which one of the two leptons satisfies the identification and isolation criteria described in Section 3, and the other lepton (denoted “anti-identified”) fails these criteria but satisfies a loosened selection. Anti-identified electrons satisfy loosened isolation requirements and must fail at least one electron identification requirement, which may be on the shower shape or track quality. For anti-identified muons, the calorimeter isolation requirement is loosened and the track isolation and transverse impact parameter requirements are removed. Further, the muon must not pass all of the muon identification criteria.
Otherwise, events in this sample are required to pass all of the signal selection requirements. The
dominant contribution to this background comes from W+ jets events in which a jet produces an object
which is reconstructed as a lepton. This object may be either a true electron or muon from the decay of
a heavy quark, or else, in the case of electrons, a product of the fragmentation incorrectly reconstructed
as an isolated electron candidate. The purity of W+ jets events in the control region is about 90% in
the electron channel and 70% in the muon channel.
[GeV]
mT
50 100 150 200 250 300
Events / 10 GeV
0 10 20 30 40
50 Data BG (sys ⊕ stat)
WW WZ/ZZ/Wγ
t
t Single Top
Z+jets W+jets H [125 GeV]
ATLAS Preliminary
Ldt = 5.8 fb-1
∫
= 8 TeV, s
+ 0 jets ν νe µ ν/ µ ν
→e WW(*)
→ H
[rad]
φll
∆
0 0.5 1 1.5 2 2.5 3
Events / 0.13 rad
0 5 10 15 20 25 30
35 Data BG (sys ⊕ stat)
WW WZ/ZZ/Wγ
t
t Single Top
Z+jets W+jets H [125 GeV]
ATLAS Preliminary
Ldt = 5.8 fb-1
∫
= 8 TeV, s
+ 0 jets ν νe µ ν/ µ ν
→e WW(*)
→ H
Figure 3: Distribution of m
T(left) and ∆φ
ℓℓ(right) in the same-sign validation region after the E
T,relmissand zero jet requirements. The lepton flavours are combined. The signal shown is for m
H= 125 GeV.
The hashed area indicates the total uncertainty on the background prediction.
The W+jets background in the signal region is obtained by scaling the number of events in the data control sample by a “fake factor”. The fake factor is defined as the ratio of the number of fully iden- tified lepton candidates passing all selections to the number which are anti-identified. It is estimated as a function of the anti-identified lepton p
Tusing an inclusive dijet data sample, after subtracting the residual contributions from leptons produced by leptonic W and Z decays. For this subtraction, the W candidates are identified by requiring the transverse mass m
WT=
q
2 p
ℓTE
missT· (1 − cos ∆φ) to satisfy m
WT> 30 GeV. In this expression, p
ℓTis the lepton transverse momentum and ∆φ is the difference in azimuth between the lepton and E
missTdirections. The Z candidates are identified as two opposite-sign leptons of the same flavour with | m
ℓℓ− m
Z| < 15 GeV, and need to be subtracted as part of the fake factor calculation even though only eµ candidates are selected in the signal region. The remaining lepton contamination, which includes Wγ and Wγ
∗/WZ
(∗)events, is subtracted using MC simulation.
The fake factor uncertainty is the main uncertainty on the W+ jets background contribution. It is dominated by differences in jet composition between dijet and W+jets samples as observed in MC simulation, accounting also for differences between the heavy-flavour (b and c quark) content of the simulated W+ jets events and what has been measured in data. The total systematic uncertainty on the fake factor also includes smaller contributions originating from trigger effects and the subtraction of the contamination from leptonic W and Z decays. The total relative uncertainty on this background is approximately 40% for the electron fakes and 40% for the muon fakes.
The processes producing the majority of same-sign dilepton events, W+jets, Wγ
(∗), WZ
(∗), and Z
(∗)Z
(∗)are all backgrounds to H → WW
(∗)→ ℓνℓν. W+jets and Wγ
(∗)are particularly important for the analysis optimised for a low Higgs boson mass hypothesis. Therefore the normalisation and kinematic features of same-sign dilepton events are used to validate these background predictions.
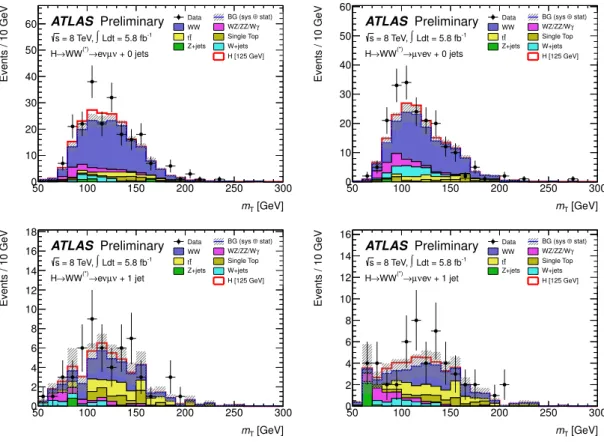
Satisfactory agreement is observed overall, and example distributions, the m
Tand ∆φ
ℓℓdistributions of same-sign zero-jet events passing the preselection requirements, are shown in Fig. 3. The observed number of events is somewhat smaller than the estimated background, although the differences seen are well within the statistical and systematic uncertainties.
The Wγ background arises from the photon converting into a electron-positron pair, while the W
decay provides the muon and the E
missTsignatures. The simulation of the Wγ background is tested in
a modified same-sign validation region in which the electron criteria that remove photon conversions
are reversed. In this region, a high Wγ purity is obtained (approximately 80%). The final estimate is
taken from MC simulation since there are insufficient data in the Wγ validation region to derive an accurate normalisation, but the agreement between data and MC is good within the large statistical uncertainty.
4.2 Top-quark control sample
The number of background events from top quark production in the H + 0-jet signal region is nor- malised to the number of events satisfying the pre-selection criteria described in Section 3, namely, the selection up to but not including the jet multiplicity requirements. This sample is dominated by top quark events, as shown in Fig. 1. The small contribution of non-top backgrounds to this sam- ple is estimated from simulation, except for the W+jets contribution, which is estimated from data.
The fraction f
0MC−jetof top events in the preselected sample which pass the jet veto is initially esti- mated in simulation and then corrected using kinematic information from a second, b-tagged, control sample. Specifically, the correction uses the probability P
b1−tagfor an event in the control sample to have no jets reconstructed in addition to the one that is tagged. Because b-tagging selects a nearly pure sample of top events, P
b1−tagcan be calculated in both data and simulation. Then f
0data−jetis esti- mated by multiplying f
0MC−jetby the ratio (P
b1−tag,data)
2/(P
b1−tag,MC)
2, exploiting the stability of the ratio f
0−jet/(P
b1−tag)
2with respect to experimental uncertainties and, to a lesser extent, assumptions about top event kinematics [67]. The efficiency for the remaining requirements on p
ℓℓT, m
ℓℓ, and ∆φ
ℓℓis taken from simulation. The ratio of the resulting prediction to the one from simulation alone is 1.11 ± 0.06 (stat). The total uncertainty on the estimate is 17%, which includes both statistical and systematic uncertainties, which are described in Section 5.
In the H + 1-jet and H + 2-jet analyses, the top quark background prediction is normalised to the data in a control sample defined by reversing the b-jet veto and removing the requirements on ∆φ
ℓℓand m
ℓℓ. Note that the | ∆y
jj| and m
jjrequirements are included in the definition of the 2-jet control region. The resulting samples are primarily top events, and the small contribution from other sources is accounted for using simulation and the data-driven W+jets estimate. The predicted and observed dilepton transverse mass distributions of events in these samples are shown in Fig. 4. In these plots, a modified 2-jet control region, consisting of all events with two or more jets of which at least one is tagged, is used because there are not enough events in the full control region for a meaningful comparison of event kinematics. Good agreement is observed between data and MC for the numbers of events in the H + 1-jet and H + 2-jet control regions (see Table 2). The resulting normalisation factors are 1.11 ± 0.05 (stat) for the H+ 1-jet analysis and 1.01 ± 0.26 (stat) for the H+ 2-jet analysis.
The total uncertainties on the estimated top-quark background in the H + 1-jet and H + 2-jet signal regions, including both statistical and systematic effects (which are described in Section 5), are 36%
and 70%, respectively.
4.3 WW control sample
The WW background MC predictions in the H + 0-jet and H + 1-jet analyses, summed over lepton
flavours, are normalised using control regions defined with the same selection as the signal region
except that the ∆φ
ℓℓrequirement is removed and the upper bound on m
ℓℓis replaced with a lower
bound, m
ℓℓ> 80 GeV. The numbers of events in the WW control regions in the data agree well
with the MC predictions, as can be seen in Table 2. Figure 5 shows the m
Tshape predicted and
observed for events in the WW control regions. Events from WW contribute about 70% of the total
events in the zero jet control region and about 45% for the one jet control region. Good agreement
[GeV]
mT
50 100 150 200 250 300
Events / 10 GeV
0 20 40 60 80 100 120
Data BG (sys ⊕ stat)
WW WZ/ZZ/Wγ
t
t Single Top
Z+jets W+jets H [125 GeV]
ATLAS Preliminary
Ldt = 5.8 fb-1
∫
= 8 TeV, s
+ 1 jet ν νe µ ν/ µ ν
→e WW(*)
→ H
[GeV]
mT
50 100 150 200 250 300
Events / 10 GeV
100 200 300 400 500 600 700
800 Data BG (sys ⊕ stat)
WW WZ/ZZ/Wγ
t
t Single Top
Z+jets W+jets H [125 GeV]
ATLAS Preliminary
Ldt = 5.8 fb-1
∫
= 8 TeV, s
2 jets
≥ ν + νe µ ν/ µ ν
→e WW(*)
→ H
Figure 4: Distributions of the m
Tvariable in the H + 1-jet (left) H+ 2-jet (right) top control regions.
The lepton flavours are combined. The negligible signal shown is for m
H= 125 GeV. The H + 1-jet top control region is identical to the H + 1-jet signal region except that the veto on a b-tagged jet is reversed. The H + 2-jet top control region used here is defined by the requirement of two or more jets, one of which is b-tagged jet, after the dilepton and E
T,relmisspreselection. It is larger than but contains the sample used to normalise the top background in the H + 2-jet analysis. No data-driven normalisation factors are applied to the simulated data. The hashed area indicates the total uncertainty on the background prediction.
is observed between the predicted and observed distributions. Contributions from sources other than WW are derived as they are for the signal region, including the top and W+jets backgrounds. The resulting WW normalisation factors are 1.06 ± 0.06 (stat) for the H + 0-jet channel and 0.99 ± 0.15 (stat) for the H+ 1-jet channel. The total uncertainty on the predicted WW background in the signal region, including both statistical and systematic effects (which are described in Section 5), is 13%
for the H + 0-jet analysis and 42% for the H + 1-jet analysis. For the H + 2-jet analysis, a signal- depleted region with a sufficient number of WW events to make a statistically accurate estimate of this background cannot be isolated and it is therefore predicted using simulation alone.
5 Systematic uncertainties
Theoretical uncertainties on the signal production cross sections are determined following Refs. [12, 68]. QCD factorisation and renormalisation scales are independently varied up and down by a factor of two. Independent uncertainties on the ggF signal production are assumed for the inclusive cross section and the cross section for production with at least one or two jets. The resulting uncertainties on the cross sections in exclusive jet multiplicity final states are taken into account, as well as anti- correlations caused by migrations between different jet multiplicities. The sum in quadrature of those uncertainties for m
H= 125 GeV amounts to 17% for the H + 0-jet, and 36% for H + 1-jet, final states [12, 68, 69]. The impact of the scale variations on both the VBF signal cross section and the jet veto acceptance, to which the H + 2-jet analysis is mainly sensitive, is 4% [12]. Additional 7%
uncertainties are included to account for the effect of the underlying event modelling on the signal acceptance for VBF signal events after jet tagging and central jet veto cuts. In the H + 2-jet analysis, approximately 25% of the signal events are produced via ggF, with a relative uncertainty of around 25%.
PDF uncertainties are evaluated, following Refs. [39, 55, 70, 71], using the envelopes of error sets
[GeV]
mT
50 100 150 200 250 300 350 400 450
Events / 10 GeV
0 20 40 60 80 100
120 Data BG (sys ⊕ stat)
WW WZ/ZZ/Wγ
t
t Single Top
Z+jets W+jets H [125 GeV]
ATLAS Preliminary
Ldt = 5.8 fb-1
∫
= 8 TeV, s
+ 0 jets ν νe µ ν/ µ ν
→e WW(*)
→ H
[GeV]
mT
50 100 150 200 250 300 350 400 450
Events / 10 GeV
0 5 10 15 20 25 30 35
Data BG (sys ⊕ stat)
WW WZ/ZZ/Wγ
t
t Single Top
Z+jets W+jets H [125 GeV]
ATLAS Preliminary
Ldt = 5.8 fb-1
∫
= 8 TeV, s
+ 1 jet ν νe µ ν/ µ ν
→e WW(*)
→ H
Figure 5: m
Tdistributions in the WW control region in the H +0-jet (left) and H +1-jet (right) analyses.
The lepton flavours are combined. The signal shown is for m
H= 125 GeV. The top backgrounds are scaled using the normalisation derived from the corresponding control regions described in the text.
The hashed area indicates the total uncertainty on the background prediction.
as well as different PDF sets, applied separately to quark-quark, quark-gluon, and gluon-gluon initi- ated processes. For m
H= 125 GeV the relative PDF uncertainty is 8% for the ggF process and 2% for the VBF process. Uncertainties on the modelling of signal processes are estimated by using alterna- tive generators, such as MC@NLO for the acceptance for the ggF process. As described in Section 4, the WW background is normalised to signal-free control regions. The theoretical uncertainty on the extrapolation to the signal region from the control regions has been evaluated according to the pre- scription of [12]. An additional modelling uncertainty is added to take into account differences in the number of extrapolated events obtained with MC@NLO+HERWIG and POWHEG+PYTHIA8.
The uncertainties associated with the underlying event and parton showering are included in the ac- ceptance uncertainty, although they are negligible compared to the scale uncertainties on the cross sections for H+ 0-jet and H + 1-jet.
Uncertainties on the Wγ background normalisation are evaluated for each jet bin using the pro- cedure described in [68]. The uncertainty relative to the predicted Wγ background is 11% for the 0-jet bin and 50% for the 1-jet bin. For Wγ
∗with m
ℓℓ< 7 GeV, a K-factor of 1.3 ± 0.3 is applied to the MadGraph LO prediction based on the comparison with the MCFM NLO calculation. The corresponding K-factor and uncertainty for WZ
(∗)with m
ℓℓ> 7 GeV is 1.51 ± 0.45.
The main experimental uncertainties are related to the jet energy scale, which is determined from a combination of test beam, simulation, and in situ measurements. The uncertainty on the jet energy scale varies from 2% to 9% as a function of jet p
Tand η for jets with p
T> 25 GeV and | η | < 4 . 5 [72].
An additional contribution to the jet energy scale uncertainty arises from pile-up, and is is estimated
to vary between 1% and 5% for in-time pile-up, and up to 10% for out-of-time pile-up. The jet energy
resolution varies from 7% to 22% as a function of jet p
Tand η , and the relative systematic uncer-
tainty on it, determined from in situ measurements, ranges from 17% to 25%. The reconstruction,
identification, and trigger efficiencies for electrons and muons, as well as their momentum scales and
resolutions, are estimated using Z → ℓℓ , J/ψ → ℓℓ , and W → ℓν decays ( ℓ = e, µ ). With the exception
of the uncertainty on the electron selection efficiency, which varies between 2% and 5% as a function
of p
Tand η, the resulting uncertainties are all smaller than 1%. Jet energy scale and lepton momentum
scale uncertainties are propagated to the E
Tmisscomputation. Additional contributions arise from jets
with p
T< 20 GeV as well as from low-energy calorimeter deposits not associated with reconstructed
physics objects [61]; their effect on the total signal and background yields is about 3%. The efficiency
of the b-tagging algorithm is calibrated using samples containing muons reconstructed in the vicinity of jets [64]. The resulting uncertainty on the b-jet tagging efficiency varies between 5% and 18% as a function of jet p
T. The preliminary uncertainty on the integrated luminosity is 3.6%, based on the calibration described in Ref. [73, 74].
For the backgrounds normalised using control regions, the systematic uncertainties are evaluated on the relative normalisation between the backgrounds in the signal and control regions and on the m
Tshape in the signal region. The uncertainty on the top background in the H + 0-jet analysis is dominated by the size of neglected interference effects between t t ¯ and single top and by the impact of the choice of jet thresholds on top event kinematics. Systematic uncertainties are evaluated for the control regions described in Section 4 in the same way as for the signal regions.
In this analysis, a fit to the m
Tdistribution is performed in order to obtain the signal yield for each mass hypothesis. The m
Tshapes for the individual backgrounds and signal do not exhibit a statistically significant dependence on the majority of the theoretical and experimental uncertainties.
The remaining uncertainties that do produce statistically significant variations of the m
Tshape have no appreciable effect on the final results, with the exception of the WW background, where an uncertainty is included to take into account di ff erences in the m
Tshape observed between the MC@NLO and POWHEG generators. However, the uncertainty on the shape of the total background is dominated by the uncertainties on the normalisations of the individual backgrounds.
6 Results
6.1 Results from the 8 TeV data
The expected numbers of signal (m
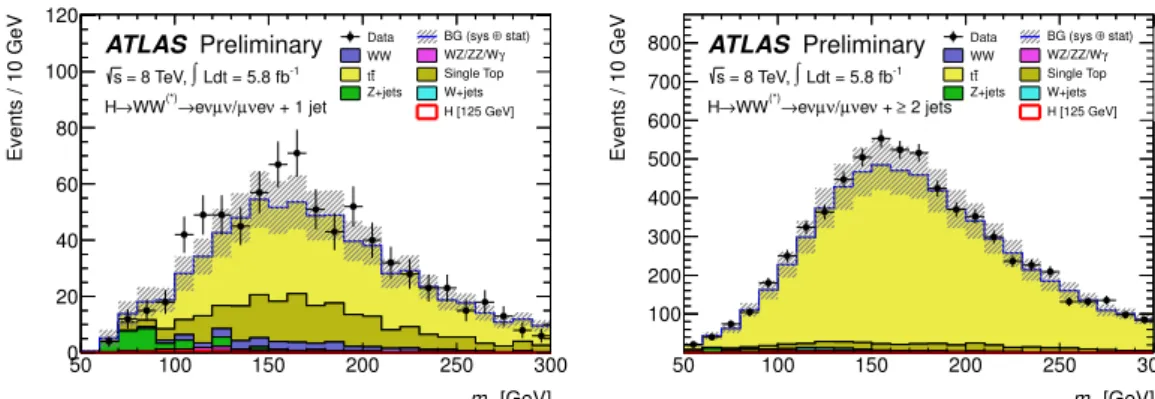
H= 125 GeV) and background events at several stages of the selection are presented in Table 2. The rightmost column shows the observed numbers of events in the data. The uncertainties shown include only the statistical uncertainties on the predictions from simulation. After all selection criteria, the dominant background in the H + 0-jet channel comes from continuum WW production, with smaller contributions from top, non-WW diboson, and W+jets events. In the H+ 1-jet and H+ 2-jet channels, the WW and top backgrounds are comparable. Figure 6 shows the distributions of the transverse mass after all selection criteria in the H+ 0-jet and H+ 1-jet analyses, for both lepton channels combined. No distributions are shown for the H + 2-jet channel because only two events in the data pass all of the selection through the ∆φ
ℓℓrequirement.
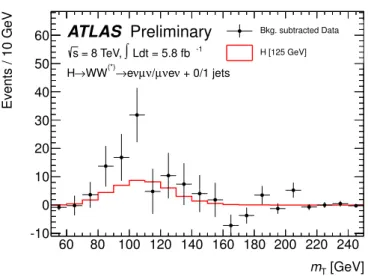
Figure 7 shows the transverse mass distributions in data after all selection criteria have been ap- plied, with the total estimated background subtracted. The H+0-jet and H +1-jet channels are summed and the predicted m
H= 125 GeV signal is superimposed. No systematic uncertainties are included.
Table 3 shows the numbers of events expected from signal and background and observed in data, after application of all selection criteria. To reflect better the sensitivity of the analysis, additional thresholds on m
Thave been applied: 0.75 m
H< m
T< m
Hfor m
H= 125 GeV. The results are shown for the eµ and µe channels combined. The uncertainties shown in Table 3 include the systematic un- certainties discussed in Section 5, constrained by the use of the control regions discussed in Section 4.
The uncertainties are those that enter into the fitting procedure described below. An excess of events relative to the predicted background is observed in the data. Table 4 shows the magnitude of the main sources of systematic uncertainty on the signal (m
H= 125 GeV) and background predictions for the H + 0-jet and H + 1-jet analyses. Similarly to Table 3, the additional m
Tcut is applied and the constraints from control regions are included.
The statistical analysis of the data employs a binned likelihood function L (µ, θ ) constructed as the
product of Poisson probability terms in each lepton flavour channel. The m
H-dependent m
Tthresholds
Table 2: The expected numbers of signal and background events after the requirements listed in the first column, as well as the observed numbers of events. The signal is shown for m
H= 125 GeV.
The W+jets background is estimated entirely from data, whereas MC predictions normalised to data in control regions are used for the WW, t¯ t, and tW/tb/tqb processes in all the stages of the selection.
Contributions from other background sources are taken entirely from MC predictions. The expected numbers of signal and background events, and the observed numbers of events, are shown also in the control regions. For these rows, the W+jets contribution is still taken from the data-driven estimate but no normalisation factors are applied, except that the top normalisation factor is applied for the top background estimate in the WW control regions. The bottom part of the table lists the number of expected and observed events after the ∆φ
ℓℓcut separated by the flavour of the subleading lepton.
Only statistical uncertainties associated with the number of events in the MC samples are shown.
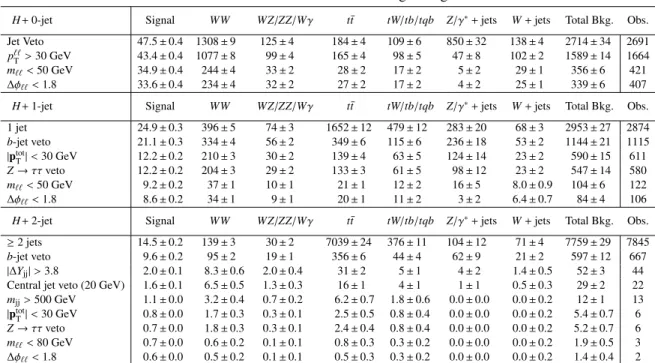
Cutflow evolution in the different signal regions
H+0-jet Signal WW WZ/ZZ/Wγ t¯t tW/tb/tqb Z/γ∗+jets W+jets Total Bkg. Obs.
Jet Veto 47.5±0.4 1308±9 125±4 184±4 109±6 850±32 138±4 2714±34 2691 pℓℓT >30 GeV 43.4±0.4 1077±8 99±4 165±4 98±5 47±8 102±2 1589±14 1664 mℓℓ<50 GeV 34.9±0.4 244±4 33±2 28±2 17±2 5±2 29±1 356±6 421
∆φℓℓ<1.8 33.6±0.4 234±4 32±2 27±2 17±2 4±2 25±1 339±6 407 H+1-jet Signal WW WZ/ZZ/Wγ t¯t tW/tb/tqb Z/γ∗+jets W+jets Total Bkg. Obs.
1 jet 24.9±0.3 396±5 74±3 1652±12 479±12 283±20 68±3 2953±27 2874 b-jet veto 21.1±0.3 334±4 56±2 349±6 115±6 236±18 53±2 1144±21 1115
|ptotT|<30 GeV 12.2±0.2 210±3 30±2 139±4 63±5 124±14 23±2 590±15 611 Z→ττveto 12.2±0.2 204±3 29±2 133±3 61±5 98±12 23±2 547±14 580 mℓℓ<50 GeV 9.2±0.2 37±1 10±1 21±1 12±2 16±5 8.0±0.9 104±6 122
∆φℓℓ<1.8 8.6±0.2 34±1 9±1 20±1 11±2 3±2 6.4±0.7 84±4 106 H+2-jet Signal WW WZ/ZZ/Wγ t¯t tW/tb/tqb Z/γ∗+jets W+jets Total Bkg. Obs.
≥2 jets 14.5±0.2 139±3 30±2 7039±24 376±11 104±12 71±4 7759±29 7845 b-jet veto 9.6±0.2 95±2 19±1 356±6 44±4 62±9 21±2 597±12 667
|∆Yjj|>3.8 2.0±0.1 8.3±0.6 2.0±0.4 31±2 5±1 4±2 1.4±0.5 52±3 44 Central jet veto (20 GeV) 1.6±0.1 6.5±0.5 1.3±0.3 16±1 4±1 1±1 0.5±0.3 29±2 22 mjj>500 GeV 1.1±0.0 3.2±0.4 0.7±0.2 6.2±0.7 1.8±0.6 0.0±0.0 0.0±0.2 12±1 13
|ptotT|<30 GeV 0.8±0.0 1.7±0.3 0.3±0.1 2.5±0.5 0.8±0.4 0.0±0.0 0.0±0.2 5.4±0.7 6 Z→ττveto 0.7±0.0 1.8±0.3 0.3±0.1 2.4±0.4 0.8±0.4 0.0±0.0 0.0±0.2 5.2±0.7 6 mℓℓ<80 GeV 0.7±0.0 0.6±0.2 0.1±0.1 0.8±0.3 0.3±0.2 0.0±0.0 0.0±0.2 1.9±0.5 3
∆φℓℓ<1.8 0.6±0.0 0.5±0.2 0.1±0.1 0.5±0.3 0.3±0.2 0.0±0.0 0.0±0.2 1.4±0.4 2
Composition of main control regions
Signal WW WZ/ZZ/Wγ t¯t tW/tb/tqb Z/γ∗+jets W+jets Total Bkg. Obs.
WW0-jet 0.3±0.0 531±5 43±2 104±3 62±4 11±4 38±1 789±9 820
WW1-jet 0.1±0.0 112±3 13±1 80±3 34±3 9±4 7.7±0.8 256±6 255
Top 1-jet 2.2±0.1 39±2 10±1 489±6 195±7 28±7 7±1 768±12 840
Top 2-jet 4.9±0.1 45±2 11.7±1.0 6371±23 315±10 45±8 52±3 6840±26 7178
Signal region yield foreµandµechannels separately 0-jeteµ 0-jetµe 1-jeteµ 1-jetµe Total bkg. 177±4 162±4 43±2 40±3 Signal 18.7±0.3 14.9±0.2 4.3±0.1 4.2±0.1
Observed 213 194 54 52
[GeV]
mT
50 100 150 200 250 300
Events / 10 GeV
0 10 20 30 40 50
60 Data WW BG (sys WZ/ZZ/W⊕γ stat)
t
t Single Top
Z+jets W+jets H [125 GeV]
ATLAS Preliminary
Ldt = 5.8 fb-1
∫
= 8 TeV, s
+ 0 jets ν µ eν
(*)→
→WW H
[GeV]
mT
50 100 150 200 250 300
Events / 10 GeV
0 10 20 30 40 50 60
Data BG (sys ⊕ stat)
WW WZ/ZZ/Wγ
t
t Single Top
Z+jets W+jets H [125 GeV]
ATLAS Preliminary
Ldt = 5.8 fb-1
∫
= 8 TeV, s
+ 0 jets eν ν µ
(*)→
→WW H
[GeV]
mT
50 100 150 200 250 300
Events / 10 GeV
0 2 4 6 8 10 12 14 16 18
Data BG (sys ⊕ stat)
WW WZ/ZZ/Wγ
t
t Single Top
Z+jets W+jets H [125 GeV]
ATLAS Preliminary
Ldt = 5.8 fb-1
∫
= 8 TeV, s
+ 1 jet ν µ eν
(*)→
→WW H
[GeV]
mT
50 100 150 200 250 300
Events / 10 GeV
0 2 4 6 8 10 12 14
16 Data BG (sys ⊕ stat)
WW WZ/ZZ/Wγ
t
t Single Top
Z+jets W+jets H [125 GeV]
ATLAS Preliminary
Ldt = 5.8 fb-1
∫
= 8 TeV, s
+ 1 jet eν ν µ
(*)→
→WW H
Figure 6: Transverse mass, m
T, distribution in the H + 0-jet (top) and H + 1-jet (bottom) channels, for events satisfying all criteria. The plots on the left show the events with a subleading muon, and the plots on the right show the events with a subleading electron. The expected signal for a SM Higgs boson with m
H= 125 GeV is added on top of the estimated total background. The W+jets background is estimated directly from data and WW and top backgrounds are scaled to use the normalisation derived from the corresponding control regions described in the text. The hashed area indicates the total uncertainty on the background prediction.
Table 3: The expected numbers of signal (m
H= 125 GeV) and background events after the full selections, including a cut on the transverse mass of 0.75 m
H< m
T< m
Hfor m
H= 125 GeV. The observed numbers of events are also displayed. The uncertainties shown are the combination of the statistical and all systematic uncertainties, taking into account the constraints from control samples.
These results differ from those given in Table 2 due to the application of the additional m
Tcut. All numbers are summed over lepton flavours. For the H + 2-jet analysis, backgrounds with fewer than 0.01 events expected are marked as negligible using a ‘-’.
Signal WW WZ/ZZ/Wγ t¯t tW/tb/tqb Z/γ∗+jets W+jets Total Bkg. Obs.
H+0-jet 20±4 101±13 12±3 8±2 3.4±1.5 1.9±1.3 15±7 142±16 185
H+1-jet 5±2 12±5 1.9±1.1 6±2 3.7±1.6 0.1±0.1 2±1 26±6 38
H+2-jet 0.34±0.07 0.10±0.14 0.10±0.10 0.15±0.10 - - - 0.35±0.18 0