ATLAS-CONF-2016-112 10November2016
ATLAS CONF Note
ATLAS-CONF-2016-112
Measurements of the Higgs boson production cross section via Vector Boson Fusion and associated W H
production in the WW ∗ → `ν`ν decay mode with the ATLAS detector at √
s = 13 TeV
The ATLAS Collaboration
10th November 2016
Measurements of the Higgs boson production cross section via Vector Boson Fusion (VBF) and associated W H production using H → WW
∗→ `ν`ν decays are presented. The analyses use events produced in proton-proton collisions collected with the ATLAS de- tector at the LHC in 2015 and 2016. The data correspond to an integrated luminosity of 5.8 fb
−1recorded at √
s = 13 TeV. The total production cross sections are measured to be σ
VBF· B
H→WW∗= 1.4
+0.9−0.7pb and σ
WH· B
H→WW∗= 0.9
+1.3−1.2pb. The ratios of the measured value to the expected value of the total production cross section times branching fraction for VBF and W H production, µ
VBFand µ
WH, correspond to µ
VBF= 1.7
+−0.91.1and µ
WH= 3.2
+4.4−4.2, assuming a Higgs boson mass of m
H= 125 GeV. Since the measure- ments are statistically limited, 95% confidence-level upper limits on the cross section times branching fraction of 3.0 pb and 3.3 pb are set for VBF and W H production, respectively.
c
2016 CERN for the benefit of the ATLAS Collaboration.
1 Introduction
Since the observation of a new particle by the ATLAS [1] and CMS [2, 3] collaborations in the search for the Standard Model (SM) Higgs boson in 2012, the mass, spin, and CP of this new particle have been measured by both collaborations [4–6], establishing this new particle to be compatible with the SM Higgs boson. Measurements of the Higgs boson mass yield a value of 125.09 ± 0.24GeV [4]. The strengths of its couplings to gauge bosons and fermions have also been explored [7]. In all cases the results are consistent with SM predictions within their precision.
Direct observations of the Higgs boson in individual decay channels as well as measurements of its cross sections in di ff erent production modes provide essential insight in the true nature of the Higgs boson and its comparison with the SM. One of the most sensitive decay channels is the final state in which this particle decays into a pair of W bosons and the W bosons decay leptonically, H→ WW
∗→ `ν`ν, where ` denotes an electron or muon; τ leptons are not considered in this analysis, except through their leptonic decays.
This note focusses on the study of the VBF production of the SM Higgs boson and the associated W H production. In case of VBF, the Higgs boson is produced by the fusion of vector bosons radiated by the interacting quarks. In the associated production of W H , the Higgs boson is produced in the Higgs- strahlung process where a Higgs boson is radiated o ff a W boson. Other SM Higgs boson production modes are the gluon-gluon fusion production process (ggF) where two interacting gluons produce a Higgs boson predominantly through a top-quark loop, the associated production of a Higgs boson and a Z boson (Z H), and the associated production of a Higgs boson and a top-quark pair (t t H ¯ ). Studies of H →WW
∗→ `ν`ν at √
s = 7TeV and 8TeV with the ATLAS detector probed the couplings of the Higgs boson in ggF, VBF, and V H production modes [8, 9].
In this note, analyses of the VBF and W H production modes are performed at a centre-of-mass energy of
√ s = 13TeV, using 5.8 fb
−1of proton-proton collision data collected with the ATLAS detector in 2015 and 2016. The VBF analysis selects events with two leptons and at least two jets. Due to the large Drell- Yan (DY) background Z → ee/µµ, only final states with opposite charge and di ff erent lepton flavours eµ/µe
1are taken into account in the VBF analysis. The W H analysis selects events with three leptons of a total electric charge of ±e. The total cross section times branching fraction, σ · B(H → WW
∗), and the signal strength µ, defined as the ratio of the measured signal cross section to the SM prediction, are extracted for the VBF and W H production modes. In both analyses the signal includes events with W → τν decays if the τ lepton decays subsequently to either eν
eν
τor µν
µν
τ.
In each production channel analysis (either VBF or W H), events from all other Higgs production mech- anisms are treated as background. For these backgrounds, Standard Model cross sections, branching fractions, and acceptances for m
H= 125GeV are assumed.
The document is organised as follows: Section 2 gives a brief description of the ATLAS detector, Sec- tion 3 summarises the simulated event samples used in these analyses, and Section 4 describes the selec- tion criteria for final state objects. The event selection and background estimation for the VBF and W H analyses are summarised in Section 5, followed by a discussion of the evaluation of systematic uncertain- ties in Section 6. Finally, the results of each analysis are presented in Section 7, and the conclusion is given in Section 8.
1The lepton flavour ordering reflects the leptonpTordering. The first lepton has the higherpTand is referred to as the leading lepton, whereas the second lepton correspondingly is referred to as the subleading lepton.
2 ATLAS detector
ATLAS [10] is a multi-purpose particle detector with a forward-backward symmetric cylindrical geo- metry
2and close to 4π coverage in solid angle. ATLAS consists of an inner tracking detector (ID) sur- rounded by a thin 2 T superconducting solenoid, electromagnetic and hadronic calorimeters, and a muon spectrometer (MS) incorporating three large superconducting toroid magnets, each with eight coils.
The ID covers the pseudorapidity range |η | < 2.5 and consists of multiple layers of silicon pixel and microstrip detectors, and a straw-tube transition radiation tracker. Since the beginning of 2015, the pixel detector has an additional innermost layer positioned at a radial distance of 3.3 cm [11]. The calorimeter system covers the pseudorapidity range |η| < 4.9. Within the region |η| < 3.2, electromagnetic calori- metry is provided by barrel and endcap high-granularity lead/liquid-argon (LAr) sampling calorimeters.
The hadronic calorimeter consists of steel and scintillator tiles in the central region and two copper/LAr hadronic endcap calorimeters. The solid angle coverage is completed with forward copper / LAr and tung- sten/LAr calorimeter modules optimised for electromagnetic and hadronic measurements, respectively.
The MS consists of separate trigger and high-precision tracking chambers that measure the deflection of muons in the magnetic field generated by superconducting air-core toroids. The precision chamber system covers the region |η| < 2.7 with three stations of drift-tube layers, except for the forward region,
|η| > 2.4, where the innermost station is equipped with cathode strip chambers. The muon trigger system covers the range |η| < 2.4 with resistive plate chambers in the barrel and thin gap chambers in the endcap regions. A two-level trigger system is used. The first-level trigger is hardware-based, using a subset of the detector information, and reduces the event rate to about 80 kHz. This is followed by a software-based trigger level, which reduces the rate further to about 1 kHz.
3 Signal and background modelling
The Monte Carlo (MC) generators used to model signal and background processes are listed in Table 1.
For most processes, separate programs are used to generate the hard scattering process and to model the parton showering (PS), hadronisation, and the underlying event (UE). The CT10 parton distribution function (PDF) set [12] is used for the generation of the hard scattering process in P owheg -B ox v2 [13–
15] and Sherpa v2.1.1 [16], while for MadGraph 5 (version 2.2.1 and 2.2.2) [17] the NNPDF23LO PDF set [18] is used. In case the PS is performed with P ythia 8 [19], the CTEQ6L1 PDF set [20] is used with the AZNLO [21] tune when interfaced to P owheg -B ox v2 and with the A14 [22] tune when interfaced to MadGraph 5. In connection with Pythia, EvtGen 1.2.0 [23] is used for the modelling of the bottom and charm hadron decays. In the S herpa generation the PS uses parameters described in Ref. [24].
In these analyses, the signal contributions considered include the VBF and W H production processes, while the ggF and the Z H production processes are considered as backgrounds. Contributions from t t H ¯ and b bH ¯ production are negligible due to their smaller cross sections and are therefore not considered.
The VBF, V H and ggF production processes are modelled using Powheg-Box v2+Pythia 8.186. For the V H samples, the MiNLO approach [25] is used. The Higgs boson mass set in the generation is 125GeV, which is compatible with the measured value.
2 ATLAS uses a right-handed coordinate system with its origin at the nominal interaction point (IP) in the centre of the detector and thez-axis along the beam pipe. Thex-axis points from the IP to the centre of the LHC ring, and theyaxis points upward.
The pseudorapidityηis defined asη = −ln tan(θ/2), where the polar angleθ is measured with respect to thez-axis. The azimuthal angleφis measured with respect to thex-axis.
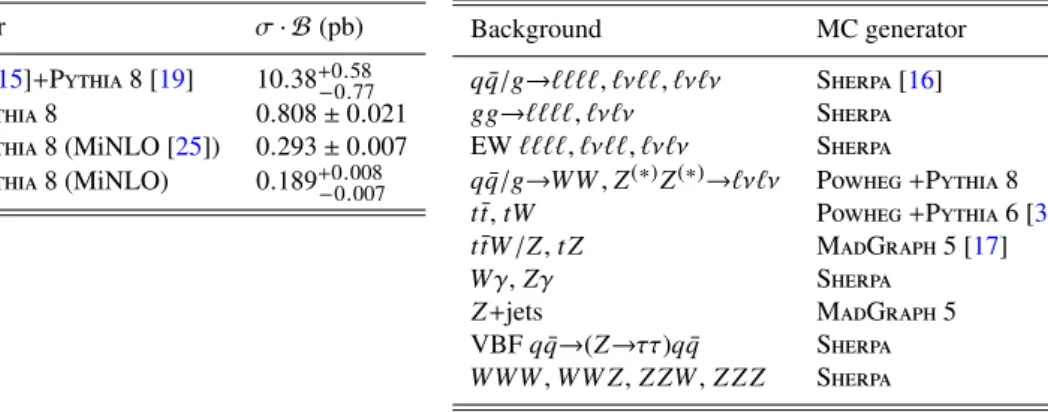
Table 1: Monte Carlo generators used to model the signal and background processes with the corresponding product of the cross section (σ) and branching fraction (B) for the Higgs production modes at√
s=13TeV. The uncertainties quoted include the uncertainties from QCD scale, PDF,αSand branching fraction. The mass of the Higgs boson is set tomH =125GeV, and theH→WW∗decay is assumed. Precise MC generator versions are provided in the text.
Mode MC generator σ· B(pb)
ggF Powheg[13–15]+Pythia8 [19] 10.38+0.58−0.77 VBF Powheg+Pythia8 0.808±0.021 W H Powheg+Pythia8 (MiNLO [25]) 0.293±0.007 Z H Powheg+Pythia8 (MiNLO) 0.189+0.008−0.007
Background MC generator
qq/g→¯ ````, `ν``, `ν`ν Sherpa[16]
gg→````, `ν`ν Sherpa EW````, `ν``, `ν`ν Sherpa
qq/g→WW¯ ,Z(∗)Z(∗)→`ν`ν Powheg+Pythia8 tt,¯ tW Powheg+Pythia6 [38]
ttW¯ /Z,t Z MadGraph5 [17]
Wγ,Zγ Sherpa
Z+jets MadGraph5 VBFqq→(Z→¯ ττ)qq¯ Sherpa WWW,WW Z,Z ZW,Z Z Z Sherpa
The VBF signal cross section is computed with approximate next-to-next-to-leading order (NNLO) QCD corrections [26, 27] and full next-to-leading order (NLO) electroweak (EW) corrections [28–30], res- ulting in a cross section of σ
totVBF= 3.782 pb
+−0.3%0.4%(QCD scale) ± 2.1% (PDF + α
S). The cross sections of the associated V H production processes are calculated at NNLO QCD accuracy [31, 32] and NLO EW accuracy [33], yielding a cross section for W H production of σ
totWH= 1.373 pb
+−0.7%0.5%(QCD scale) ± 1.9% (PDF + α
S). The ggF signal cross section is computed at next-to-next-to-next-to-leading order accuracy in QCD [34]. NLO EW corrections are also applied [35, 36]. The branching fraction for the H → WW
∗decay is calculated using Hdecay [37].
The diboson processes are major backgrounds in this analysis. S herpa v2.1.1 is used to model the q q/g- ¯ initiated diboson processes and the loop-induced gg-initiated diboson processes. They are calculated for up to zero or one additional partons at NLO and up to three additional partons at LO accuracy in the matrix element and are merged with the parton shower using the ME+PS@NLO prescription [39]. EW diboson processes for the ````, `ν`` and `ν`ν final states are generated with up to two partons in the matrix element at LO accuracy using Sherpa v2.1.1. In the VBF analysis Powheg-Box v2+Pythia 8.210 is used to model the q q/g-initiated ¯ WW and Z
(∗)Z
(∗)→ `ν`ν production. Here, the cross section of the q q/g→WW ¯ process is corrected to NNLO accuracy [40] and the cross section of the gg→WW process to NLO accuracy [41].
The t t ¯ and the W t production are generated with P owheg -B ox v2 interfaced to P ythia 6.428 [38] for parton showering, using the P erugia 2012 [42] tune and the CTEQ6L1 PDF set in the showering. The predicted t t ¯ production cross section is calculated with the Top++2.0 program to NNLO in perturbative QCD, including soft-gluon resummation to NNLL [43–50], and assuming a top-quark mass of 172.5GeV.
The t tW ¯ /Z and t Z processes are generated at LO using M ad G raph 5 version 2.2.2 (t tW ¯ /Z) and 2.2.1 (t Z ) interfaced with Pythia 8.186 (t tW ¯ /Z) and Pythia 6.428 (t Z ). In the present analysis the “top-quark”
background collectively refers to the t ¯ t and the W t production in the VBF analysis, while in the W H analysis this category also includes the t¯ tW /Z and t Z processes.
The Zγ and Wγ backgrounds are modelled with S herpa v2.1.1 using multi-leg LO accuracy for up to
three extra partons [51]. The production of a Z boson in association with jets is modelled by M ad G raph
5 version 2.2.2 at LO interfaced with P ythia 8.186. Here, the matrix element calculation is done using
multi-let LO accuracy for up to four additional partons. The overlap in events between the Zγ and Z+jets
samples is removed by rejecting Zγ events in the Z + jets samples. The Z boson production via the vector boson fusion process with Z→ττ decay is modelled by Sherpa at LO. The W +jets process modelling in the VBF analysis is based on a data driven method described in Section 5.1, while it is assumed to be negligible in the W H analysis. The W H analysis includes the triboson background processes WWW, WW Z , Z ZW , and Z Z Z with up to six genuine leptons, which are modelled with Sherpa v2.1.1 at NLO accuracy. Double parton scattering processes are not included due to their assumed negligible e ff ect.
The effect of multiple p p interactions in the same and neighbouring bunch crossings (pile-up) is in- cluded by overlaying minimum-bias interactions simulated with P ythia 8.186 using the MSTW2008LO PDF [52] and the A2 [53] set of tuned parameters on each generated signal and background interaction.
The number of overlaid interactions is reweighted such that the distribution of the average number of interactions per p p bunch crossing in the simulation matches that observed in data (on average 14 (21) interactions per bunch crossing in 2015 (2016)). The generated samples are processed with a detector simulation based on Geant 4 [54, 55], and the same ATLAS reconstruction software is used as for colli- sion data. Additional corrections obtained from measurements in the data are applied to the simulation to account for di ff erences between data and simulation in e.g. the reconstruction of leptons, photons and jets.
4 Object selection
Selected events are required to have at least one primary vertex consisting of at least two associated tracks, each with transverse momentum of p
T> 400MeV, as defined in Ref. [56]. If an event has more than one reconstructed primary vertex, the one with the largest track P
p
2Tis selected for subsequent analysis.
Electrons are reconstructed from clusters of energy deposits in the electromagnetic calorimeter that match to ID tracks, and are identified using criteria based on the calorimeter shower shape, the quality of the match between the track and the cluster, and the amount of transition radiation emitted in the ID, as described in Ref. [57]. For electrons with transverse energy 15GeV < E
T< 25GeV, a likelihood-based selection [57] at the “tight” operating point is used for its improved background rejection. For E
T>
25GeV, the “ medium” selection criteria are used for higher efficiency. Electrons are further required to have a pseudorapidity of |η | < 2.47, excluding 1.37 < |η| < 1.52, which corresponds to the transition region between the barrel and the endcap electromagnetic calorimeters.
Muons are reconstructed by combining ID and MS tracks with consistent trajectories and curvatures.
An overall fit of hits from the ID track, energy loss in the calorimeter and the hits of the track in the muon system is used to form muon candidates, as described in Ref. [58]. They are required to pass the
“medium” [58] identification criteria, have p
T> 15GeV, and |η | < 2.5. Muons with p
T< 25GeV are further required to pass “tight” identification criteria in the VBF analysis.
To ensure that the leptons originate from the primary vertex, extra requirements are imposed on the longitudinal and transverse impact parameters. Furthermore, the leptons must also be isolated from other objects in the event according to the “gradient” isolation criterion, which is p
Tand η dependent and is based on the calorimeter and track information as described in Ref. [57, 58].
Jets are reconstructed from clusters of energy deposits in the calorimeter [59–61] using the anti-k
tal-
gorithm with distance parameter R = 0.4 [62]. The four-momenta of jets are corrected for the ef-
fects of calorimeter non-compensation, signal losses due to noise threshold effects, energy lost in non-
instrumental regions, and contributions from pile-up [63]. A residual correction from in-situ measure-
ments, exploiting the p
Tbalance in Z + jet, γ + jet, and dijet events, is applied to refine the jet calibration.
To further suppress jets from pile-up, a multivariable tagger called “jet vertex tagger” (JVT) [63] is used for jets with 20GeV < p
T< 60GeV and |η| < 2.4. Jets are required to pass a JVT threshold which has 92% e ffi ciency for signal jets. In addition, jets are discarded if they are within a cone of size ∆R < 0.2 of an electron candidate, or if they have fewer than three associated tracks and are within a cone of size
∆ R < 0.2 of a muon candidate. For the remaining jet-lepton pairings within ∆ R < 0.4, the lepton is rejected if the jet passes the JVT requirement.
To categorise events with respect to the jet multiplicity, N
jet, the jets are required to have p
T> 25GeV if | η | < 2.4 and p
T> 30GeV for 2.4 < | η | < 4.5. The increased threshold in the forward region reduces the contribution from jets produced in pile-up collisions. Jets containing b-hadrons are identified using the MV2C10 b-tagging algorithm [64] with an efficiency of 85%, a jet p
T-threshold of 20GeV, and a jet pseudorapidity of |η| < 2.5. The expected rejection factors
3against jets originating from a light quark or gluon and jets containing c-hadrons are 33 and 3, respectively. The jets recognised as b-quark-induced are called b-jets in this note.
The two neutrinos from the W decays in signal events produce a momentum imbalance in the transverse plane. The missing transverse momentum, E
missT
, in each event is calculated from the negative vectorial sum of the transverse momenta of all calibrated selected objects, such as electrons, muons, and jets.
Tracks compatible with the primary vertex and not matched to any of those objects are also included in the E
missT
reconstruction [65, 66].
5 Event categorisation and background estimation
This section describes the categorisation of selected events and background estimation for the VBF and W H analyses. Generally, events are collected by a set of single-lepton triggers [67], with minimal p
Tthresholds of 24GeV for electrons, and 20 (24) GeV for muons in 2015 (2016) data. At least one of the lepton candidates described in Section 4 is required to match a trigger object for the event to be selected.
The VBF analysis selects events with one electron and one muon, and at least two jets which satisfy the characteristic VBF event topology described below. The lepton with the higher p
Tis identified as leading lepton and the other lepton as sub-leading lepton. The W H analysis focuses on signatures with the W boson decaying leptonically, and thus requires three identified leptons (electrons or muons) with total charge ± e, in the presence of missing transverse momentum. In order to ensure that the two analyses are mutually orthogonal, events with a third lepton are vetoed in the VBF analysis.
The contributions of major background processes in the signal regions (SRs) are estimated either by measurements using dedicated data samples or by MC simulated samples where the predicted yields are normalised to data with a normalisation factor (NF). The NF is determined using a data sample, denoted as control region (CR), enriched in the corresponding type of background and is defined as the ratio of the measured background yield to the one predicted by the MC.
Both the VBF and W H analyses are based on the experience that was gained with the analyses at 7TeV and 8TeV [8, 9].
3The rejection factor is defined as the inverse of the probability that a taggedb-jet originates from acquark or a light-flavour quark.
5.1 The VBF analysis
The characteristic signature of a VBF event is the presence of two high-rapidity energetic jets with large separation in rapidity, and a reduced emission of coloured particles between the two jets. In order to fully exploit the correlations among various discriminating variables, a multivariate analysis with a boosted decision tree (BDT) [68–70] is developed.
The VBF analysis adopts a basic pre-selection. Events are required to contain exactly one electron and one muon with opposite electric charge. The leading lepton is required to have p
T> 25GeV for electrons, and p
T> 22 (25)GeV for muons in the 2015 (2016) data. The sub-leading lepton is required to have p
T> 15GeV. Low-mass meson resonances and Drell-Yan events are removed by requiring a dilepton invariant mass, m
``> 10GeV. A requirement of N
jet≥ 2 is applied to enhance the contribution from VBF signal events, and a b-jet veto is applied to reject top-quark background.
Eight discriminating variables are used to train the BDT, following closely the BDT used in Ref. [8].
These variables exploit either properties of the H→ WW
∗decay, which is the case for ∆φ
``, m
``, and m
T, or properties of the VBF signature, which is the case for ∆ y
j j, m
j j, p
totT, P
`,j
m
`j, and η
`centrality. The spin-zero nature of the Higgs boson, together with the structure of the weak interaction in the W boson decays, preferentially produces leptons with a small azimuthal separation angle ∆φ
``and a small dilepton invariant mass m
``. In addition, Higgs boson candidates peak in the distribution of the transverse mass m
T, which is defined as m
T= q
(E
T``+ E
Tmiss)
2− | p
T``+ E
missT
|
2where E
T``= q
| p
``T|
2+ m
2``. The rapidity gap of the two leading jets ∆y
j j, and their invariant mass m
j j, tend to be larger for VBF signal events than for background events. The total transverse momentum p
totT, defined as the magnitude of the vectorial sum p
T`1+ p
`T2+ E
missT
+ P
p
jetsT, is larger for backgrounds with significant soft gluon radiation. The sum of the invariant masses of all four possible lepton-jet pairs P
`,j
m
`jis larger for the VBF signal due to its event topology. The lepton η-centrality η
centrality`quantifies the positions of the leptons with respect to the leading jets in the η-plane and is defined as η
centrality`= |η
`−
Pηj j
2
|/
∆η2j jwhere P η
j j= η
j1+ η
j2and
∆η
j j= |η
j1− η
j2| . Small values of η
centrality`correspond to configurations where leptons are close to the centre of the di-jet system. Hence η
centrality`tends to have a smaller value for VBF signal events. The BDT is trained after the pre-selection cuts to improve the statistics of simulated samples used in the training.
Events from ggF H→ WW
∗→ `ν`ν production are included in the background processes when training the BDT. The variables with the highest ranking in the training, m
``and ∆y
j j, are shown in Fig. 1 after all selection cuts have been applied.
After the BDT is trained, three additional cuts are applied to further reject events from background pro- cesses. The “outside-lepton-veto” (OLV) requires the leptons to reside within the rapidity gap spanned by the two leading jets, as preferred by VBF event topology. The “central-jet-veto” (CJV) rejects events with additional jets with p
T> 20GeV in the rapidity gap of the two leading jets, suppressing backgrounds in which events tend to have more colour flow and jet activity, such as t t. The ¯ Z → ττ veto eliminates most of the Z → ττ background by requiring the invariant mass of the ττ system (m
ττ), calculated using the collinear approximation [71], to be away from the Z -boson resonance, specifically m
ττ< 66.2GeV.
Table 2 summarises the entire VBF selection.
The BDT score is defined in the range of -1 to 1, with signal-like events having a score close to one
and background-like events a score close to -1. The bin widths for the statistical analysis are optimised
for the expected significance while keeping each bin sufficiently populated. The chosen configuration
is three bins with boundaries at [−1, −0.8, 0.7, 1]. The lowest bin contains the majority of data events
[GeV]
mll
0 10 20 30 40 50 60 70 80 90
Events / 10 GeV
10 20 30 40 50 60
= 13 TeV, 5.8 fb-1
s
µe µ+
→ e WW*
→ H
Data SM (sys)
W+jets Z+jets
Top Other VV
WW Other Higgs
H ggF H VBF
× 10 H VBF
ATLAS Preliminary
(a)m``
yjj
0 1 2 3 4 5 6 7 8 ∆ 9
Events / 1
10 20 30 40 50
60 -1
= 13 TeV, 5.8 fb s
µe µ+
→ e WW*
→ H
Data SM (sys)
W+jets Z+jets
Top Other VV
WW Other Higgs
H ggF H VBF
× 10 H VBF
ATLAS Preliminary
(b)∆yj j
Figure 1: Distributions ofm``and∆yj j in the VBF SR. The backgrounds are normalised as is described in Sec- tion5.1.1. The dashed histogram represents the VBF signal scaled with a factor of 10. The hatched band (denoted as “SM (sys)”) includes MC statistical, experimental, and theory systematic uncertainties associated with the pre- diction of the signal and background processes.
Signal region Z → ττ CR Top-quark CR
Preselection
Two isolated leptons (` = e , µ) with opposite charge
p
leadT> 25GeV (p
leadT> 22GeV for muons in 2015), p
Tsublead> 15GeV m
``> 10GeV, N
jet≥ 2
N
b-jet= 0 N
b-jet= 0 N
b-jet= 1
A BDT is trained at this level.
Eight discriminant variables are used: ∆ φ
``, m
``, m
T, ∆ y
j j, m
j j, p
totT, P
`,j
m
`j, and η
centrality`Selection m
ττ< 66.2GeV |m
ττ− m
Z| < 25GeV –
– m
``< 80GeV –
OLV applied, CJV applied, BDT > −0.8
SR1: −0.8 < BDT ≤ 0.7 – –
SR2: 0.7 < BDT ≤ 1 – –
Table 2: Event selection criteria used to define the signal and control regions in the VBF analysis. Definitions including thepTthresholds for jet counting are given in the text.
(1490 events), is dominated by top-quark background, and has a very small signal-to-background ratio.
It is therefore not used in the statistical analysis. The remaining BDT distribution in the signal region is shown in Figure 2. In the following the bin [−0.8, 0.7] is denoted SR1 and the bin [0.7, 1] is denoted SR2.
5.1.1 Background estimation
Several processes contribute to the background in the VBF analysis: t t ¯ and single top-quark production
(denoted as “top-quark”), non-resonant WW, Z → ττ production, W + jets production, ggF Higgs boson
BDT score
− 0.8 − 0.6 − 0.4 − 0.2 0 0.2 0.4 0.6 0.8 1
Events / 0.3
20 40 60 80 100 120
= 13 TeV, 5.8 fb-1
s
µe µ+
→ e WW*
→ H
Data SM (sys)
W+jets Z+jets
Top Other VV
WW Other Higgs
H ggF H VBF
× 10 H VBF
ATLAS Preliminary
Figure 2: Distribution of the BDT output score in the VBF SR. The backgrounds are normalised as is described in Section5.1.1. The dashed histogram represents the VBF signal scaled with a factor of 10. The hatched band (denoted as “SM (sys)”) includes MC statistical, experimental, and theory systematic uncertainties associated with the prediction of the signal and background processes.
production, and diboson production other than WW (denoted as “Other VV ”) including Wγ
∗, Wγ, W Z, and Z Z events. The top-quark and the Z → ττ background normalisations are estimated from data using control regions, that are fitted simultaneously together with the SR to extract the NFs. The definitions of these control regions are given below and summarised in Table 2.
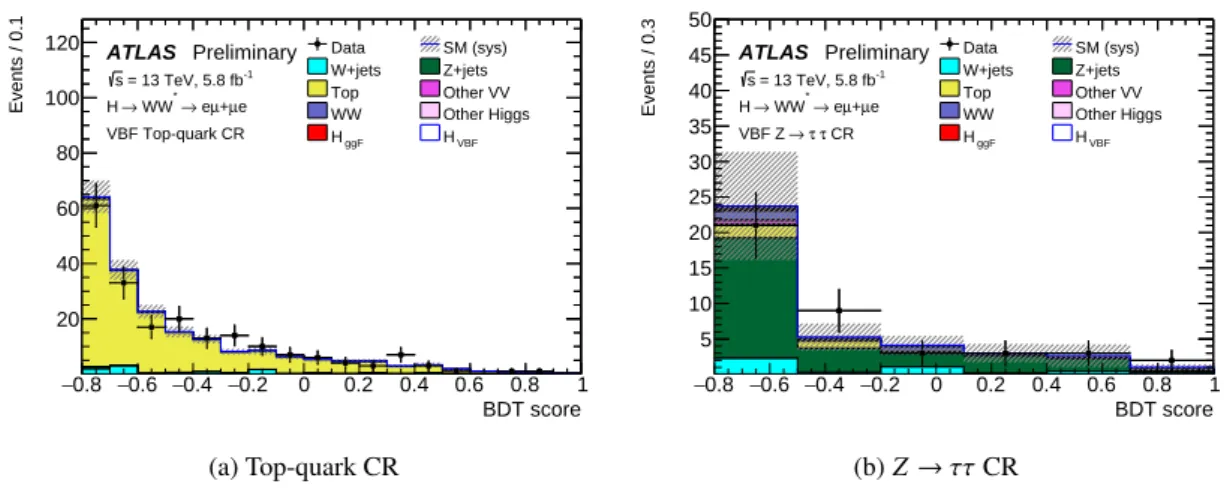
The top-quark CR is defined to be the same as the SR, except that exactly one b-tagged jet is required to enrich the region in top-quarks, while keeping the flavour composition similar with respect to the SR. The purity of top-quark events in the CR is 92% and the resulting top-quark NF is 0.91 ± 0.06(stat)
+−0.300.44(sys).
The largest contributions to the systematic uncertainties on the NF arise from uncertainties on the MC modelling of t t, on the energy scale and resolution of the jets, and on the ¯ b-tagging. The BDT score distribution in the top-quark CR is shown in Figure 3 (a).
The Z → ττ CR is defined using the invariant mass of the ττ system (m
ττ). The Z → ττ CR requires events with m
ττwithin 25GeV of m
Z, otherwise passing the full VBF selection as described in Sec- tion 5.1, and in addition requiring m
``less than 80GeV to suppress top contamination, resulting into a purity of Z → ττ events of 61%. The resulting Z → ττ NF is 0.87 ± 0.20(stat)
+−0.180.21(sys) where the systematic uncertainties are dominated by the limited MC statistics and the uncertainties on the energy scale and resolution of the jets. The BDT score distribution of the Z → ττ CR can be found in Figure 3 (b).
The background contribution due to mis-identified leptons, consisting mainly of W + jets events, is esti-
mated using a control sample of events in which one of the two lepton candidates satisfies the identific-
ation and isolation criteria used to define the signal sample, and the other lepton, called anti-identified,
fails to meet the nominal identification and isolation criteria but satisfies less restrictive ones. Events
in this sample are otherwise required to satisfy all of the SR selection criteria. The contamination of
BDT score
−0.8 −0.6 −0.4 −0.2 0 0.2 0.4 0.6 0.8 1
Events / 0.1
20 40 60 80 100 120
= 13 TeV, 5.8 fb-1
s
µe µ+
→ e WW*
→ H
VBF Top-quark CR
Data SM (sys)
W+jets Z+jets
Top Other VV
WW Other Higgs
H ggF H VBF ATLAS Preliminary
(a) Top-quark CR
BDT score
−0.8 −0.6 −0.4 −0.2 0 0.2 0.4 0.6 0.8 1
Events / 0.3
5 10 15 20 25 30 35 40 45 50
= 13 TeV, 5.8 fb-1
s
µe µ+
→ e WW*
→ H
τ CR τ
→ VBF Z
Data SM (sys)
W+jets Z+jets
Top Other VV
WW Other Higgs
H ggF H VBF ATLAS Preliminary
(b)Z→ττCR
Figure 3: Observed distributions of BDT score in (a) the VBF top-quark CR and (b) the VBFZ →ττCR after the NF have been applied. The hatched band (denoted as “SM (sys)”) includes MC statistical, experimental, and theory systematic uncertainties associated with the prediction of the signal and background processes.
mis-identified leptons in the SR is determined by scaling the number of events in the control region, after subtracting contributions from prompt leptons, by an extrapolation factor, called the fake factor.
The fake factors are measured in two di-jet data samples that are collected either using low-p
Tsingle- lepton prescaled triggers or using the single-lepton triggers that define the signal region. In each of the data samples the fake factor is the ratio of the number of fully identified leptons to the number of anti- identified leptons, measured in bins of anti-identified lepton p
Tand η. If the anti-identified lepton in the W + jets control sample matches the triggered lepton, the fake factors measured in the di-jet sample using signal triggers are applied. Otherwise, the fake factors measured in the prescaled data are used. This es- timation method has been validated in MC-based closure tests. Uncertainties are applied on the difference in sample composition between the di-jet and the W + jets dataset, as described in Section 6.1.
The small background contributions from non-resonant diboson processes (WW , Wγ
∗, Wγ, and W Z ) are estimated from the predicted inclusive cross sections and MC acceptance. Due to the signal-like final state of non-resonant WW a CR with su ffi cient statistics and purity is not defined. The modelling of the MC prediction for all non-resonant diboson processes has been checked in a validation region and corresponding theoretical uncertainties are assigned as described in Section 6.
5.2 The W H analysis
The pre-selection of the W H analysis requires exactly three isolated leptons (electrons or muons) with p
T> 15GeV of total charge ±e. After these requirements, contributions from background processes that include more than one misidentified lepton, such as the W + jets production and the production of b b ¯ pairs, are negligible. The three leptons in an event are classified by identifying `
0as the lepton with unique charge, `
1as the lepton closer in ∆ R = p
( ∆η)
2+ ( ∆φ)
2to `
0, and `
2as the remaining one.
The selection criteria described in this section have been optimised in order to reduce the most relevant background processes, such as W Z /Wγ
∗, Zγ, Z +jets , and top-quark processes.
To separate the sample populated by backgrounds with Z bosons, such as W Z /Wγ
∗, Z Z
(∗)with a misid-
entified lepton, and Zγ with γ conversion, the analysis distinguishes events with at least one pair of same
Category Z-dominated SR Z-depleted SR
≥ 1 SFOS pair no SFOS pair
Preselection
Three isolated leptons (p
T>15 GeV) total charge = ±1
≥ 1 lepton matches to the trigger Background Rejection N
jet≤ 1, N
b-jet= 0
E
Tmiss> 50 GeV –
|m
`+`−− m
Z| > 25 GeV Z/γ
∗→ ee veto m
max`+`−< 200 GeV
m
min`+`−> 12 GeV m
min`+`−> 6 GeV H → WW
∗→ `ν`ν topology ∆ R
`0`1< 2.0
Table 3: Event selection criteria used to define the signal categories in theW Hanalysis. The preselection and the cuts onNjet,Nb-jet,mma x`+`− and∆R`0`1are common to bothZ-dominated andZ-depleted categories.
flavour opposite sign (SFOS) leptons from events without any such pair. The sample with SFOS pairs contains 3 / 4 of the signal but su ff ers from the irreducible backgrounds containing Z bosons, while the sample without such pairs contains only 1/4 of the signal and is mainly affected by backgrounds that are reducible through stringent lepton identification criteria. Events with at least one pair of SFOS leptons are classified in the “Z -dominated” category, while events without any SFOS pairs are classified in the
“Z -depleted” category.
The selection criteria for both categories are summarised in Table 3. Top-quark background is rejected by requiring fewer than two jets in each event and by applying a b-jet veto on jets with p
T> 20GeV and |η| < 2.4. A selection criterion of E
missT> 50GeV is applied in the Z-dominated category to reject background events without neutrinos in the final state. A “Z-mass veto” is applied in the Z -dominated category by requiring the invariant masses of all SFOS pairs to be 25GeV away from the Z boson mass.
To reduce the W Z /Wγ
∗background, the largest opposite-sign di-lepton invariant mass is required to be less than 200GeV. In the Z-depleted category, W Z/Wγ
∗events also enter via a charge-flip of an electron when the Z/γ
∗decays to an electron pair. Such events are suppressed by rejecting any same-sign electron pairs with a mass within 10GeV from the Z boson mass if one or both electrons have |η | > 0.8, denoted as Z /γ
∗→ ee veto. Background events containing non-prompt leptons from heavy flavoured meson decays are rejected by requiring the smallest invariant opposite-sign di-lepton mass in the event to be larger than 12GeV (6GeV) in the Z -dominated (Z -depleted) category.
Finally the angular separation between `
0and `
1, ∆ R
`0,`1, is required to be smaller than 2 radians. This cut favours the Higgs boson decay topology with respect to that of W Z /Wγ
∗events.
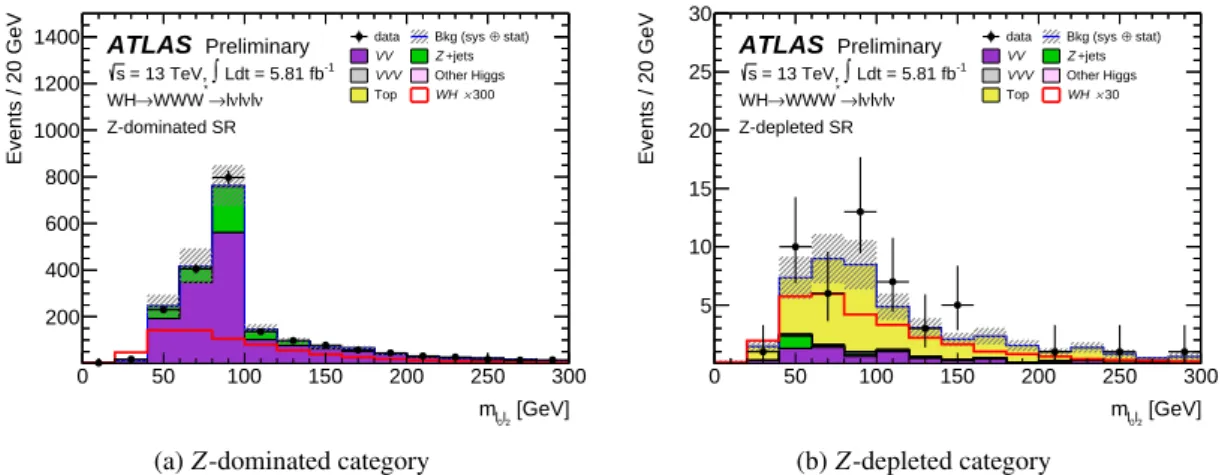
Figure 4 shows the m
`0`2distribution, namely the invariant mass of opposite charge leptons, after the N
jet≤ 1 and N
b-jet= 0 requirements in the Z-dominated and the Z -depleted categories, respectively. The variable m
`0`2is used in the event selection to reduce the background from Z bosons. The Z -dominated category is dominated by the diboson processes with Z bosons and Z +jets events with a jet faking a lepton. The Z -depleted category is dominated by the top background, with marginal contamination from the W Z /Wγ
∗and Z +jets events.
In this analysis, Zγ events are separated from Z + jets events according to their event kinematics, utilising
[GeV]
l2 l0
m
0 50 100 150 200 250 300
Events / 20 GeV
200 400 600 800 1000 1200
1400 data Bkg (sys ⊕ stat)
VV Z+jets
VVV Other Higgs
Top WH×300
ATLAS Preliminary Ldt = 5.81 fb-1
∫
= 13 TeV, s
ν νl νl
→l
*
→WWW WH Z-dominated SR
(a)Z-dominated category
[GeV]
l2 l0
m
0 50 100 150 200 250 300
Events / 20 GeV
5 10 15 20 25 30
data Bkg (sys ⊕ stat)
VV Z+jets
VVV Other Higgs
Top WH×30
ATLAS Preliminary Ldt = 5.81 fb-1
∫
= 13 TeV, s
ν νl νl
→l
*
→WWW WH Z-depleted SR
(b)Z-depleted category
Figure 4: Them`0`2 distribution in (a) theZ-dominated category and (b) the Z-depleted category after theNjet ≤ 1, Nb-jet=0 requirements in theW H analysis. The VV category includesW Z/Wγ∗, Z Z(∗),WW, Zγ,Wγ; the VVV category includesWWW,WW Z,W Z Z; the Other Higgs category includes ggF, VBF,Z H,V H(τ+τ−). The NFs extracted by the likelihood fit are applied. The error band includes MC statistical, experimental, and theory systematic uncertainties associated with the prediction of the signal and background processes.
m
```, the invariant mass of the three-lepton system: events that satisfy the condition of |m
```− m
Z| <
15GeV are categorised as Zγ while events that fail the condition are categorised as Z + jets. In the W H analysis this definition of Z +jets and Zγ background is used consistently everywhere.
5.2.1 Background estimation
Important background processes for this analysis are W Z/Wγ
∗, Zγ, Z+jets, and top-quark processes.
The normalisations of all these processes are estimated using control regions. The definitions of these CRs are briefly described below and summarised in Table 4. Except for the top-quark background where different CRs are defined for the Z -dominated and Z -depleted categories, all measured NFs are applied to both categories.
The W Z /Wγ
∗and Zγ CRs are defined by modifying one or a few selection criteria from the Z -dominated SR. In case of the W Z/Wγ
∗CR the Z -mass veto is inverted, resulting into a W Z/Wγ
∗purity of 92%.
The resulting NF for the W Z /Wγ
∗process is 1.24 ± 0.09 (stat) ± 0.07 (sys). The largest contributions to the systematic uncertainties on the W Z /Wγ
∗NF arise from uncertainties on the energy scale of the jets and on the pile-up. The Zγ CR is defined by removing the Z-mass veto and reversing the cut on E
Tmiss, and by requiring |m
```− m
Z| < 15 GeV. Additionally, this CR is required to contain only µµe and eee events. The purity of the Zγ CR is 83% and the extracted Zγ NF is 0.83 ± 0.08(stat) ± 0.20 (sys).
Events entering the CRs that target backgrounds with one fake lepton, i.e. Z+jets and top-quark, are required to have one lepton without any isolation requirement. This requirement significantly increases the statistics and purity in these CRs, without significantly changing the fake lepton composition in the relevant SRs.
The Z + jets CRs are defined by reversing the E
Tmisscut and the Z-mass veto from the definition of the
Z -dominated SR, as well as requiring | m
```− m
Z| ≥ 15GeV. Since the normalisation of the Z+jets
background is expected to be different when the additional fake lepton is identified as an electron or a
Table 4: Event selection criteria used to define the control regions in theW Hanalysis given with respect to the cuts of the corresponding reference SR.
CR Process Reference SR Changes w.r.t. reference SR
CRa W Z /Wγ
∗Z-dominated ≥ 1 SFOS pair with |m
``− m
Z| < 25 GeV CRb Zγ Z-dominated no Z -mass veto
|m
```− m
Z| < 15 GeV E
Tmiss< 50 GeV only eee, µµe
CRc Z +jets Z-dominated ≥ 1 SFOS pair with |m
``− m
Z| < 25 GeV E
Tmiss< 50 GeV
|m
```− m
Z| > 15 GeV
one lepton without an isolation requirement (NFs are derived for e-fake sample
and µ-fake sample separately) CRd Top quark Z-dominated no m
max`+`−and ∆ R
`0`1cuts
at least 1 jet one b-jet
one lepton without an isolation requirement CRe Top quark Z-depleted no m
max`+`−and ∆ R
`0`1cuts
at least 1 jet one b-jet
one lepton without an isolation requirement
muon, two distinct NFs are derived from the CR: one for events with the flavour combinations µµe + eee (e-fake) and the other for µµµ + eeµ (µ-fake). The purity in the e-fake (µ-fake) sample is 58% (55%).
The obtained Z+jets NFs are 0.69 ± 0.07(stat) ± 0.14 (sys) for the e-fake sample, and 0.70 ± 0.07(stat) ± 0.13 (sys) for the µ-fake sample.
Two top-quark CRs are defined with respect to the Z-dominated and Z -depleted SRs. This is done to take
into account the di ff erences in the top-quark contributions entering each category, which could possibly
be introduced by the di ff erent threshold of the E
Tmissselection. The top-quark background is the dominant
background in the Z -depleted SRs. Events in the top-quark CRs are required to have at least one jet and
exactly one b-jet. In addition, the selection criteria on the largest and smallest invariant mass of opposite
sign leptons, and ∆R
`0`1are removed. The purity of the top-quark CR is 98% (99%) in the Z -dominated
(Z-depleted) category. The top NF is 0.97 ± 0.06(stat) ± 0.04 (sys) in the Z -dominated category, and
0.89 ± 0.06(stat) ± 0.04 (sys) in the Z-depleted category. The largest contribution to the systematic
uncertainties on the top NF arises from the b-tagging uncertainty. In addition to the background processes
mentioned above, triboson production, in particular WWW
(∗), represents an irreducible background. The
contribution of this process in the SRs is compatible with the W H signal. Due to the low cross-section
for this process it is di ffi cult to define a control region wich would be statistically meaningful, therefore
the MC prediction is taken for this process.
Figure 5 shows the m
`0`2distribution in the most important CRs in the Z-dominated and Z -depleted categories, i.e. the W Z/Wγ
∗CR and the Z-depleted Top CR, with the normalisation factors applied.
Good agreement of the modeling prediction with the measured data is observed.
[GeV]
l2 l0
m 0 20 40 60 80 100 120 140 160 180 200
Events / 10 GeV
20 40 60 80 100 120
140 data Bkg (sys ⊕ stat)
VV Z+jets
VVV Other Higgs
Top WH
ATLAS Preliminary Ldt = 5.81 fb-1
∫
= 13 TeV, s
ν νl νl
→l WWW*
→ WH
* CR γ WZ/W
(a)W Z/Wγ∗CR
[GeV]
l2 l0
m
0 50 100 150 200 250 300
Events / 20 GeV
0 10 20 30 40 50 60 70 80 90 100
data Bkg (sys ⊕ stat)
VV Z+jets
VVV Other Higgs
Top WH
ATLAS Preliminary Ldt = 5.81 fb-1
∫
= 13 TeV, s
ν νl νl
→l WWW*
→ WH
Z-depleted top-quark CR
(b)Z-depleted top-quark CR
Figure 5: Them`0`2 distribution in (a) theW Z/Wγ∗CR and (b) theZ-depleted top-quark CR. The VV category includesW Z/Wγ∗, Z Z(∗), WW, Zγ,Wγ; the VVV category includes WWW, WW Z,W Z Z; the Other Higgs category includes ggF, VBF,Z H,V H(τ+τ−). The NFs extracted by the likelihood fit are applied. The error band includes MC statistical, experimental, and theory systematic uncertainties associated with the prediction of the signal and background processes.
6 Systematic uncertainties
The systematic uncertainties on the measured signal strength can be grouped into two categories: experi- mental and theoretical uncertainties. Experimental uncertainties include uncertainties on the selection and reconstruction e ffi ciencies and on the calibration of physics objects, such as the jet energy scale and res- olution, as well as uncertainties on the procedure used to derive the data-driven background estimations.
Theoretical uncertainties include uncertainties on the modelling of signal and background processes, such as the choice of the QCD renormalisation and factorisation scales, the PDF model used, the estimation of the underlying event properties, and the way hadronization and showering are modelled.
In this section the sources of systematic uncertainties are discussed. The determination of the impact of each uncertainty on the results is described in Section 7. The leading systematic uncertainties in the measurements of the coupling strength and cross section are summarised in Table 5 for the VBF and in Table 6 for the W H analysis.
6.1 Experimental uncertainties
To estimate the uncertainties on lepton reconstruction, identification, momentum/energy scale and resol-
ution, and isolation criteria, J /ψ → `
+`
−and Z → `
+`
−decays in data and simulation are exploited [57,
58]. In particular, muon momentum resolution and scale calibrations are derived from a template fit that
compares the invariant di-muon mass evaluated in Z → µµ and J /ψ → µµ candidate events in data and
MC. The corresponding uncertainties are computed from variations of several fit parameters, following the procedure described in Ref. [72].
The jet energy scale, resolution, and their uncertainties are derived by combining information from sim- ulation, test-beam data, and in-situ measurements [59, 73, 74]. The jet energy scale uncertainty is 1%
- 5.5% depending on the jet p
Tand η. Additional contributions from the jet flavour composition, η- intercalibration, single particle response, punch-through, calorimeter response to di ff erent jet flavours, and pileup are taken into account. Since the analysis makes use of b-tagging, uncertainties on the b- and c-tagging efficiencies and mistag rate [64] are also taken into account.
All uncertainties on energy scales and resolution are propagated to the missing transverse momentum.
In addition, the uncertainties on E
Tmissrelative to the soft term have been estimated using different MC generators [73], based on the analysis of Z → µµ events.
In the VBF analysis, a method is developed for the estimation of the background from mis-identified leptons, as described in Section 5.1.1, where a di-jet data sample is used to measure the fake factor of mis- identified leptons. The fake factor is then applied to a W + jets control sample. To account for the di ff erence in jet flavour composition between the W +jets sample and the di-jet sample, a data sample enriched with Z +jets is selected, which has a sample composition close to W+jets but has limited statistical precision.
The envelope of di ff erences between the fake factors measured from the di-jet and the Z + jets samples is assigned as an uncertainty. In addition, a systematic uncertainty estimated from MC is assigned to cover the sample composition difference between W +jets and Z+jets. Other uncertainties associated with the method, including those from subtraction of electroweak processes and statistical uncertainties of the fake factors, are also taken into account.
In the W H analysis a systematic uncertainty is assigned on the the Z +jets e-fake NF to account for the di ff erence in the composition of the flavour of the faking leptons between the SRs and the Z + jets e- fake CR, which is caused by the different definitions of the lepton isolation between the two regions.
An uncertainty of 18% is taken as the envelope of the fluctuations of the NF observed when the lepton isolation definition is varied.
The preliminary uncertainty on the combined 2015+2016 integrated luminosity is 2.0%. It is derived fol- lowing a methodology similar to that detailed in Ref. [75] from a preliminary calibration of the luminosity scale using x –y beam-separation scans performed in August 2015 and May 2016. The uncertainties on the individual luminosity values for 2015 and 2016 are combined as uncorrelated. An additional uncer- tainty is assigned on the modelling of the pile-up events. The simulated samples are reweighted so that the distribution of the number of pile-up collisions matches the one observed in data. The uncertainties on this reweighting factor originate from a measurement of the average number of pile-up events as a function of the average number of vertices yielding uncertainties of +6%/-14%.
6.2 Theoretical uncertainties
For each process, the theoretical uncertainties considered are QCD scale variations, parton shower / under-
lying event modelling (“PS/UE”) differences, PDF model uncertainties. PDF uncertainties are evaluated
from the envelope of the CT10 68% confidence level eigenvectors added in quadrature with the max-
imal di ff erence between the results obtained with CT10 and those obtained with either MSTW [52] or
NNPDF [18]. The uncertainties on the absolute expected yields of signal events in each SR are correl- ated to account for migrations between the signal regions. Other uncertainties specific to the process are considered for ggF production.
The nominal VBF, W H , and ggF MC samples are generated using Powheg+Pythia 8. QCD scale uncer- tainties are evaluated by independently varying the values of the renormalisation µ
Rand the factorisation scales µ
F, in P owheg calculations. Both scales are independently multiplied by a factor of 2.0 or 0.5 relative to the nominal value µ
0= m
H. The PS/UE uncertainties are evaluated for VBF and ggF by comparing the nominal P owheg prediction interfaced with P ythia 8 and H erwig 7 [76, 77] using the UEEE5 tune [78]. Additionally, in case of VBF, an uncertainty is assigned to the choice of generator where Powheg +Pythia 8 is compared to MG5_aMC+Pythia 8.
The evaluation of the ggF background in the VBF SR includes an uncertainty on the acceptance of the central-jet veto. The uncertainty is evaluated using the Stewart-Tackmann (ST) method [79], which treats the inclusive H +2-jet and H+3-jet cross sections as uncorrelated. The inclusive H +2-jet and H+3-jet cross sections and their uncertainties are determined at NLO and LO respectively, using MG5_ a MC [17]
resulting in an uncertainty of 28% for H + 2-jet and 32% for the H + 3-jet cross sections. QCD scale uncertainties are also evaluated in each measurement range of the BDT output, and are 3% in BDT SR1, and 32% in BDT SR2. In addition to the jet-veto uncertainty, also an uncertainty is assigned to the choice of generator where P owheg + P ythia 8 is compared to MG5_ a MC + P ythia 8 which has NLO accuracy for up to two additional jets.
Most of the background processes are normalised using data control regions, as described in the previous sections. The theoretical uncertainties in this case are on the extrapolation from the control to the signal regions, N
SR/N
CR, where N
SRand N
CRare the MC estimates in the SR and CR, respectively.
For the non-resonant WW background in the VBF channel, the QCD scale uncertainties are evaluated with SHERPA where non-resonant WW +2 jets production is included in the matrix element. The PS/UE uncertainty is evaluated by comparing the extrapolation factors for the nominal P owheg+P ythia 8 sample to the predictions from P owheg interfaced to H erwig++ [76]. To evaluate an uncertainty due to the choice of the MC generator, a comparison of Powheg + P ythia8 and SHERPA is performed and results in a 50%
uncertainty, which is the largest source of theory uncertainties on non-resonant WW prediction in the VBF analysis. Part of this uncertainty is driven by a slight disagreement in the modelling of forward jets in SHERPA v2.1 with experimental data, while another part is due to the higher precision in the prediction of non-resonant WW +2 jets events compared to P owheg .
In case of the top-quark background, variations are evaluated with P owheg + P ythia 6 where simul- taneously the renormalisation and factorisation scales, the Powheg h
dampparameter regulating high-p
Tradiation, and the corresponding UE tune are varied [80]. For the PS/UE uncertainty the prediction of P owheg+ P ythia 6 is compared with P owheg+ H erwig++ . An uncertainty on the choice of the generator is assigned by comparing Powheg+Herwig++ with MG5_aMC+Herwig++. Additionally, the uncer- tainty on the treatment of interference between t t ¯ and W t is assessed by comparing samples with two di ff erent schemes for removing common diagrams from the MC samples. The dominant source of uncer- tainty in both the VBF and W H analyses is the generator uncertainty of 35% in case of VBF and 21% in case of W H.
The theoretical uncertainties on the W Z/Wγ
∗production constitute another major theoretical uncertainty
in the W H analysis. The uncertainties due to the choice of QCD scales as well as the resummation scale
are evaluated using SHERPA. Additional uncertainties from comparing the prediction from SHERPA
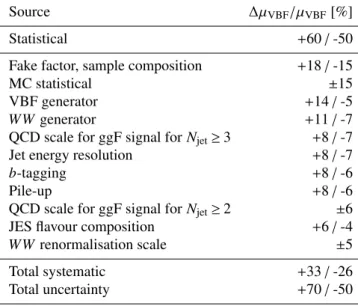
Table 5: List of the leading sources of uncertainties on the measured signal strength, µVBF, in the VBF analysis.
All uncertainties are given in percent. Only the ten leading systematic uncertainties as well as the MC statistical uncertainty are shown. The total uncertainty stated in the last row is the total uncertainty estimated by the likelihood fit, thus including correlations among the nuisance parameters. The total systematic uncertainty stated in the next to last row is obtained subtracting in quadrature the statistical uncertainties from the total uncertainty.
Source ∆µVBF/µVBF[%]
Statistical +60/-50
Fake factor, sample composition +18/-15
MC statistical ±15
VBF generator +14/-5
WW generator +11/-7
QCD scale for ggF signal forNjet≥3 +8/-7
Jet energy resolution +8/-7
b-tagging +8/-6
Pile-up +8/-6
QCD scale for ggF signal forNjet≥2 ±6
JES flavour composition +6/-4
WW renormalisation scale ±5
Total systematic +33/-26
Total uncertainty +70/-50