ATLAS-CONF-2012-119 14August2012
ATLAS NOTE
ATLAS-CONF-2012-119
August 10, 2012
Measurement of momentum imbalance in Z → `` + jet events in Lead-Lead collisions at √
s
NN= 2.76 TeVwith the ATLAS detector
The ATLAS Collaboration
Abstract
The boson
+jet probe, composed of a color neutral boson and color sensitive jet, has been called the ‘golden channel’ for understanding the interactions of color sensitive objects in the quark gluon plasma. This analysis presents a study of azimuthally correlated
Zboson
+jet events observed in the 2011 LHC Pb+Pb run at
√sNN =
2.76 TeV using the ATLAS detector.
Zbosons are reconstructed via the
Z → eeand
Z → µµchannels, and jets are reconstructed using the anti-k
talgorithm following subtraction of the underlying event. A total of 36
Z → `` +jet events satisfy the analysis criteria, and the ratio of the transversemomenta of the jet to the
Zboson is studied. A suppression of this ratio in the data is observed, qualitatively consistent with jet energy loss.
c
Copyright 2012 CERN for the benefit of the ATLAS Collaboration.
Reproduction of this article or parts of it is allowed as specified in the CC-BY-3.0 license.
1 Introduction
One of the earliest observations in Heavy Ion (HI) collisions was the strong suppression of high transverse momentum hadrons [1, 2]. This suppression has been observed both in inclusive particle yields as well as in the quenching of jet energy [3]. By contrast, color neutral particles particles do not appear to be suppressed [4, 5, 6, 7, 8, 9, 10, 11]. This is surmised to be due to an energy loss mechanism that affects particles with color charge in the hot dense QCD medium created in HI collisions, however, a detailed understanding of this mechanism is still unknown. The boson
+jet system allows insight into this mechanism by providing a jet calibrated to the neutral boson.
Photon
+jet measurements have recently been made in Pb
+Pb collisions at
√s
NN =2.76 TeV by the CMS collaboration [12]. This note describes the measurement of azimuthally correlated Z boson
+jet pairs in Pb
+Pb collisions at
√s
NN =2.76 TeV using the ATLAS detector. Although their production cross section is fairly low, Z bosons provide a robust probe with minimal background contamination.
To observe quenching of the jet energy relative to the Z boson, we consider the ratio of their respective transverse momenta, p
jetT /p
ZT. The data are fully corrected for detector e
ffects and the results show sup- pression of this ratio in the Pb
+Pb data compared to P
ythia[13] generated events which do not include energy loss.
2 ATLAS detector
The ATLAS detector [14] at the LHC covers nearly the entire solid angle around the collision point. It consists of an inner tracking detector surrounded by a thin superconducting solenoid, electromagnetic and hadronic calorimeters, and a muon spectrometer incorporating three large superconducting toroid magnet systems.
The inner-detector system (ID) is immersed in a 2 T axial magnetic field and provides charged parti- cle tracking in the range
|η| <2.5
1. The high-granularity silicon pixel detector covers the vertex region and is surrounded by the silicon microstrip tracker and transition radiation tracker.
The calorimeter system covers the range
|η| <4.9. Within the region
|η| <3.2, electromagnetic calorimetry is provided by barrel and end-cap high-granularity lead liquid-argon (LAr) calorimeters, with an additional thin LAr presampler covering
|η| <1.8. Forward Calorimeters (FCal) are located in the range 3.1
<|η|<4.9.
The muon spectrometer (MS) comprises separate trigger and high-precision tracking chambers mea- suring the deflection of muons in a magnetic field generated by superconducting air-core toroids. The precision chamber system covers the region
|η| <2.7 with three layers of monitored drift tubes (MDT), complemented by cathode strip chambers (CSC) in the innermost layer of the forward region. The muon trigger system covers the range
|η| <2.4 with resistive plate chambers in the barrel, and thin gap cham- bers in the endcap regions.
Also used in this analysis are signals from the Zero Degree Calorimeters (ZDC) situated on both sides of the detector at
|η|>8.3.
3 Analysis
This analysis uses 2011 LHC Pb
+Pb collision data collected with the ATLAS experiment and corre- sponding to an integrated luminosity of approximately 0.15 nb
−1after detector data quality requirements.
1The ATLAS reference system is a Cartesian right-handed coordinate system, with the nominal collision point at the origin.
The anticlockwise beam direction defines the positivez-axis, while the positivex-axis is defined as pointing from the collision point to the center of the LHC ring and the positivey-axis points upwards. The azimuthal angleφis measured around the beam axis, and the polar angleθis measured with respect to thez-axis. Pseudorapidity is defined asη=−ln(tan(θ/2)).
The analysis builds on the inclusive Z
→ ``analysis documented in [11]. Analyzed events are divided into centrality classes. Centrality reflects the overlap volume of the two colliding nuclei, characterized by the classical impact parameter. Collisions with a small (large) impact parameter are referred to as central (peripheral). The overlap volume is closely related to the average number of participant nucleons which scatter inelastically in each nuclear collision,
hNparti, and to the average number of binary collisions be-tween the nucleons of the colliding nuclei,
hNcolli. Glauber model calculations [15] relate centrality to
hNpartiand
hNcolli, following the procedure documented in Ref. [6]. This analysis considers the 0–20%most central events and the 20–80% more peripheral events.
The Pb+Pb collision centrality is measured using the sum of transverse energy (
PE
T) deposited in the FCal, calibrated at the electromagnetic energy scale as described in reference [16]. Multiple Pb+Pb collisions overlapping in one event (pileup) may bias the centrality measurement. However, the fraction of events with more than one Pb+Pb collision was estimated not to exceed 0.05%, except for the most central 5% of events in which the fraction does not exceed 0.5%. The estimate is based on the high energy tail of the FCal
PE
Tdistribution which is dominated by pileup events. A cut on the FCal energy of
PE
T<3.8 TeV was applied to prevent contamination by events with multiple Pb
+Pb interactions.
3.1 Event selection
The data sample for this study was collected by the ATLAS three-level trigger system [17] which selected events with high transverse momentum (p
T) electron and muon candidates. The total number of sampled events is (1.03
±0.02)
×10
9[6] corresponding to 98
±2% of the non-Coulomb inelastic Pb+Pb cross section [18].
The Z bosons were reconstructed via ee and
µµdecay channels following exactly the procedure described in [11]. Electron candidates were identified at the first trigger level (L1) as a cluster formed with (
∆φ×∆η)=0.1
×0.1 trigger towers of the electromagnetic calorimeter, covering the pseudorapidity range
|η| <2.5, excluding the crack region of the calorimeter (1.37
< |η| <1.52). Candidates were then identified using the standard ATLAS reconstruction algorithm [19], requiring the matching of a track to an electromagnetic calorimeter cluster. In addition to the track matching requirement, cuts based on the energy balance between the track momentum and cluster energy (E/ p) and calorimeter shower shape variables, were also used for electron identification. Electron selection was limited to
|η| <2.5 and both electrons were required to have E
T >20 GeV.
Muon candidates were selected using all three levels of the trigger system. The L1 muon trigger searched for patterns of hits consistent with muons of a certain p
Tin the trigger chambers within
|η|<2.4.
If a muon had p
Texceeding 4 GeV the event was accepted for further processing by the High Level Trigger (HLT). The L1 muon algorithm also identified Regions of Interest (RoI) within the detector to be investigated by the HLT. At the HLT, the track parameters of each muon were recalculated by including the precision data from the MDT or CSC in the RoI defined by the previous trigger level.
Muon candidates were reconstructed either solely from the MS or using combined data from the MS and ID systems. In addition to the events selected using the RoI-based muon trigger, full scan muon reconstruction was performed by the HLT to identify muons with p
T >10 GeV. The full scan searched the entire MS for muons, and was performed for all events satisfying an L1 trigger requirement that a signal is detected in each of the ZDC, or an E
T >10 GeV deposition in the ATLAS calorimeters. The full scan search increased the muon trigger e
fficiency by approximately 10%, for muons with p
Tgreater than 10 GeV.
Single muons were reconstructed using information from the ID and the MS subsystems [20].
The reconstructed muons were separated into high-quality and low-quality categories based on the hit-
multiplicities in the di
fferent detectors and on the ID
/MS matching criteria. Muon pairs were formed
by one high-quality muon (which must be matched to the muon that triggered the event) combined with
either another high-quality muon or a low-quality muon. For muon pairs containing two high-quality
muons the minimum pT threshold was set to 10 GeV on both muons, for pairs with only one-high quality muon the threshold on both muons was raised to 20 GeV.
Once identified, electron and muon candidates were paired in ee or
µµopposite charge combinations.
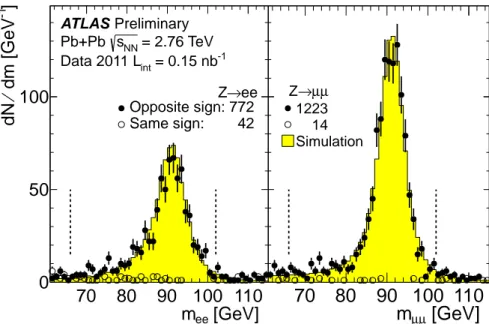
Pairs with an invariant mass between 66 and 102 GeV were accepted as Z boson candidates. The Z boson sample has a contamination from background processes of less than 3%, based on an estimate from same-sign lepton pairs. The invariant mass distributions of the selected pairs together with estimated combinatorial backgrounds are shown in Fig. 1. Because it is small, the background contribution to the selected Z bosons is not explicitly subtracted in this analysis.
[GeV]
m
ee70 80 90 100 110 ]
-1dm [GeV ⁄ dN
0 50
100
Z→ee Opposite sign: 772 Same sign: 42 PreliminaryATLAS
= 2.76 TeV sNN
Pb+Pb
= 0.15 nb-1
Data 2011 Lint
[GeV]
µ
m
µ70 80 90 100 110
counts
0 50
100 Z→µµ 1223 14 Simulation
Figure 1: The invariant mass distributions of Z
→ee (left) and Z
→µµ(right) candidates, integrated over momentum, rapidity, and centrality. The same-sign pairs used to estimate the background are also shown.
Bars represent statistical uncertainty. The number of pairs is listed for the region 66
<m
ll <102 GeV.
The simulation shown is taken from [11] and is weighted to match the centrality distribution in data and normalized in the region 66
<m
ll<102 GeV.
Each event containing a Z boson candidate was scanned for jets. Jets were reconstructed with an anti-k
t[21, 22] algorithm, using three cone sizes: R
=0.2, 0.3, and 0.4. In the HI environment there is a significant energy deposition in the calorimeters due to the underlying event (UE) which must be removed in order to accurately reconstruct jets. If a jet’s energy is included in the calculation of the UE background, the background will be overestimated. To avoid this a two step iterative procedure to estimate and subtract the UE contribution to the jet was used in which the actual jets were excluded from the UE estimate. Details of HI jet reconstruction in ATLAS are discussed in reference [23].
Fluctuations in the calorimeter energy deposit from the UE may lead to the reconstruction of fake jets.
To reject these fake jets, all jets accepted for the analysis were required to be within
∆R
= p∆η2+ ∆φ2<
0.4 of either a track jet (a jet reconstructed with charged particles of p
Tgreater than 4 GeV) with p
Tgreater than 10 GeV or an electromagnetic cluster in the calorimeter with p
Tgreater than 7 GeV. In addition to these requirements, the jet must not have overlapped (
∆R
<0.4) with either of the Z boson daughter leptons.
Jets were required to have a minimum p
Tof 25 GeV. For consistent performance of the fake rejection
criteria, jets were limited to
|η| <2.1. Only the jet with the highest transverse momentum in an event,
the “leading” jet, was considered for the Z boson
+jet analysis.
To choose Z bosons and jets that are correlated with each other, and likely originate in the same initial hard scattering, only pairs that are separated by at least
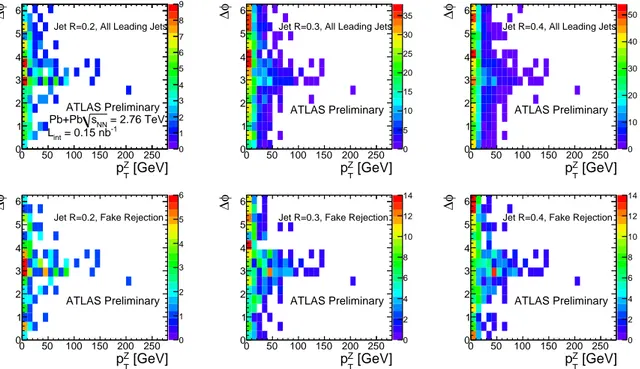
π/2 in azimuthal angle were considered. Figure2 shows the distribution of the difference in azimuthal angle (∆
φ) between aZ boson and the leading jet as a function of p
ZTboth with and without fake jet rejection. One can see from the figure that following fake rejection and a moderate p
ZTrequirement, a clean sample of jets azimuthally correlated with the Z boson is obtained.
0 1 2 3 4 5 6 7 8 9
[GeV]
Z
pT 0 50 100 150 200 250
φ∆
0 1 2 3 4 5 6
Jet R=0.2, All Leading Jets
ATLAS Preliminary = 2.76 TeV sNN
Pb+Pb = 0.15 nb-1
Lint
0 5 10 15 20 25 30 35
[GeV]
Z
pT 0 50 100 150 200 250
φ∆
0 1 2 3 4 5 6
Jet R=0.3, All Leading Jets
ATLAS Preliminary
0 10 20 30 40 50
[GeV]
Z
pT 0 50 100 150 200 250
φ∆
0 1 2 3 4 5 6
Jet R=0.4, All Leading Jets
ATLAS Preliminary
0 1 2 3 4 5 6
[GeV]
Z
pT 0 50 100 150 200 250
φ∆
0 1 2 3 4 5 6
Jet R=0.2, Fake Rejection
ATLAS Preliminary
0 2 4 6 8 10 12 14
[GeV]
Z
pT 0 50 100 150 200 250
φ∆
0 1 2 3 4 5 6
Jet R=0.3, Fake Rejection
ATLAS Preliminary
0 2 4 6 8 10 12 14
[GeV]
Z
pT 0 50 100 150 200 250
φ∆
0 1 2 3 4 5 6
Jet R=0.4, Fake Rejection
ATLAS Preliminary
Figure 2: The
∆φdistribution between Z bosons and leading (highest p
Tin the event) jets as a function of p
ZT. Jets must have p
Tgreater than 25 GeV, and
|η|<2.1. The top row shows all leading jets, and the bottom row only those that pass fake rejection. Three jet cone sizes - R=0.2, 0.3, 0.4 - are shown from left to right.
In order to study the transverse momentum balance between the jet and Z boson, we must consider Z bosons of sufficiently high transverse momentum that even a partially quenched jet may still be recon- structed. To that end, a minimum p
ZTof 60 GeV was used. To ensure that the phase space of the ratio p
jetT/p
ZTis evenly filled, a further requirement was made that each accepted event have p
jetT /p
ZTgreater than 25
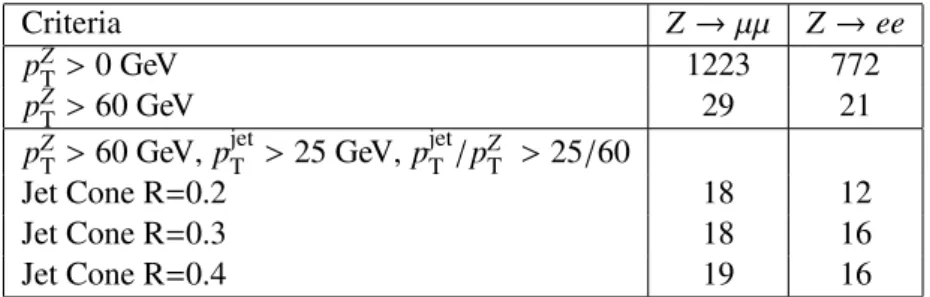
/60. Thirty-six total Z
→ `` +jet events passed all the selection cuts and were analyzed. All events reconstructed with a jet cone size of R
=0.2 were also reconstructed using the larger cone sizes.
One event was reconstructed using the R=0.3 cone size but not with the R=0.4 cone size, and two events were in the R
=0.4 cone size sample but not in the R
=0.3 sample. Table 1 lists the events accepted in the analysis for each jet reconstruction cone size. Of these events, 8 events contained multiple jets re- constructed with p
jetTgreater than 25 GeV. Within statistical uncertainties, excluding these multiple-jet events from the analysis did not any change any of the results significantly.
3.2 Corrections and Systematic Uncertainties
The e
fficiency of Z boson reconstruction and identification was calculated as in [11]. The uncertainty
associated with the Z boson efficiency and momentum resolution results in an uncertainty of 2% in the
Criteria Z
→µµZ
→ee
p
ZT>0 GeV 1223 772
p
ZT>60 GeV 29 21
p
ZT>60 GeV, p
jetT >25 GeV, p
jetT /pZT >25/60
Jet Cone R
=0.2 18 12
Jet Cone R
=0.3 18 16
Jet Cone R=0.4 19 16
Table 1: The raw number of events for different Z
→``and Z
→``+jet criteria.
ratio p
jetT /p
ZT.
To determine the jet yield, the measured jet p
Tdistribution must be corrected for detector e
ffects us- ing an unfolding technique. To calculate this correction a sample of simulated p
+p→ jet
+Z
→``(with
`=
e,
µ) was generated using Pythia(version 6.425). The response of the ATLAS detector to the gener-
ated particles was modeled using GEANT4 [24, 25]. The P
ythiagenerated events were embedded into minimally biased real data events from the 2011 Pb+Pb run recorded by ATLAS. Using the simulation to estimate it, the jet reconstruction e
fficiency in the 0–20% most central events is approximately 50%
(45%, 30%) at 25 GeV using a jet cone size of R
=0.2 (R
=0.3,0.4), and is fully e
fficient at approximately 65 GeV. Using the simulated events a bin-by-bin unfolding was performed to calculate the corrections for the observed jet p
Tspectrum. The unfolding of the jet p
Tspectrum was performed independently in bins of centrality and p
ZT, as well as separately for each jet cone size. A jet energy scale (JES) correction was also calculated based on the simulation.
The unfolding and jet energy scale corrections are the dominant source of systematic uncertainty on the measurement. To estimate the uncertainty associated with the unfolding correction, the jet p
Tspectrum present in the simulation was varied and the unfolding corrections recalculated. Since the true p
Tdistribution of the jets observed experimentally is not known a priori, the simulation spectrum is reweighted according to multiple schemes: changing the shape of the p
jetTdistribution, while both lower- ing and raising the mean p
jetT. For each reweighted spectrum the unfolding corrections were recalculated and their difference to the unfolding correction factor calculated without reweighting was propagated into a systematic uncertainty. A similar approach was adopted to estimate the uncertainty associated with the JES: multiple values were used for the JES and the unfolding corrections were recalculated for each of them. The unfolding corrections associated with the varied energy scale were compared to the value calculated without varying the JES. The differences in the resulting various correction factors were then propagated into the systematic uncertainty.
In the p
jetT /p
ZTratio, the uncertainties from the unfolding are approximately 12% to 15% from the smaller to the larger jet cone sizes, and 25% to 40% from the JES uncertainty. For the mean of the p
jetT/p
ZTratio, the unfolding correction uncertainty is approximately 2% and the energy scale uncertainty is about 5%. The uncertainty is largely correlated across centrality bins. Cumulatively, the systematic uncertainties are generally of a similar magnitude to the statistical uncertainties.
4 Results
Figures 3 - 8 show the unfolded and efficiency corrected ratio p
jetT/p
ZTand the
∆φdistributions for each
of the three jet cone sizes, in the full centrality range (0–80%) and in two bins across this range (0–20%,
20–80%). The data is compared to P
ythiagenerated Z
→ ``events which contains no energy loss
mechanism and thereby serve as a baseline from which to judge any jet quenching effects. The data and
P
ythiaare normalized by the number of Z bosons with p
ZTgreater than 60 GeV. As the events used for
the three jet cone size analyses are almost identical (see Table 1) the statistical uncertainties are very correlated across Figures 3 - 8 (within centrality bins).
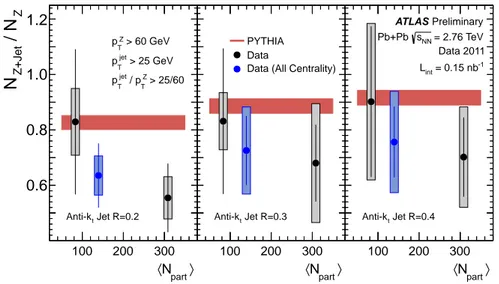
The extracted means of the p
jetT/p
ZTdistributions for the different centrality bins and jet cone sizes are summarized in Figure 9. In addition to the shape of the p
jetT /p
ZTdistributions, we may consider the fraction of events with a Z boson ( p
ZT >60 GeV) that also have a jet reconstructed (p
jetT >25 GeV, p
jetT/p
ZT >25/60) as an indicator of jet quenching. This is equivalent to the integral of Figures 3 - 8 and is shown in Figure 10 .
Z
/pT jet
pT
0.5 1 1.5 2 2.5 3
)Z T/pjet Td(p
Z+jetdN × ZN1
0 1 2 3
ATLAS Preliminary
=0.15 nb-1
=2.76 TeV,Lint
sNN
Pb+Pb
>25/60
Z
/pT jet
>60 GeV, pT Z
>25, pT jet
Jet R=0.2, pT
Anti-kT
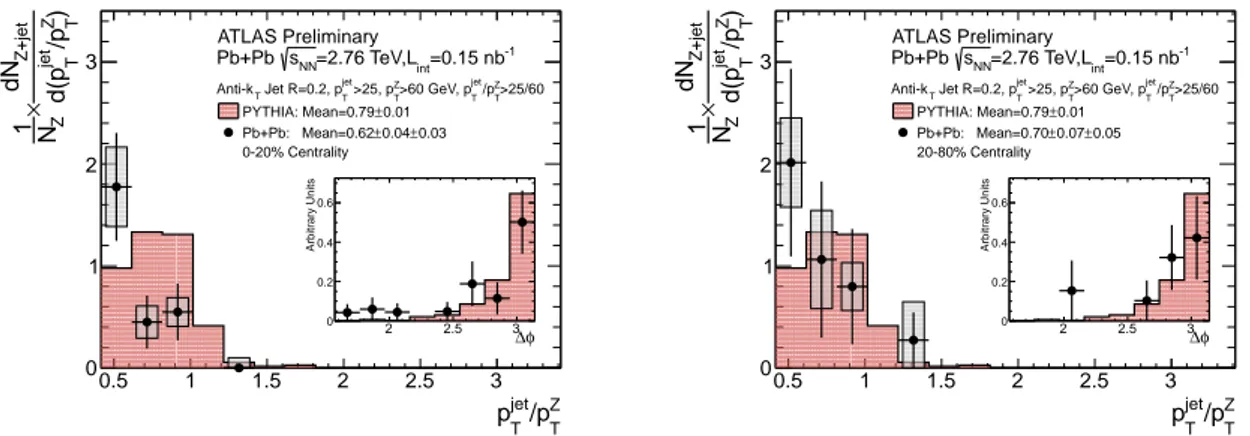
±0.01 PYTHIA: Mean=0.79
±0.03
±0.04 Pb+Pb: Mean=0.65 0-80% Centrality
φ
2 2.5 3∆
Arbitrary Units
0 0.2 0.4 0.6
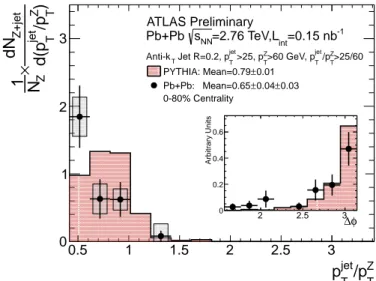
Figure 3: The ratio p
jetT /p
ZTnormalized per Z boson from unfolded and e
fficiency corrected Pb
+Pb data.
The same quantity from P
ythiawith no jet energy quenching is also shown. The
∆φdistribution (folded
around
π), normalized to unity, is inset in the plot. Bars represent statistical uncertainties, and shadedboxes systematic uncertainties. The mean uncertainties listed are statistical for P
ythia, and statistical
followed by systematic for the data. The data is from 0–80% centrality. Jets are reconstructed with a
cone size of R=0.2.
Z
/pT jet
pT
0.5 1 1.5 2 2.5 3
)Z T/pjet Td(p
Z+jetdN × ZN1
0 1 2 3
ATLAS Preliminary
=0.15 nb-1
=2.76 TeV,Lint
sNN
Pb+Pb
>25/60
Z
/pT jet
>60 GeV, pT Z
>25, pT jet
Jet R=0.2, pT
Anti-kT
±0.01 PYTHIA: Mean=0.79
±0.03
±0.04 Pb+Pb: Mean=0.62 0-20% Centrality
φ
∆
2 2.5 3
Arbitrary Units
0 0.2 0.4 0.6
Z
/pT jet
pT
0.5 1 1.5 2 2.5 3
)Z T/pjet Td(p
Z+jetdN × ZN1
0 1 2 3
ATLAS Preliminary
=0.15 nb-1
=2.76 TeV,Lint
sNN
Pb+Pb
>25/60
Z
/pT jet
>60 GeV, pT Z
>25, pT jet
Jet R=0.2, pT
Anti-kT
±0.01 PYTHIA: Mean=0.79
±0.05
±0.07 Pb+Pb: Mean=0.70 20-80% Centrality
φ
∆
2 2.5 3
Arbitrary Units
0 0.2 0.4 0.6
Figure 4: The ratio p
jetT /p
ZTnormalized per Z boson from unfolded and e
fficiency corrected Pb
+Pb data.
The same quantity from P
ythiawith no jet energy quenching is also shown. The
∆φdistribution (folded around
π), normalized to unity, is inset in the plot. Bars represent statistical uncertainties, and shadedboxes systematic uncertainties. The mean uncertainties listed are statistical for P
ythia, and statistical followed by systematic for the data. The data on the left is from 0–20% centrality and on the right 20–80% centrality. Jets are reconstructed with a cone size of R
=0.2.
Z
/pT jet
pT
0.5 1 1.5 2 2.5 3
)Z T/pjet Td(p
Z+jetdN × ZN1
0 1 2 3
ATLAS Preliminary
=0.15 nb-1
=2.76 TeV,Lint
sNN
Pb+Pb
>25/60
Z
/pT jet
>60 GeV, pT Z
>25, pT jet
Jet R=0.3, pT
Anti-kT
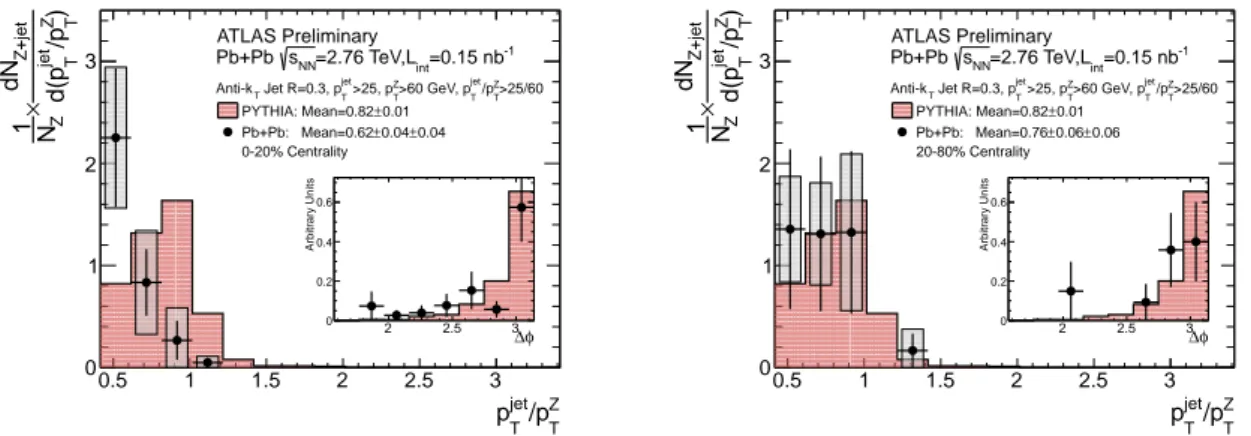
±0.01 PYTHIA: Mean=0.82
±0.05
±0.03 Pb+Pb: Mean=0.67 0-80% Centrality
φ
2 2.5 3∆
Arbitrary Units
0 0.2 0.4 0.6
Figure 5: The ratio p
jetT /p
ZTnormalized per Z boson from unfolded and efficiency corrected Pb+Pb data.
The same quantity from P
ythiawith no jet energy quenching is also shown. The
∆φdistribution (folded
around
π), normalized to unity, is inset in the plot. Bars represent statistical uncertainties, and shadedboxes systematic uncertainties. The mean uncertainties listed are statistical for Pythia, and statistical
followed by systematic for the data. The data is from 0–80% centrality. Jets are reconstructed with a
cone size of R
=0.3.
Z
/pT jet
pT
0.5 1 1.5 2 2.5 3
)Z T/pjet Td(p
Z+jetdN × ZN1
0 1 2 3
ATLAS Preliminary
=0.15 nb-1
=2.76 TeV,Lint
sNN
Pb+Pb
>25/60
Z
/pT jet
>60 GeV, pT Z
>25, pT jet
Jet R=0.3, pT
Anti-kT
±0.01 PYTHIA: Mean=0.82
±0.04
±0.04 Pb+Pb: Mean=0.62 0-20% Centrality
φ
∆
2 2.5 3
Arbitrary Units
0 0.2 0.4 0.6
Z
/pT jet
pT
0.5 1 1.5 2 2.5 3
)Z T/pjet Td(p
Z+jetdN × ZN1
0 1 2 3
ATLAS Preliminary
=0.15 nb-1
=2.76 TeV,Lint
sNN
Pb+Pb
>25/60
Z
/pT jet
>60 GeV, pT Z
>25, pT jet
Jet R=0.3, pT
Anti-kT
±0.01 PYTHIA: Mean=0.82
±0.06
±0.06 Pb+Pb: Mean=0.76 20-80% Centrality
φ
∆
2 2.5 3
Arbitrary Units
0 0.2 0.4 0.6
Figure 6: The ratio p
jetT /p
ZTnormalized per Z boson from unfolded and e
fficiency corrected Pb
+Pb data.
The same quantity from P
ythiawith no jet energy quenching is also shown. The
∆φdistribution (folded around
π), normalized to unity, is inset in the plot. Bars represent statistical uncertainties, and shadedboxes systematic uncertainties. The mean uncertainties listed are statistical for P
ythia, and statistical followed by systematic for the data. The data on the left is from 0–20% centrality and on the right 20–80% centrality. Jets are reconstructed with a cone size of R
=0.3.
Z
/pT jet
pT
0.5 1 1.5 2 2.5 3
)Z T/pjet Td(p
Z+jetdN × ZN1
0 1 2 3
ATLAS Preliminary
=0.15 nb-1
=2.76 TeV,Lint
sNN
Pb+Pb
>25/60
Z
/pT jet
>60 GeV, pT Z
>25, pT jet
Jet R=0.4, pT
Anti-kT
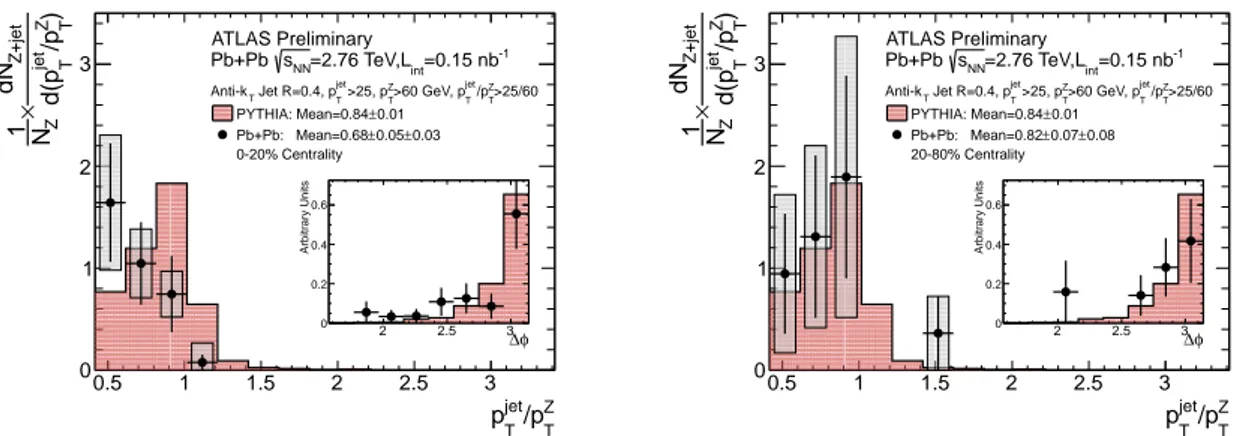
±0.01 PYTHIA: Mean=0.84
±0.03
±0.04 Pb+Pb: Mean=0.72 0-80% Centrality
φ
2 2.5 3∆
Arbitrary Units
0 0.2 0.4 0.6
Figure 7: The ratio p
jetT /p
ZTnormalized per Z boson from unfolded and efficiency corrected Pb+Pb data.
The same quantity from P
ythiawith no jet energy quenching is also shown. The
∆φdistribution (folded
around
π), normalized to unity, is inset in the plot. Bars represent statistical uncertainties, and shadedboxes systematic uncertainties. The mean uncertainties listed are statistical for Pythia, and statistical
followed by systematic for the data. The data is from 0–80% centrality. Jets are reconstructed with a
cone size of R
=0.4.
Z
/pT jet
pT
0.5 1 1.5 2 2.5 3
)Z T/pjet Td(p
Z+jetdN × ZN1
0 1 2 3
ATLAS Preliminary
=0.15 nb-1
=2.76 TeV,Lint
sNN
Pb+Pb
>25/60
Z
/pT jet
>60 GeV, pT Z
>25, pT jet
Jet R=0.4, pT
Anti-kT
±0.01 PYTHIA: Mean=0.84
±0.03
±0.05 Pb+Pb: Mean=0.68 0-20% Centrality
φ
2 2.5 3∆
Arbitrary Units
0 0.2 0.4 0.6
Z
/pT jet
pT
0.5 1 1.5 2 2.5 3
)Z T/pjet Td(p
Z+jetdN × ZN1
0 1 2 3
ATLAS Preliminary
=0.15 nb-1
=2.76 TeV,Lint
sNN
Pb+Pb
>25/60
Z
/pT jet
>60 GeV, pT Z
>25, pT jet
Jet R=0.4, pT
Anti-kT
±0.01 PYTHIA: Mean=0.84
±0.08
±0.07 Pb+Pb: Mean=0.82 20-80% Centrality
φ
2 2.5 3∆
Arbitrary Units
0 0.2 0.4 0.6
Figure 8: The ratio p
jetT /p
ZTnormalized per Z boson from unfolded and efficiency corrected Pb+Pb data.
The same quantity from P
ythiawith no jet energy quenching is also shown. The
∆φdistribution (folded around
π), normalized to unity, is inset in the plot. Bars represent statistical uncertainties, and shadedboxes systematic uncertainties. The mean uncertainties listed are statistical for Pythia, and statistical followed by systematic for the data. The data on the left is from 0–20% centrality and on the right 20–80% centrality. Jets are reconstructed with a cone size of R
=0.4.
〉
Z T/ p
jet Tp 〈
0.6 0.7 0.8 0.9
part 〉
〈N 100 200 300
0.6 0.65 0.7 0.75 0.8 0.85 0.9 0.95
Jet R=0.2 Anti-kt
> 60 GeV
Z
pT
> 25 GeV
jet
pT
> 25/60
Z
/ pT jet
pT
part 〉
〈N 100 200 300
0.6 0.65 0.7 0.75 0.8 0.85 0.9 0.95
Jet R=0.3 Anti-kt
PYTHIA Data
Data (All Centrality)
part 〉
〈N 100 200 300
0.6 0.65 0.7 0.75 0.8 0.85 0.9 0.95
Jet R=0.4 Anti-kt
Preliminary ATLAS
= 2.76 TeV sNN
Pb+Pb
Data 2011 = 0.15 nb-1
Lint
Figure 9: The extracted means from the p
jetT /p
ZTdistributions of the fully corrected data plotted as a function of
hNparti, for each of the three considered jet cone sizes. The data are compared to a baseline ofP
ythia, which does not contain any jet energy loss mechanisms. Bars represent statistical uncertainties, and shaded boxes systematic uncertainties. The systematic uncertainties are largely correlated across the
hNpartibins. The width of the Pythia band represents its uncertainty. The blue points refer to 0-80%
centrality, and therefore are not independent relative to the black points.
Z
/ N
Z+JetN
0.6 0.8 1.0 1.2
part 〉
〈N 100 200 300
0.5 0.6 0.7 0.8 0.9 1 1.1 1.2
Jet R=0.2 Anti-kt
> 60 GeV
Z
pT
> 25 GeV
jet
pT
> 25/60
Z
/ pT jet
pT
part 〉
〈N 100 200 300
0.5 0.6 0.7 0.8 0.9 1 1.1 1.2
Jet R=0.3 Anti-kt
PYTHIA Data
Data (All Centrality)
part 〉
〈N 100 200 300
0.5 0.6 0.7 0.8 0.9 1 1.1 1.2
Jet R=0.4 Anti-kt
Preliminary ATLAS
= 2.76 TeV sNN
Pb+Pb
Data 2011 = 0.15 nb-1
Lint
Figure 10: The fraction of events with a Z boson (p
ZT >60 GeV) that also have a jet reconstructed ( p
jetT >25 GeV, p
jetT /pZT >25/60) as a function of
hNparti, for each of the three considered jet cone sizes.The data are compared to a baseline of P
ythia, which does not contain any jet energy loss mechanisms.
Bars represent statistical uncertainties, and shaded boxes systematic uncertainties. The systematic un-
certainties are largely correlated across the
hNpartibins. The width of the P
ythiaband represents its
uncertainty. The blue points refer to 0–80% centrality, and therefore are not independent relative to the
black points.
5 Conclusions
The ATLAS experiment has measured the transverse momentum ratio p
jetT/p
ZTin a total of 36 azimuthally correlated Z boson
+jet pairs in Pb+Pb collisions at
√s
NN=2.76 TeV using 0.15 nb−1of integrated
luminosity collected in the 2011 LHC physics run. Events were restricted to those with p
jetT >25 GeV,
p
ZT>60 GeV, and p
jetT /p
ZT>25/60. The data are fully corrected for e
fficiency and detector e
ffects using
an unfolding method; this allows a direct comparison to a baseline of Pythia Z boson
+jet events. The
data clearly show some suppression for the extracted mean of the ratio p
jetT /p
ZTcompared to the P
ythiagenerated events. The data are suggestive of somewhat increasing suppression in more central collisions,
although the low number of events in the data do not allow a precise measurement of the jet energy loss
as a function of centrality. These results are qualitatively consistent with the expectation of energy loss
in jets as they traverse the hot dense medium created in HI collisions.
References
[1] PHENIX Collaboration, Suppression of hadrons with large transverse momentum in central Au
+Au collisions at
√s
NN =130-GeV , Phys. Rev. Lett.
88(2002) 022301, arXiv:nucl-ex/0109003 [nucl-ex].
[2] STAR Collaboration, Centrality Dependence of High-p
THadron Suppression in Au
+Au Collisions at
√s
NN =130 GeV, Phys. Rev. Lett.
89(Oct, 2002) 202301.
http://link.aps.org/doi/10.1103/PhysRevLett.89.202301.
[3] ATLAS Collaboration, Observation of a Centrality-Dependent Dijet Asymmetry in Lead-Lead Collisions at
√s
NN =2.76 TeV with the ATLAS Detector at the LHC, Phys. Rev. Lett.
105(Dec, 2010) 252303. http://link.aps.org/doi/10.1103/PhysRevLett.105.252303.
[4] PHENIX Collaboration, Measurement of Direct Photons in Au
+Au Collisions at
√s
NN =200 GeV, arXiv:1205.5759 [nucl-ex].
[5] CMS Collaboration, Measurement of isolated photon production in pp and PbPb collisions at
√
s
NN=2.76 TeV, Phys. Lett.
B710(2012) 256 – 277.
[6] ATLAS Collaboration, Measurement of high p
Tisolated direct photons in lead-lead collisions at
√
s
NN=2.76 TeV with the ATLAS detector at the LHC, ATLAS-CONF-2012-051 (2012) . http://cdsweb.cern.ch/record/1448154.
[7] CMS Collaboration, Study of W boson production in PbPb and pp collisions at
√s
NN=2.76 TeV, arXiv:1205.6334 [nucl-ex].
[8] ATLAS Collaboration, Measurements of W Boson Yields in Pb
+Pb at 2.76 TeV
/nucleon via single muons with the ATLAS detector, ATLAS-CONF-2011-078 (2011) .
http://cdsweb.cern.ch/record/1353227.
[9] ATLAS Collaboration, Measurement of the centrality dependence of J
/ψyields and observation of Z production in lead-lead collisions with the ATLAS detector at the LHC, Phys. Lett.
B697(2011) 294–312.
[10] CMS Collaboration, Study of Z Boson Production in PbPb Collisions at
√s
NN =2.76 TeV, Phys.
Rev. Lett.
106(2011) 212301.
[11] ATLAS Collaboration, Measurement of the Z boson Production in Lead-Lead Collisions at
√
s
NN=2.76 TeV with the ATLAS Detector, 2012. ATLAS-CONF-2012-052 (2012) , http://cdsweb.cern.ch/record/1451930.
[12] CMS Collaboration, Studies of jet quenching using isolated-photon
+jet correlations in PbPb and pp collisions at
√s
NN=2.76 TeV, arXiv:1205.0206 [nucl-ex].
[13] T. Sj¨ostrand, S. Mrenna, and P. Skands, P
ythia6.4 physics and manual, JHEP (2006) no. 05, 026.
[14] ATLAS Collaboration, The ATLAS Experiment at the CERN Large Hadron Collider, Journal of Instrumentation
3(2008) no. 08, S08003.
http://stacks.iop.org/1748-0221/3/i=08/a=S08003.
[15] M. L. Miller, K. Reygers, S. J. Sanders, and P. Steinberg, Glauber modeling in high energy
nuclear collisions, Ann. Rev. Nucl. Part. Sci.
57(2007) 205–243, arXiv:nucl-ex/0701025
[nucl-ex].
[16] ATLAS Collaboration, Measurement of the centrality dependence of charged particle spectra and R
CPin lead-lead collisions at
√s
NN=2.76 TeV with the ATLAS detector at the LHC, ATLAS-CONF-2011-079 (2011) . https://cdsweb.cern.ch/record/1355702.
[17] ATLAS Collaboration, Performance of the ATLAS Trigger System in 2010, . https://cdsweb.cern.ch/record/1353227.
[18] ATLAS Collaboration, Measurement of the centrality dependence of the charged particle pseudorapidity distribution in lead-lead collisions at
√s
NN=2.76 TeV with the ATLAS detector, Phys. Lett.
B710(2012) 363–382, arXiv:1108.6027 [hep-ex].
[19] ATLAS Collaboration, Electron performance measurements with the ATLAS detector using the 2010 LHC proton-proton collision data, Eur. Phys. J.
C72(2012) 1909, arXiv:1110.3174 [hep-ex].
[20] ATLAS Collaboration, Muon Performance in Minimum Bias pp Collision Data at
√s
=7 TeV with ATLAS, ATLAS-CONF-2010-036 (2010) . https://cdsweb.cern.ch/record/1277675.
[21] M. Cacciari and G. P. Salam, Dispelling the myth for the jet-finder, Physics Letters B
641(2006) no. 1, 57 – 61.
http://www.sciencedirect.com/science/article/pii/S0370269306010094.
[22] M. Cacciari, G. P. Salam, and G. Soyez, The Anti-k(t) jet clustering algorithm, JHEP
0804(2008) 063, arXiv:0802.1189 [hep-ph].
[23] ATLAS Collaboration, Centrality dependence of Jet Yields and Jet Fragmentation in Lead-Lead Collisions at
√s
NN=2.76 TeV with the ATLAS detector at the LHC, ATLAS-CONF-2011-075 (2011) . https://cdsweb.cern.ch/record/1353220.
[24] S. Agostinelli et al., Geant4—a simulation toolkit, NIM A
506(2003) no. 3, 250 – 303.
http://www.sciencedirect.com/science/article/pii/S0168900203013688.
[25] ATLAS Collaboration, The ATLAS Simulation Infrastructure, Eur. Phys. J.
C70(2010) 823–874.
http://dx.doi.org/10.1140/epjc/s10052-010-1429-9.
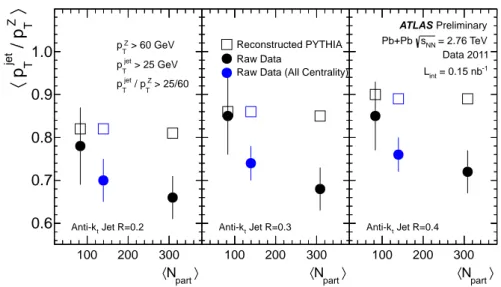
6 Auxiliary Plots
〉
Z T/ p
jet Tp 〈
0.6 0.7 0.8 0.9 1.0
part 〉
〈N 100 200 300
0.6 0.7 0.8 0.9 1
Jet R=0.2 Anti-kt
> 60 GeV
Z
pT
> 25 GeV
jet
pT
> 25/60
Z
/ pT jet
pT
part 〉
〈N 100 200 300
0.6 0.7 0.8 0.9 1
Jet R=0.3 Anti-kt
Reconstructed PYTHIA Raw Data
Raw Data (All Centrality)
part 〉
〈N 100 200 300
0.6 0.7 0.8 0.9 1
Jet R=0.4 Anti-kt
Preliminary ATLAS
= 2.76 TeV sNN
Pb+Pb
Data 2011 = 0.15 nb-1
Lint