ATLAS-CONF-2014-039 04July2014
ATLAS NOTE
ATLAS-CONF-2014-039
July 4, 2014
Search for resonant diboson production in the ℓ
+ℓ
−q q ¯ final state in pp collisions at √
s = 8 TeV with the ATLAS detector
The ATLAS Collaboration
Abstract
This note reports a search for resonances in diboson production in the
ℓ+ℓ−q q ¯ final state using 20 fb
−1of pp collision data collected at
√s
=8 TeV with the ATLAS detector at the Large Hadron Collider. No significant excess of data events over the Standard Model expectation is observed. Upper limits at the 95% confidence level are set on the production cross section times branching ratio of Kaluza–Klein gravitons predicted by the Randall–
Sundrum model and Extended Gauge Model W
′bosons. These results lead to the exclusion of mass values below 740 and 1590 GeV for the graviton and W
′boson, respectively.
c Copyright 2014 CERN for the benefit of the ATLAS Collaboration.
Reproduction of this article or parts of it is allowed as specified in the CC-BY-3.0 license.
This note presents a search for narrow diboson resonances in the semi-leptonic decay channel ZW or ZZ
→ ℓ+ℓ−q q ¯ (where
ℓstands for electron or muon) in 20 fb
−1of pp collision data recorded with the ATLAS detector at
√s
=8 TeV at the Large Hadron Collider. Such resonances appear in models like Technicolor [1–3], Warped Extra Dimensions [4–6], and Grand Unified Theories [7]. The semi- leptonic decay channel has a relatively large branching ratio compared to the fully leptonic mode, while the requirement of the presence of two decay leptons can suppress the multijet background present in the fully hadronic mode. Additionally, the lack of neutrinos in the final state allows for the full reconstruction of the invariant mass of the diboson system.
This analysis uses two models with narrow resonances as benchmarks for analysis optimization: spin- 2 Kaluza–Klein (KK) gravitons (G
∗→ZZ) and spin-1 W
′gauge bosons (W
′ →ZW) of the Sequential Standard Model (SSM) with modified coupling to ZW, also referred to as the Extended Gauge Model (EGM) [9]. For both models, the W and Z bosons from resonance decays are longitudinally polarized over a pole mass range relevant to this analysis.
The KK graviton interpretation is based on an extended Randall–Sundrum (RS) model of warped extra dimension where the Standard Model (SM) fields can propagate into the bulk of the extra dimen- sion [8]. This extended “bulk” RS model avoids constraints on the original RS model [4], referred to as RS1 hereafter, from limits on flavor changing neutral currents and electroweak precision tests, and allows a dimensionless coupling constant k/ M ¯
Pl∼1 where k is the curvature of the warped extra dimension and M ¯
Pl =M
Pl/√8π is the reduced Planck mass. The width of the bulk RS graviton with k/ M ¯
Pl =1 varies between 3% and 6% within the pole mass range of 300 and 2000 GeV.
The EGM [9] introduces W
′and Z
′bosons with SM couplings to fermions and with the coupling strength of the heavy W
′to WZ modified by a mixing factor
ξ =c
×(m
W/mW′)
2relative to the SM couplings, where m
Wand m
W′are the pole masses of the W and W
′bosons respectively, and c is a coupling scaling factor. In this scenario the partial width of the W
′boson to WZ (that grows rapidly as m
5W′and dominates the total width at m
W′above
∼250 GeV in the SSM) scales linearly with m
W′, leading to a narrow resonance over the accessible mass range. For simulated EGM W
′samples used in the analysis, the natural W’ width is about 3% of the pole mass at 300 GeV and slightly increases with the mass up to 4% at 2000 GeV.
The D0 collaboration searched for resonances in WW and ZW production [10, 11] and excluded W
′bosons in the mass range of 180
−690 GeV and RS1 gravitons in the mass interval 300
−754 GeV at 95% confidence level (CL). The CDF experiment searched for resonances in the ZZ decay channel and set limits on the production cross section of RS1 gravitons in the mass range 300
−1000 GeV at 95% CL [12]. The ATLAS collaboration reported searches for resonant ZZ (
→ℓℓℓ′ℓ′,
ℓℓqq) [13], ¯ WW (
→ℓνqq) [14] and ¯ WZ (
→ℓνqq, ¯
ℓνℓ′ℓ′) [14, 15] production, and searches for new phenomena in high- mass WW (
→ ℓνℓ′ν′) processes [16] using pp collision data recorded at
√s
=7 TeV, except for the WZ
→ℓνℓ′ℓ′search in Ref. [15] that has been carried out at
√s
=8 TeV. Here
ℓ′stands for an electron or muon. These studies excluded W
′bosons in the mass range up to 1.52 TeV for WZ, RS1 gravitons up to 845 GeV for ZZ and 1.23 TeV for WW. The CMS collaboration searched for ZZ resonances in the semi-leptonic decay channel and set limits on the production cross section of bulk RS graviton [17]. The CMS collaboration also studied the fully hadronic channel to exclude RS1 gravitons with k/ M ¯
Pl=0.1 for masses up to 1.2 TeV, and the W
′boson for masses less than 1.7 TeV [18]. These CMS studies consider event topology where the hadronic system from the decay of one or two gauge bosons is produced at high transverse momentum p
T, resulting into a single reconstructed jet, and employ jet substructure technique to efficiently detect such a signature.
In this letter, three optimized selection criteria classify ZW/ZZ
→ℓ+ℓ−q q ¯ events into distinct kine-
matic ranges, namely the “low- p
Tresolved region” (LR), “high- p
Tresolved region” (HR) and “merged
region” (MR), based on the p
Tof the dilepton and the hadronic systems. In the LR and HR the hadronic
boson decay is reconstructed in two distinct jets, whereas in the MR it is reconstructed as a single jet. In
pole mass [GeV]
σG∗·BR [fb]
σW′·BR [fb]
500 540 4100
800 23 540
1400 0.44 33
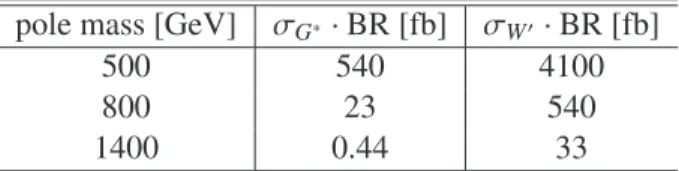
Table 1: Theoretical production cross sections
σG∗( pp
→G
∗)
·BR(G
∗ →ZZ) with k/ M ¯
Pl =1.0 and
σW′( pp
→W
′)
·BR(W
′→ZW) with c
=1 for di
fferent resonance pole masses of the resonances.
all three cases, the dilepton (hadronic system) mass is required to be consistent with the masses of the Z boson (W or Z boson). In the MR, additional jet substructure information, optimized for the identifica- tion of the hadronic decay of a longitudinally polarized high p
Tboson, is used to improve the sensitivity.
Finally, the
ℓ+ℓ−q q ¯ mass spectrum, reconstructed as the mass of the dilepton and the two jet system in the LR and HR (m
ℓℓj j) or the dilepton and the single jet system in the MR (m
ℓℓJ), is examined for excesses with respect to the background expectation from SM processes.
The ATLAS detector [19] consists of an inner detector (ID) providing charged particle tracking for the pseudorapidity [20] range
|η|<2.5, surrounded by a superconducting solenoid, electromagnetic and hadronic calorimeters with the coverage of
|η|<4.9, and a muon spectrometer (MS) that provides muon identification in
|η|<2.7 with a toroidal magnetic field.
This study uses an integrated luminosity of 20 fb
−1of pp collision data collected in 2012. The luminosity is derived from beam-separation scans [21] and has an uncertainty of 2.8%. Events are se- lected with lepton triggers which require the presence of at least one lepton (electron or muon) with p
Tabove 24 GeV. The trigger e
fficiency for signal events that pass the selection criteria described below is approximately 92% for the muon channel and greater than 99% for the electron channel.
To model the acceptance and the reconstructed mass spectra for narrow resonances, benchmark signal samples are generated with a pole mass in the range between 300 and 2000 GeV, in 100 GeV steps. Ad- ditional samples are generated between 350 and 950 GeV for the bulk RS G
∗signal so that the mass gap is reduced to 50 GeV, which is comparable to the detector resolution of the reconstructed
ℓ+ℓ−q q ¯ mass in this mass interval. The bulk RS G
∗signal events are simulated by C
HEP [22, 23] with k/ M ¯
Pl =1
.0, and the W
′signal is simulated with P
8 [24] setting the coupling scale factor c
=1. The factoriza- tion and renormalization scales are set to the resonance mass. The W
′production cross section is scaled to next-to-next-to-leading-order (NNLO) calculation in
αsby ZW
[25]. The hadronization and frag- mentation are in both cases modeled with P
8, and the CTEQ6L1 [26] (MSTW2008LO [27]) parton distribution functions (PDFs) are used for the G
∗(W
′) signal. Calculated production cross section times branching ratio values for di
fferent pole masses are given in Table 1.
The main background sources are Z bosons produced in association with jets (Z
+jets), followed by top-quark pair and non-resonant vector-boson pair production. The contribution from multijet events is negligible after the selection cuts described later. All background sources are estimated using Monte Carlo simulated events, some of those corrected using data as described below. The Z
+jets background is modeled by the S
generator [28] and CT10 PDFs [29]. The top pair, s-channel single top and Wt processes are modeled by the MC@NLO [30] generator and CT10 PDFs, interfaced to H
[31]
for hadronization and J
[32] for the underlying event modeling. The top pair production cross sec-
tion is calculated at NNLO in QCD including resummation of next-to-next-to-leading logarithmic soft
gluon terms with Top++2.0 [33–38]. The t-channel single top events are simulated by AcerMC [39] with
CTEQ6L1 PDF and P
for hadronization. The diboson events are produced with the H
gen-
erator and CTEQ6L1 PDF. The diboson cross sections are normalized to predictions at next-to-leading-
order accuracy as calculated with MCFM [40]. All Monte Carlo events are processed with the ATLAS
detector simulation program based on the GEANT4 package [41]. Effects from additional inelastic pp
interactions (pile-up) are taken into account by overlaying P
simulated minimum-bias events.
Electron candidates are selected from the energy clusters of the electromagnetic calorimeter accord- ing to the medium criteria of Ref. [42] which impose requirements on the shower profile and demand an associated track reconstructed in the ID. Offline reconstructed electrons are required to have p
T >25 GeV and
|η|<2.47. The transition region between the barrel and endcaps (1.37
<|η|<1.52) is excluded.
Muon candidates are reconstructed by combining ID and MS tracks which have consistent position, charge and momentum measurements [43]. The muon candidates are required to have p
T >25 GeV and
|η|<
2.4.
To ensure that both electrons and muons originate from the primary vertex, it is required that the product of the longitudinal impact parameter (z
0) and the sine of polar angle of the candidate (θ) satisfies
|
z
0sin(θ)
| <0.5 mm, and that the ratio of the transverse impact parameter (d
0) to its uncertainty (σ
d0) for electrons (muons) fulfills
|d
0|/σd0 <6 (3.5). In addition, the lepton candidate is required to be isolated from other tracks and calorimetric activity. The scalar sum of the transverse momenta of tracks within a cone of
∆R = p(∆η)
2+(∆φ)
2 =0.2 around the lepton track is required to be less than 15%
of the candidate p
T. Similarly, the sum of transverse energy deposits in the calorimeter within a cone of
∆R =0.2, excluding the transverse energy due to the lepton and corrected for the expected pile-up contribution, is required to be less than 30% of the candidate p
T(calorimetric isolation).
To improve the acceptance of events with highly boosted Z bosons with p
Tabove
∼800 GeV, the isolation method is modified for dilepton objects. A dilepton track isolation variable is calculated for each lepton of a like-flavour pair by subtracting the p
Tof the paired lepton from the p
Tsum described above if it falls inside the isolation cone of the lepton under consideration. The modified scalar sum p
Tvariable for the dilepton isolation is required to be less than 15% of the lepton p
T, as in the standard track isolation. The calorimetric isolation requirements are dropped if
∆R(ℓ+ℓ−)
<0.25.
Jets are reconstructed from clusters of calorimeter cells by the anti-k
talgorithm [44] with a distance parameter R
=0.4. Jets are required to have p
T >30 GeV after correcting for energy losses in passive material, the non-compensating response of the calorimeter, and extra energy due to event pile-up [45], and to have
|η|<2.1. Furthermore, for jets with p
T<50 GeV, the scalar sum p
Tof associated tracks from the primary vertex is required to be at least 50% of the scalar sum p
Tof all associated tracks to suppress jets from pile-up interactions. The selected anti-k
tjets are referred to as small-R jets and denoted as “ j”
hereafter.
For resonances with a mass above about 900 GeV, the q q ¯ pair is often merged into a single jet and the fraction of the merged q q ¯ pair increases with the resonance mass. These merged jets, referred to as large-R jets or “ J”, are reconstructed with the Cambridge-Aachen jet clustering algorithm [46] with a distance parameter of R
=1.2. To exploit the characteristics of the decay of the massive boson into a q q ¯ pair, these jets are further required to pass a splitting and filtering algorithm similar to the algorithm described in Ref. [47] but optimized for the identification of highly boosted boson decays [49]. The large-R jets are required to be within
|η|<1.2 and to have p
T >100 GeV.
Events which contain exactly two electrons or muons satisfying the above criteria, of which at least one is associated with a lepton trigger candidate, are selected. The dilepton invariant mass m
ℓℓis required to be in the range 66
<m
ℓℓ <116 GeV to select lepton pairs originating from a Z boson decay. The m
ℓℓcut is chosen to be wide to maximize the signal sensitivity, given that the dominant background is from the Z
+jets processes. Muon pair events are further required to have muons of opposite charge.
The opposite charge requirement is not required for electron pair events because of a higher charge misidentification rate for high p
Telectrons.
The three selection regions are characterized by the p
Tranges for the leptonic Z candidate ( p
ℓℓT) and
hadronic jet system, namely the MR with p
ℓℓT >400 GeV and p
JT >400 GeV for the large-R jet at
high p
T, and the LR (HR) with p
ℓℓT >100 (250) GeV and p
Tj j >100 (250) GeV for the two small-R
jets at low (medium) p
T. Events are classified by sequentially applying the criteria for the MR, HR,
Sample LR HR MR Z
+jets 9460
±40
±660 591
±4
±15 20.9
±0.3
±2.3 WW/WZ/ZZ 234
±4
±22 20.6
±0.3
±1.4 1.38
±0.02
±0.13
t¯ t
+Single t 175.3
±9.2
±9.9 - -
Total (unconstrained) 9870
±690 612
±17 22.30
±2.48
Total (constrained) 9730
±30 609
±6.1 22.32
±0.97
Data 9728 619 25
G
∗Signal 1097
±17
±63 14.27
±0.19
±0.76 0.0995
±0.0013
±0.0059 W
′Signal 1950
±40
±140 145.0
±2.3
±8.1 3.64
±0.06
±0.31 Table 2: Event yields in signal regions for data, expected backgrounds, and G
∗and W
′signals. The statistical and systematic uncertainties are given separately (in this order), except for the total background where the combined statistical and systematic uncertainties before and after the fit to the data in the signal regions. The signal mass points correspond to 500 (LR), 800 (HR), 1400 (MR) GeV.
and LR, and assigning each event exclusively to the first region for which the criteria are fulfilled. In addition to the requirement that the leptonic Z boson candidate’s mass be near the Z pole, the mass of the hadronic jet system is required to be in the range 70
<m
j j/J <110 GeV for both hadronic W and Z candidates in all the three regions. In the MR, the large-R jet is split into subjets using an algorithm described in Ref. [47]. In this process the mass relation between the large-R jet and subjets is not imposed in contrast to the configuration used in Ref. [47]. A momentum balance variable is defined as
√yf=
min( p
Tj1,p
Tj2)∆R
12/m12, where p
Tj1and p
Tj2are the transverse momenta of the two leading subjets,
∆R12
is their separation and m
12is their mass. To suppress jets from gluon radiation and splitting,
√yfis required to be greater than 0.45. Overall, the signal acceptance times efficiency after all selection requirements increases from between 5–10% at m
G∗ =300 GeV to a plateau of between 30–35% above m
G∗ =500 GeV for a signal sample of G
∗→ZZ
→ℓ+ℓ−q q ¯ with
ℓ=e, µ .
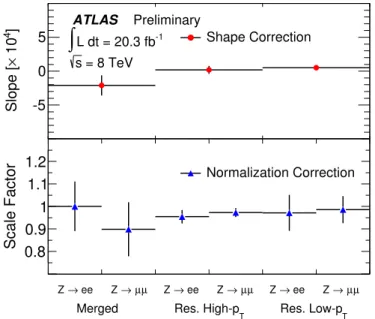
The normalization and m
ℓℓj j/Jshape corrections of the simulated Z
+jets background sample are determined, separately for electron and muon channels, from data in a control region defined by all selection cuts but with an inverted cut on m
j j/Jin the resolved and merged regions. The normalization correction, obtained as the ratio of event yields between the data and Z
+jets MC samples, ranges between 2% and 10%. The m
ℓℓj j/Jshape correction is modeled with a first order polynomial fit to the data to Z
+jets MC ratio, derived for each signal region after combining the electron and muon channels.
This results in bin-by-bin corrections of up to 7% in the LR, 3% in the HR, and 22% in the MR. The event yield in the three signal regions is summarized in Table 2.
The main systematic uncertainty on the background estimation comes from the uncertainty in the Z
+jets background modeling. The normalization uncertainty of the Z
+jets background is given by the relative difference between the normalization corrections derived from the nominal control region (m
q¯q <70 GeV or
>110 GeV) and either the lower or higher mass region, taking the larger of the two as the systematic uncertainty. If the resulting uncertainty is smaller than the statistical uncertainty of the normalization correction from the nominal control region, the latter is used as systematic uncertainty.
The uncertainty of the shape corrections is estimated by the uncertainty on the slope parameter in the
linear fit function. The combined normalization and shape uncertainties vary as a function of m
ℓℓj j/Jand
ranges approximately from 6% to 9% in the LR, 2% to 8% in the HR, and 11% to 47% in the MR. For all
simulated samples, detector related systematic uncertainties including the small-R jet energy scale and
resolution, large-R jet energy, mass and momentum balance scales and resolutions, the lepton reconstruc-
tion and identification efficiencies, and lepton momentum scales and resolutions are also considered. The
large-R jet energy and mass scale uncertainties are evaluated by comparing the ratio of the calorimeter to
0 500 1000 1500 2000 2500
Events / GeV
10-4
10-3
10-2
10-1
1 10 102
103
104
105 Data
Z+jets ZZ/ZW/WW
+Single Top t t
Sys+Stat Uncertainty G*, m=500 GeV
10.0 Nominal× σ ATLAS Preliminary
= 8 TeV s
L dt = 20.3 fb-1
∫
Res. Region Low-pT
Channel µ µ ee,
→ Z
[GeV]
mlljj
0 500 1000 1500 2000 2500
Data / BG 0.60.8
1 1.2 1.4
0 500 1000 1500 2000 2500
Events / GeV
10-4
10-3
10-2
10-1
1 10 102
103 Data
Z+jets ZZ/ZW/WW
+Single Top t t
Sys+Stat Uncertainty G*, m=800 GeV
10.0 Nominal× σ ATLAS Preliminary
= 8 TeV s
L dt = 20.3 fb-1
∫
Res. Region High-pT
Channel µ µ ee,
→ Z
[GeV]
mlljj
0 500 1000 1500 2000 2500
Data / BG 0.60.8
1 1.2 1.4
0 500 1000 1500 2000 2500
Events / GeV
10-4
10-3
10-2
10-1
1
Data Z+jets ZZ/ZW/WW
+Single Top t t
Sys+Stat Uncertainty G*, m=1400 GeV
10.0 Nominal× σ ATLAS Preliminary
= 8 TeV s
L dt = 20.3 fb-1
∫
Merged Region Channel µ µ ee,
→ Z
[GeV]
mllJ
0 500 1000 1500 2000 2500
Data / BG
0 1 2 3 4
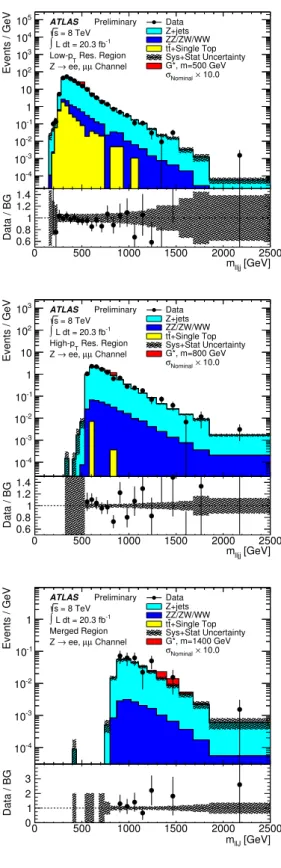
Figure 1: Reconstructed
ℓ+ℓ−j j or
ℓ+ℓ−J mass distributions of observed data and background predictions
after all the selection cuts are applied in the three kinematic regions denoted as the LR (top), HR (middle)
and MR (bottom) in the text. The shaded regions show the full background uncertainty obtained by
adding the statistical and systematic uncertainties in quadrature. The G
∗signal yields expected for masses
of 500, 800 and 1400 GeV with the cross sections scaled by a factor 10 are also shown.
track-based measurements in dijet data and MC, and are validated by in-situ data of high p
TW produc- tion in association with jets. A Kolmogorov–Smirnov test [48] is then performed between the nominal and systematically varied distributions for a given systematic uncertainty source to determine if it has sizable effect on the shape of background estimation. Only significant systematic effects are included in the analysis. For the normalization, if the event yield changes more than half the statistical uncertainty of the nominal yield, the systematic uncertainty is included.
Uncertainties on signal acceptance due to PDF sets, renormalization and factorization scale choices, initial- and final-state gluon radiation (ISR/FSR) modeling, and LHC beam energy uncertainty are also considered. The PDF uncertainties are estimated by taking an acceptance di
fference between CTEQL1 and MSTW2008LO PDFs and adding it in quadrature with the difference between MSTW2008LO er- ror sets. The uncertainties due to the scale and ISR/FSR modeling are estimated by varying relevant parameters in P
8 by a factor of 2 and 0.5. The beam energy systematic uncertainty is assessed with simulation by varying the beam energy within the measured uncertainty [50], leading to at most 1%
effect on acceptance. The dominant uncertainty comes from ISR/FSR modeling, which is approximately 5%.
The invariant mass of the diboson system is reconstructed from the
ℓ+ℓ−j j or
ℓ+ℓ−J system. These reconstructed m
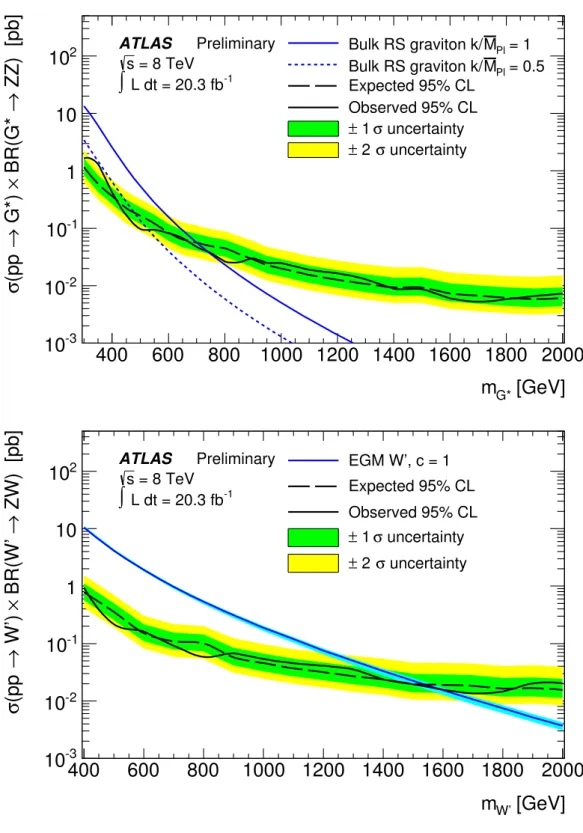
ℓℓj j/Jdistributions for data and expected background events in the three signal regions are shown in Fig. 1 for the combined electron and muon channels. Good agreement is observed between the data and the background predictions with p-values ranging from 0.98 to 0.10 (the p-value is the probability that the background can produce a fluctuation greater than or equal to the excess observed in data). The result is interpreted as 95% CL upper limits on the production cross section times branching ratio for the G
∗and W
′models. These upper limits are determined using the CL
Smodified frequentist formalism [51] with a profile likelihood test statistic [52]. The test statistic is evaluated with a maximum likelihood fit of signal models and background predictions to the reconstructed m
ℓℓj j/Jspectra (corre- sponding to Fig. 1). Systematic uncertainties and their correlations are taken into account as nuisance parameters with Gaussian constraints. The likelihood fit, which takes into account correlations between the systematic uncertainties, is performed simultaneously in all three signal regions for the signal pole mass ranging between 300–850 GeV for the LR, 550–1800 GeV for the HR and 800–2000 GeV for the MR. Figure 2 shows 95% CL upper limits on the production cross section multiplied by the branching fraction into ZZ or ZW as a function of the resonance pole mass. The theoretical predictions for the EGM W
′and the bulk RS G
∗with different coupling constants, shown in the figure, allow to extract observed (expected) lower mass limits of 1590 (1540) GeV for the W
′, and 740 and 540 (700 and 490) GeV for the G
∗with k/ M ¯
Pl =1.0 and 0.5, respectively. The most powerful search region is the LR for masses below 550 GeV, the HR from 500 to 850 GeV and the MR for higher masses.
In summary, a search for a narrow heavy resonance decaying to diboson final states produced in pp collisions at the Large Hadron Collider has been performed. The data sample analysed, corresponding to an integrated luminosity of 20 fb
−1, has been recorded at
√s
=8 TeV with the ATLAS detector. No significant excess over Standard Model background expectation has been found; production cross section and mass exclusion limits are derived for W
′bosons in the theoretical framework of an Extended Gauge Model and for gravitons in warped extra dimensions in the context of a bulk RS model. The results represent a significant improvement over previously reported limits [13] due to increased pp collision energy and data set size as well as the development of new techniques to analyze heavily boosted decays of bosons.
We thank CERN for the very successful operation of the LHC, as well as the support staff from our institutions without whom ATLAS could not be operated efficiently. We acknowledge the support of ANPCyT, Argentina; YerPhI, Armenia; ARC, Australia; BMWF and FWF, Austria; ANAS, Azerbaijan;
SSTC, Belarus; CNPq and FAPESP, Brazil; NSERC, NRC and CFI, Canada; CERN; CONICYT, Chile;
CAS, MOST and NSFC, China; COLCIENCIAS, Colombia; MSMT CR, MPO CR and VSC CR, Czech
[GeV]
m
G*400 600 800 1000 1200 1400 1600 1800 2000
ZZ) [pb] → BR(G* × G*) → (pp σ
10
-310
-210
-11 10 10
2ATLAS Preliminary = 8 TeV
s
L dt = 20.3 fb-1
∫
Pl = 1 M Bulk RS graviton k/
= 0.5 MPl
Bulk RS graviton k/
Expected 95% CL Observed 95% CL uncertainty σ
± 1
uncertainty σ
± 2
[GeV]
m
W’400 600 800 1000 1200 1400 1600 1800 2000
ZW) [pb] → BR(W’ × W’) → (pp σ
10
-310
-210
-11 10 10
2ATLAS Preliminary = 8 TeV
s
L dt = 20.3 fb-1
∫
EGM W’, c = 1 Expected 95% CL Observed 95% CL uncertainty σ
± 1
uncertainty σ
± 2
Figure 2: Observed and expected 95% CL upper limits on the cross section times branching fraction as a function of the resonance pole mass for the G
∗(top) and EGM W
′(bottom). The LO (NNLO) theoretical cross sections for the G
∗(EGM W
′) production with k/ M ¯
Pl =0.5 and 1.0 (c
=1) are also shown. The band around the NNLO W
′cross section represents the theoretical uncertainty on the NNLO calculation.
The inner and outer bands on the expected limits represent
±1σ and
±2σ variations, respectively.
Republic; DNRF, DNSRC and Lundbeck Foundation, Denmark; EPLANET, ERC and NSRF, European Union; IN2P3-CNRS, CEA-DSM/IRFU, France; GNSF, Georgia; BMBF, DFG, HGF, MPG and AvH Foundation, Germany; GSRT and NSRF, Greece; ISF, MINERVA, GIF, I-CORE and Benoziyo Center, Israel; INFN, Italy; MEXT and JSPS, Japan; CNRST, Morocco; FOM and NWO, Netherlands; BRF and RCN, Norway; MNiSW and NCN, Poland; GRICES and FCT, Portugal; MNE/IFA, Romania; MES of Russia and ROSATOM, Russian Federation; JINR; MSTD, Serbia; MSSR, Slovakia; ARRS and MIZÅ, Slovenia; DST/NRF, South Africa; MINECO, Spain; SRC and Wallenberg Foundation, Sweden; SER, SNSF and Cantons of Bern and Geneva, Switzerland; NSC, Taiwan; TAEK, Turkey; STFC, the Royal Society and Leverhulme Trust, United Kingdom; DOE and NSF, United States of America. The cru- cial computing support from all WLCG partners is acknowledged gratefully, in particular from CERN and the ATLAS Tier-1 facilities at TRIUMF (Canada), NDGF (Denmark, Norway, Sweden), CC-IN2P3 (France), KIT
/GridKA (Germany), INFN-CNAF (Italy), NL-T1 (Netherlands), PIC (Spain), ASGC (Tai- wan), RAL (UK) and BNL (USA) and in the Tier-2 facilities worldwide.
References
[1] E. Eichten and K. Lane, Phys. Lett. B
669, 235-238 (2008).[2] S. Catterall, L. Del Debbio, J. Giedt, and L. Keegan, Phys. Rev. D
85, 094501 (2012).[3] J. Andersen et al., Eur. Phys. J. Plus
126, 81 (2011).[4] L. Randall and R. Sundrum, Phys. Rev. Lett.
83, 3370 (1999).[5] L. Randall and R. Sundrum, Phys. Rev. Lett.
83, 4690 (1999).[6] H. Davoudiasl, J. L. Hewett and T. G. Rizzo, Phys. Rev. D
63, 075004 (2001).[7] G. Altarelli, B. Mele, and M. Ruiz-Altaba, Z. Phys. C
45, 109 (1989); erratum-ibid C 47, 676(1990).
[8] K. Agashe et al., Phys. Rev. D
76, 036006 (2007).[9] G. Altarelli, B. Mele, and M. Ruiz-Altaba, Z. Phys. C
45, 109 (1989).[10] V. M. Abazov et al. (D0 Collaboration), Phys. Rev. Lett.
104, 061801 (2010).[11] V. M. Abazov et al. (D0 Collaboration), Phys. Rev. Lett.
107, 011801 (2011).[12] T. Aaltonen et al. (CDF Collaboration), Phys. Rev. D
85, 12008 (2012).[13] ATLAS Collaboration, Phys. Lett. B
712, 331 (2012).[14] ATLAS Collaboration, Phys. Rev. D
87, 112006 (2013).[15] ATLAS Collaboration, arXiv:1406.4456 [hep-ex], submitted to Phys. Lett. B.
[16] ATLAS Collaboration, Phys. Lett. B
718, 860 (2013).[17] CMS Collaboration, arXiv:1405.3447 [hep-ex], submitted to the J. High Energy Phys.
[18] CMS Collaboration, arXiv:1405.1994 [hep-ex], submitted to the J. High Energy Phys.
[19] ATLAS Collaboration, JINST
3(2008) S08003.
[20] ATLAS uses a right-handed coordinate system with the z-axis along the beam pipe. The x-axis points to the center of the LHC ring, and the
y-axis points upward. The pseudorapidity is defined interms of the polar angle
θas
η=−ln(tan(θ/2)).
[21] ATLAS Collaboration, Eur. Phys. J. C
73, 2518 (2013).[22] A. Belyaev, N. Christensen, and A. Pukhov, Comput. Phys. Commun.
184, 1729 (2013).[23] In a previous version of this analysis, the theoretical cross section of the Randall-Sundrum graviton signal was miscalculated and later found to be a factor of 4 too large. This has been corrected by the authors for the signal used in the interpretation of this search.
[24] T. Sjostrand, S. Mrenna, and P. Skands, J. High Energy Phys.
05(2006) 026.
[25] R. Hamberg, W.L. van Neerven, and T. Matsuura, Nucl. Phys. B
359, 343 (1991).[26] J. Pumplin et al., J. High Energy Phys.
0207(2002) 012.
[27] A. D. Martin, W. J. Stirling, R. S. Thorne, and G. Watt, Eur. Phys. J. C
63189 (2009).
[28] T. Gleisberg et al., J. High Energy Phys.
0902(2009) 007.
[29] H.-L. Lai et al., Phys. Rev. D
82074024 (2010).
[30] S. Frixione and B. R. Webber, J. High Energy Phys.
06(2002) 029; S. Frixione, P. Nason, and B. R. Webber, J. High Energy Phys.
08(2003) 007.
[31] G. Corcella et al., J. High Energy Phys. 01 (2001) 010.
[32] J. Butterworth, J. Forshaw, and M. Seymour, Z. Phy. C
72637 (1996).
[33] M. Cacciari et al., Phys. Lett. B
710, 612 (2012).[34] P. B¨arnreuther, M. Czakon, and A. Mitov, Phys. Rev. Lett.
109, 132001 (2012).[35] M. Czakon and A. Mitov, JHEP
1212, 054 (2012).[36] M. Czakon and A. Mitov, JHEP
1301, 080 (2013).[37] M. Czakon, P. Fiedler, and A. Mitov, Phys. Rev. Lett.
110, 252004 (2013).[38] M. Czakon and A. Mitov, arXiv:1112.5675 [hep-ph].
[39] B. P. Kersevan and E. Richter-Was, Comput. Phys. Commun.
184, 919 (2013).[40] J. M. Campbell and R. K. Ellis, Phys. Rev. D
60, 113006 (1999).[41] S. Agostinelli et al. (GEANT4 Collaboration), Nucl. Instrum. Meth. A
506(2003) 250; ATLAS Collaboration, Eur. Phys. J. C
70823 (2010).
[42] ATLAS Collaboration, Eur. Phys. J. C
721909 (2012).
[43] ATLAS Collaboration, arXiv:1404.4562 [hep-ex], submitted to the Eur. Phys. J. C.
[44] M. Cacciari, G. P. Salam, and G. Soyez, J. High Energy Phys.
0804(2008) 063; M. Cacciari and
G. P. Salam, Phys. Lett. B
64157 (2006).
[45] ATLAS Collaboration, Eur. Phys. J. C
732304 (2013).
[46] Yu. L. Dokshitzer, G. D. Leder, S. Moretti, and B. R. Webber, J. High Energy Phys.
9708(1997) 001; M. Wobisch and T. Wengler, arXiv:hep-ph/9907280.
[47] J. M. Butterworth, A. R. Davison, M. Rubin, G. P. Salam, Phys. Rev. Lett.
100242001 (2008).
[48] F. E. James, in Statistical Methods in Experimental Physics, 2nd ed., World Scientific Publishing Co., 316-317 (2006).
[49] ATLAS Collaboration, Report ATL-PHYS-PUB-2014-004 (2014),
http://cdsweb.cern.ch/record/1690048.
[50] J. Wenninger, Report CERN-ATS-2013-040 (2013), http://cdsweb.cern.ch/record/1546734.
[51] A. Read, J. Phys. G
282683 (2002).
[52] G. Cowan, K. Cranmer, E. Gross, and O. Vitells, Eur. Phys. J. C
711554 (2011).
A Auxiliary Material
(0.2)/pT Track
Isolation
0 0.5 1 1.5 2
R(e,e)∆
0 0.1 0.2 0.3 0.4 0.5 0.6 0.7 0.8 0.9 1
ATLAS Simulation Preliminary = 8 TeV s G*, m=2 TeV
ee+qq ZZ → G* →
Nominal Isolation Dilepton Isolation Lepton Isolation
Requirement
R(e,e) = 0.2
∆
(0.2)/pT Track
Isolation
0 0.5 1 1.5 2
)µ, µR(∆
0 0.1 0.2 0.3 0.4 0.5 0.6 0.7 0.8 0.9 1
ATLAS Simulation Preliminary = 8 TeV s G*, m=2 TeV
µ+qq µ ZZ → G* →
Nominal Isolation Dilepton Isolation Lepton Isolation
Requirement
) = 0.2 µ µ,
∆ R(
Figure 3: Track-based relative p
Tisolation with a cone size of R
=0.2 as a function of the distance
∆R(ℓ, ℓ) between the two leptons for the 2 TeV bulk RS
G
∗decaying into a ZZ
→e
+e
−+q q ¯ (left) and
µ+µ−+q q ¯ (right). The dilepton (nominal) isolation is shown by the blue triangles (red dots). The horizontal line corresponds to
∆R(ℓ, ℓ) =0.2 and the vertical line corresponds to the cut applied to the dilepton isolation.
[GeV]
MG*
400 600 800 1000 1200 1400 1600 1800 2000
Efficiency×Acceptance
0 0.1 0.2 0.3 0.4 0.5 0.6 0.7 0.8
Total Acceptance Resolved low-pT
Resolved high-pT
Merged region with dilepton isolation Merged region with nominal lepton isolation ATLAS Simulation Preliminary
= 8 TeV s
eeqq
→
→ ZZ G*
[GeV]
MG*
400 600 800 1000 1200 1400 1600 1800 2000
Efficiency×Acceptance
0 0.1 0.2 0.3 0.4 0.5 0.6 0.7 0.8
Total Acceptance Resolved low-pT
Resolved high-pT
Merged region with dilepton isolation Merged region with nominal lepton isolation ATLAS Simulation Preliminary
= 8 TeV s
µqq µ
→
→ ZZ G*
[GeV]
MW’
400 600 800 1000 1200 1400 1600 1800 2000
Efficiency×Acceptance
0 0.1 0.2 0.3 0.4 0.5 0.6 0.7 0.8
Total Acceptance Resolved low-pT
Resolved high-pT
Merged region with dilepton isolation Merged region with nominal lepton isolation ATLAS Simulation Preliminary
= 8 TeV s
eeqq
→
→ ZW W’
[GeV]
MW’
400 600 800 1000 1200 1400 1600 1800 2000
Efficiency×Acceptance
0 0.1 0.2 0.3 0.4 0.5 0.6 0.7 0.8
Total Acceptance Resolved low-pT
Resolved high-pT
Merged region with dilepton isolation Merged region with nominal lepton isolation ATLAS Simulation Preliminary
= 8 TeV s
µqq µ
→
→ ZW W’
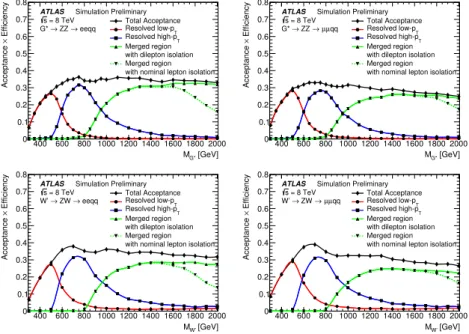
Figure 4: Signal acceptance and selection efficiency of the low-p
T, high-p
T, and merged jet selection
categories for the bulk RS graviton signal (top) and the extended gauge model W’ signal (bottom) in the
electron (left) and muon (right) decay channels. For the merged selection the signal acceptance for the
nominal and dilepton isolation is shown.
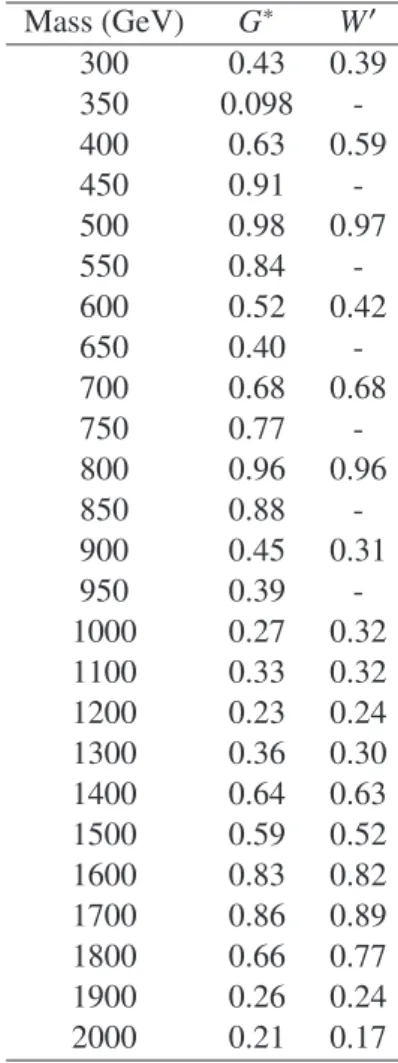
Mass (GeV) G
∗W
′300 0.43 0.39
350 0.098 -
400 0.63 0.59
450 0.91 -
500 0.98 0.97
550 0.84 -
600 0.52 0.42
650 0.40 -
700 0.68 0.68
750 0.77 -
800 0.96 0.96
850 0.88 -
900 0.45 0.31
950 0.39 -
1000 0.27 0.32
1100 0.33 0.32
1200 0.23 0.24
1300 0.36 0.30
1400 0.64 0.63
1500 0.59 0.52
1600 0.83 0.82
1700 0.86 0.89
1800 0.66 0.77
1900 0.26 0.24
2000 0.21 0.17
Table 3: Observed p-value calculated for both the G
∗and W
′signals.
[GeV]
mll
40 60 80 100 120 140 160 180 200
Events / 5 GeV
103
104
105
106
107
108 DataZ+jets
ZZ/ZW/WW +Single Top t t
Stat. Uncertainty G*, m=800 GeV 1000
Nominal× σ ATLAS Preliminary
= 8 TeV s L dt = 20.3 fb-1
∫
ee Channel
→ Z
[GeV]
mll
40 60 80 100 120 140 160 180 200
Events / 5 GeV
103
104
105
106
107
108
Data Z+jets ZZ/ZW/WW
+Single Top t t
Stat. Uncertainty G*, m=800 GeV 1000
Nominal× σ ATLAS Preliminary
= 8 TeV s L dt = 20.3 fb-1
∫
Channel µ µ
→ Z
[GeV]
ll
pT
0 200 400 600 800 1000
Events / 40 GeV
10-2
10-1
1 10 102
103
104
105
106
107
108
109
1010
1011 DataZ+jets
ZZ/ZW/WW +Single Top t t
Stat. Uncertainty G*, m=800 GeV 1000
Nominal× σ ATLAS Preliminary
= 8 TeV s L dt = 20.3 fb-1
∫
ee Channel
→ Z
[GeV]
ll
pT
0 200 400 600 800 1000
Events / 40 GeV
10-2
10-1
1 10 102
103
104
105
106
107
108
109
1010
1011 DataZ+jets
ZZ/ZW/WW +Single Top t t
Stat. Uncertainty G*, m=800 GeV 1000
Nominal× σ ATLAS Preliminary
= 8 TeV s L dt = 20.3 fb-1
∫
Channel µ µ
→ Z
Figure 5: Comparison of the data with the background prediction for the dilepton mass (top) and p
T(bottom) distributions after applying object selection cuts. The dilepton mass cut of 66
<m
ℓ+ℓ− <116 GeV is additionally imposed on the dilepton p
Tdistributions. The normalization and mass shape corrections for the simulated Z
+jets background are not applied in these distributions. The left (right) column shows the distributions for the electron (muon) channel. The rightmost bin includes events in overflow bins.
Signal region LR HR MR
Trigger Single lepton/dilepton triggers
Preselection Primary vertex exists
Event cleaning
Exactly two leptons ( p
T >25 GeV) Isolated (excluding other leptons)
Opposite charge (muon only) 66
<m
ℓℓ<116 GeV
Dilepton p
Tp
ℓℓT >100 GeV p
ℓℓT >250 GeV p
ℓℓT >400 GeV Jet multiplicity
≥2 R=0.4 jets
≥1 R=1.2 jets Dijet p
Tp
Tj j>100 GeV p
Tj j >250 GeV -
Dijet mass 70
<m
j j<110 GeV -
Leading jet p
T- p
TJ >400 GeV
Leading jet mass - 70
<m
J <110 GeV
Leading jet
√yf-
√yf>0.45
Table 4: Summary of selection cuts used in the analysis.
R=0.4) (anti-kT
Njets
Events
10-2
10-1
1 10 102
103
104
105
106
107
108
109
1010
1011 Data
Z+jets ZZ/ZW/WW
+Single Top t t
Stat. Uncertainty G*, m=800 GeV
× 500
Nominal
σ ATLAS Preliminary
= 8 TeV s L dt = 20.3 fb-1
∫
Channel µ µ ee,
→ Z
0 1 2 3 4 5 6 7 8 9
(C/A R=1.2 + Split/Filtered) Njets
0 1 2 3 4 5
Events
10-2
10-1
1 10 102
103
104
105
106
107
108
109
1010
1011 Data
Z+jets ZZ/ZW/WW
+Single Top t t
Stat. Uncertainty G*, m=1400 GeV
× 500
Nominal
σ ATLAS Preliminary
= 8 TeV s L dt = 20.3 fb-1
∫
Channel µ µ ee,
→ Z
0 1 2 3 4
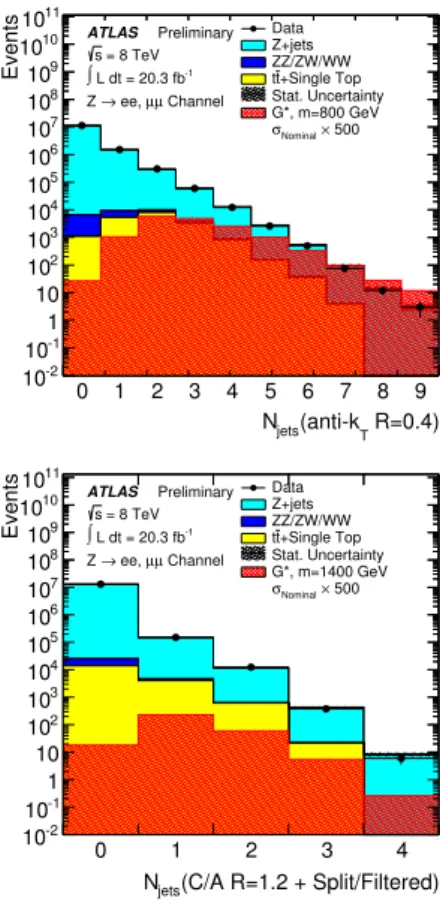
Figure 6: Data and background prediction for the number of jets reconstructed with the anti-k
talgorithm with R=0.4 (top) used in the LR and HR and the Cambridge-Aachen algorithm with R=1.2 and groomed with the split and filtering algorithm used in the MR (bottom). The dilepton mass cut of 66
<m
ℓ+ℓ− <116 GeV is required. The normalization and mass shape corrections for the simulated Z
+jets background
are not applied in these distributions. The electron and muon channels are combined. The rightmost bin
includes events in overflow.
[GeV]
jj
pT
0 200 400 600 800 1000
Events / 40 GeV
10-2
10-1
1 10 102
103
104
105
106
107 DataZ+jets
ZZ/ZW/WW +Single Top t t
Stat. Uncertainty G*, m=500 GeV
× 20
Nominal
σ ATLAS Preliminary
= 8 TeV s L dt = 20.3 fb-1
∫
Channel µ µ ee,
→ Z
[GeV]
jj
pT
0 200 400 600 800 1000
Events / 40 GeV
10-2
10-1
1 10 102
103
104
105
106 Data
Z+jets ZZ/ZW/WW
+Single Top t t
Stat. Uncertainty G*, m=800 GeV
× 20
Nominal
σ ATLAS Preliminary
= 8 TeV s L dt = 20.3 fb-1
∫
Channel µ µ ee,
→ Z
[GeV]
mjj
0 100 200 300 400 500
Events / 20 GeV
0 2000 4000 6000 8000
10000 Data
Z+jets ZZ/ZW/WW
+Single Top t t
Stat. Uncertainty G*, m=500 GeV
× 20
Nominal
σ ATLAS Preliminary
= 8 TeV s L dt = 20.3 fb-1
∫
Channel µ µ ee,
→ Z
[GeV]
mjj
0 100 200 300 400 500
Events / 20 GeV
0 100 200 300 400 500 600
Data Z+jets ZZ/ZW/WW
+Single Top t t
Stat. Uncertainty G*, m=800 GeV
× 20
Nominal
σ ATLAS Preliminary
= 8 TeV s L dt = 20.3 fb-1
∫
Channel µ µ ee,
→ Z
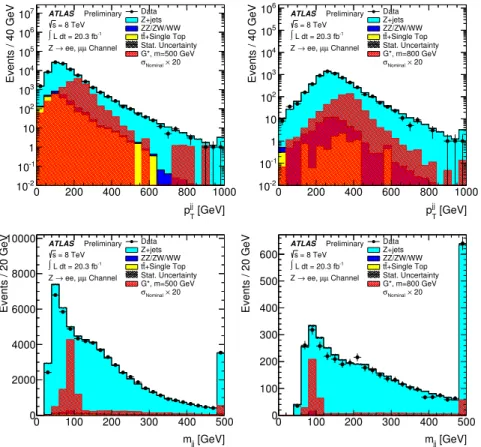
Figure 7: Comparison of the data with the background prediction for the dijet p
T(top) and mass (bottom)
distributions for the combined electron and muon channels. The dilepton mass and p
Trequirements of
66
<m
ℓ+ℓ− <116 GeV and p
ℓT+ℓ− >100 (250) GeV are imposed on the distributions in the left (right)
column. The normalization and mass shape corrections for the simulated Z
+jets background are not
applied in these distributions. The shoulder structure in the dijet mass distributions is originated from
the kinematics of two jet system. The left (right) column shows the distributions in the low- p
T(high-p
T)
resolved regions. The rightmost bin includes events in overflow.
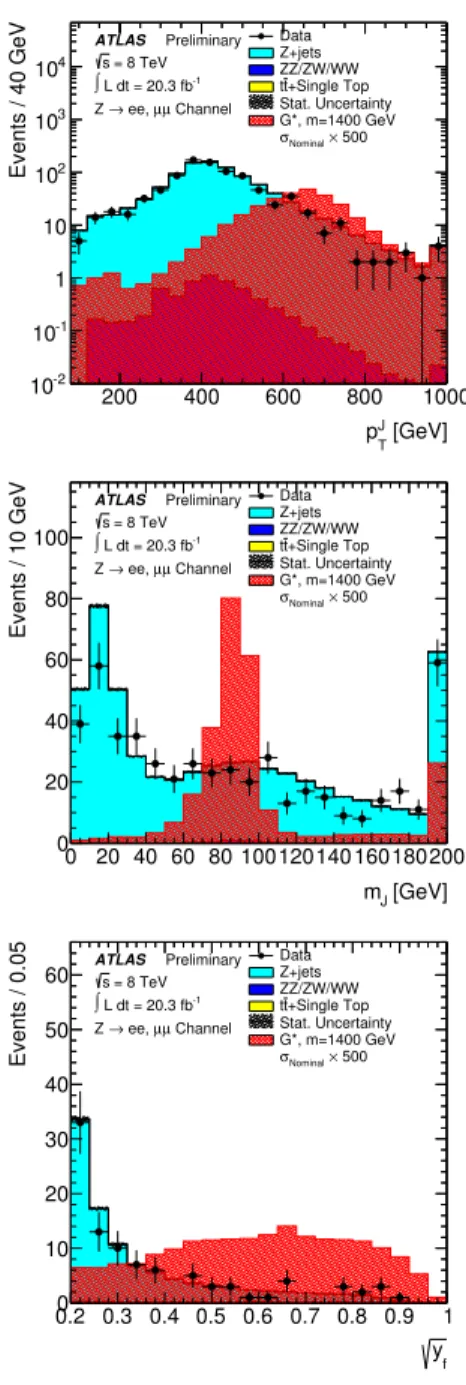
[GeV]
J
pT
200 400 600 800 1000
Events / 40 GeV
10-2
10-1
1 10 102
103
104
Data Z+jets ZZ/ZW/WW
+Single Top t t
Stat. Uncertainty G*, m=1400 GeV
× 500
Nominal
σ ATLAS Preliminary
= 8 TeV s L dt = 20.3 fb-1
∫
Channel µ µ ee,
→ Z
[GeV]
mJ
0 20 40 60 80 100120140 160180200
Events / 10 GeV
0 20 40 60 80 100
Data Z+jets ZZ/ZW/WW
+Single Top t t
Stat. Uncertainty G*, m=1400 GeV
× 500
Nominal
σ ATLAS Preliminary
= 8 TeV s L dt = 20.3 fb-1
∫
Channel µ µ ee,
→ Z
yf
0.2 0.3 0.4 0.5 0.6 0.7 0.8 0.9 1
Events / 0.05
0 10 20 30 40 50 60
Data Z+jets ZZ/ZW/WW
+Single Top t t
Stat. Uncertainty G*, m=1400 GeV
× 500
Nominal
σ ATLAS Preliminary
= 8 TeV s L dt = 20.3 fb-1
∫
Channel µ µ ee,
→ Z