A TLAS-CONF-2013-015 13/05/2013
ATLAS NOTE
ATLAS-CONF-2013-015
March 5, 2013
Search for resonant WZ → ℓν ℓ ′ ℓ ′ production using √
s = 8 TeV pp collisions with ATLAS
The ATLAS Collaboration
Abstract
A search is presented for a resonant state decaying to WZ with the subsequent decays of both W and Z involving electrons or muons. The data represent an integrated luminosity of 13 fb
−1recorded by the ATLAS detector in √
s = 8 TeV pp collisions at the LHC. No significant localized excess is observed in the reconstructed WZ invariant mass distribution.
Upper limits on the production cross section times branching ratio are derived and bounds on the resonant mass are obtained in the context of benchmark Extended Gauge and Low Scale Technicolor models.
c Copyright 2013 CERN for the benefit of the ATLAS Collaboration.
Reproduction of this article or parts of it is allowed as specified in the CC-BY-3.0 license.
1 Introduction
The search for diboson resonances is a sensitive probe of the mechanism of electroweak symmetry break- ing (EWSB). Such resonances can be, besides the Standard Model (SM) Higgs boson, new states pre- dicted by scenarios beyond the SM such as a technirho and other technimesons in Technicolor mod- els [1, 2, 3, 4], or a new heavy gauge boson in composite Higgs models [5, 6], or Little Higgs mod- els [7]. A simple benchmark model conventionally used is the extended gauge model (EGM) [8] where a W
′has the same fermionic couplings as the W boson of the SM but the triple gauge coupling W
′WZ is suppressed with respect to that of the SM, such that its width remains proportional to its mass:
g
W′WZ= g
WWZ× (m
Wm
Z/m
2W′), where g
WWZis the SM WWZ coupling strength, g
W′WZis the W
′WZ coupling strength, m
W, m
Zand m
W′are the masses of the W, Z and W
′bosons.
This note describes the search for a charged resonance decaying to WZ in the three charged leptons (ℓ = e, µ) and one neutrino final state. The dataset used corresponds to an integrated luminosity of 13 fb
−1, collected by the ATLAS detector at the Large Hadron Collider (LHC) in pp collisions at a center- of-mass energy of √
s = 8 TeV during the 2012 run. An earlier measurement performed with 1 fb
−1at 7 TeV center of mass energy is described in Ref. [9].
Two benchmark models are used to interpret the results: the EGM with a heavy W
′boson, and the Low Scale Technicolor (LSTC) model [1, 2]. Strong bounds exist from W
′→ ℓν searches [10, 11, 12, 13, 14] on the mass of a sequential standard model W
′, similar to the EGM W
′, but for which the coupling to WZ is absent. The W
′→ WZ search presented in this paper is thus independent of, and complementary to, W
′→ ℓν searches. Searches for the EGM W
′in the WZ channel have been performed at the Tevatron and have excluded W
′bosons with a mass between 180 GeV and 690 GeV at 95% confidence level (CL) [15, 16]. The CMS experiment has searched for EGM W
′bosons, excluding masses below 1143 GeV [17].
Although a Higgs-like boson has been discovered at the LHC, technicolor models remain a viable option as a model of EWSB [18, 19, 20]. In the LSTC model, technimesons with narrow widths which decay to WZ are predicted. Examples are the lightest vector technirho, ρ
T, and its axial-vector partner the techni-a, a
T. A previous search in the WZ decay channel was performed by the DØ experiment, excluding ρ
Ttechnimesons with a mass between 208 GeV and 408 GeV at 95% CL under the specific mass hierarchy assumption m
ρT< m
πT+ m
W, where m
ρT, m
πTare the masses of the technirho and technipion, respectively [21]. Assuming the same mass hierarchy, CMS has excluded technirho masses between 180 GeV and 938 GeV [17]. With an alternative assumption m
πT=
34m
ρT− 25 GeV, CMS has excluded technirho between 167 GeV and 687 GeV at 95% CL [17].
2 The ATLAS Detector
The ATLAS detector [22] is a general-purpose particle detector with a forward-backward symmetric cylindrical geometry and almost 4π coverage in solid angle. ATLAS uses a right-handed Cartesian co- ordinate system with its origin at the nominal interaction point (IP) in the centre of the detector and the z-axis along the beam pipe. The x-axis points from the IP to the centre of the LHC ring, and the y-axis points upward. Cylindrical coordinates (r, φ) are used in the transverse (x, y) plane, φ being the azimuthal angle around the beam pipe. The rapidity of a particle is defined in terms of the 4-momentum as y =
12ln
E+pE−pzz
, where E and p
zare the particle’s total energy and momentum along the z-axis. The
pseudorapidity is defined in terms of the polar angle θ as η = − ln tan(θ/2). The inner tracking de-
tector (ID) covers the pseudorapidity range | η | < 2.5 and consists of a silicon pixel detector, a silicon
microstrip detector (SCT), and a transition radiation tracker (TRT). The ID is surrounded by a thin su-
perconducting solenoid providing a 2 T magnetic field and by a hermetic calorimeter system, which
provides three-dimensional reconstruction of particle showers up to | η | = 4.9. For | η | < 2.5, the elec-
tromagnetic calorimeter is finely segmented and uses lead as absorber and liquid argon (LAr) as active material. The hadronic calorimeter uses steel and scintillating tiles in the barrel region, while the endcaps use LAr as the active material and copper as absorbers. The forward calorimeter also uses LAr as active medium with copper and tungsten as absorber. The muon spectrometer (MS) is based on one barrel and two endcap air-core toroids, each consisting of eight superconducting coils arranged symmetrically in azimuth. Three layers of precision tracking stations, consisting of drift tubes and cathode strip chambers, allow precise muon momentum measurement up to | η | < 2.7. Resistive plate and thin-gap chambers provide muon triggering capability up to | η | < 2.4.
3 Monte Carlo Simulation
The simulation of the EGM W
′events is done using the P [23, 24] event generator, with the modi- fied leading-order (LO
∗) [25] parton distribution function (PDF) set MSTW2008 LO [26]. Samples are produced for masses ranging from 200 GeV to 2 TeV with a 200 GeV spacing.
The LSTC samples are simulated with P with the following parameters: number of technicolors N
T C= 4, charges of up-type and down-type technifermions Q
U= 1, Q
D= 0, and mixing angle between technipions and electroweak gauge bosons sin χ = 1/3. The branching ratio BR(ρ
T→ WZ) depends on the masses of the π
Tand the ρ
T, and therefore the two-dimensional parameter plane { m
ρT, m
πT} is investigated. In addition, the relation m
ρT= m
πT+m
Wwith BR(ρ
T→ WZ) ∼ 98% is used as a benchmark when quoting a limit on the ρ
Tmass. The mass of a
Talso affects the branching ratios to gauge bosons.
Two scenarios for the value of the mass of the a
Ttechnimeson are considered: m
aT= 1.1 × m
ρTand m
aT≫ m
ρT.
The dominant irreducible background for this search, the SM WZ production, is modeled at next- to-leading-order (NLO) by P 4 [27, 28, 29], incorporating the QCD matrix elements into the parton shower using P 8.162 [24] with CT10 parton density function [30]. P [31] is used to model QED initial and final state radiations.
The main reducible backgrounds are from the following SM processes: (i) ZZ → 4ℓ, where one of the leptons is not detected or fails the selection requirements. This process is simulated at NLO using P ; (ii) W → ℓν + γ, Z( → ℓℓ) + γ, where the photon is misidentified as an electron. This is modeled with 2.1.4 [32] and S 1.4.0 [33] respectively; The cross sections for these two processes are taken from the NLO prediction computed with [34, 35]. (iii) W/Z production in association with jets, when either one jet is reconstructed as a lepton. The W/Z+ jets process is modeled at NLO using P ; (iv) t t ¯ and single top events, where isolated leptons result from W decays and misidentification of jets. These are simulated at NLO using @ 4.0.6 [36] and [37]. The Monte Carlo (MC) samples for the W /Z+ jets, t¯ t and single top backgrounds are only used to cross-check the data-driven estimates.
In order to simulate the effect of multiple pp interactions (pileup), low p
Tnon-diffractive scattering (minimum bias) events, are added to the hard interaction process of the MC samples, reflecting the conditions of the data in the acquisition periods. Finally, the ATLAS detector response [38] for all simulated samples is based on the G 4 program [39].
4 Event Selection
Selected data events are required to have all relevant components of the ATLAS detector in good work-
ing condition. An online trigger requires at least one isolated lepton (electron or muon) achieving full
efficiency for electrons of muons with transverse momentum above 24 GeV. At each crossing of the pro-
ton bunches, multiple collisions can occur. The primary vertex of the event, from which the leptons are
required to originate, is defined as the reconstructed vertex with the largest sum of squared transverse momenta of its associated tracks.
Electrons are selected by imposing certain medium conditions, similar to those defined in Ref. [40], on the shower shape in the electromagnetic calorimeter and a match between the calorimetric energy cluster and a track in the inner detector. They are reconstructed in the pseudorapidity range | η | < 2.47, excluding the barrel-endcap transition region 1.37 < | η | < 1.52. To suppress electrons from converted photons, a hit is required in the first layer of the pixel detector if the track traversed an active detec- tor component. Track-based and calorimeter-based isolation requirements are applied to the candidate electron. The transverse energy deposited around the core electromagnetic cluster, E
Cone30T, in a cone of
∆R ≡ p
(∆φ)
2+ (∆η)
2= 0.3 around the electron is required to satisfy the condition E
Cone30T/E
T< 0.16, where E
Tis the transverse energy of the electron. The scalar sum of the transverse momenta of tracks sur- rounding the electron track in a cone of radius ∆R = 0.3, p
Cone30T, is required to satisfy p
Cone30T/p
T< 0.16 Muon candidates are required to be reconstructed in both the ID and the MS and their momenta obtained from a combined fit to tracks in these subdetectors. To ensure that the tracks are well measured, minimum requirements are imposed on the number of hits in each of the ID subsystems. Track-based isolation and calorimeter-based isolation requirements are also applied: The transverse energy deposited around the muon track, E
Cone30T, in a cone of ∆R = 0.3 around the muon is required to satisfy the condition E
Cone30T/p
T< 0.20 when the muon transverse momentum p
Tis less than 25 GeV and E
Cone30T/ p
T<
0.014 × p
T− 0.1 otherwise. the scalar sum of the transverse momenta of tracks surrounding the muon track in a cone of radius ∆R = 0.3, p
Cone30T, is required to satisfy p
Cone30T/ p
T< 0.15 when the muon transverse momentum p
Tis less than 25 GeV, and p
Cone30T< 0.01 × p
T− 0.105 GeV otherwise. The muons are required to be within | η | < 2.4.
For both muons and electrons, the track associated with the lepton is required to have an origin consistent with the primary vertex by requiring that the transverse impact parameter with respect to the primary vertex, d
0, satisfy the requirement | d
0| /σ(d
0) < 3, where σ(d
0) is the estimated uncertainty, and the longitudinal impact parameter with respect to the primary vertex z
0satisfy the requirement of
| z
0sin θ | < 0.4 mm for electrons and 1 mm for muons. Finally, in the case of simulated leptons, correction factors obtained from performance studies are applied to the reconstruction efficiencies, energy (electron) or momentum (muon) scale and resolution in order to match the measured response in data.
Jets are used in this analysis for the data-driven estimation of lepton fake factors (see below). They are reconstructed from calorimetric energy clusters using the anti-k
talgorithm [41] with a radius parameter of 0.4 and calibrated to the hadronic scale using MC-based corrections. They are required to have a transverse momentum p
T> 25 GeV and fall in the region | η | < 4.5. Quality cuts are applied to remove jets not associated with the primary event vertex. Since electrons produce calorimetric energy clusters, only those reconstructed jets separated by ∆R > 0.3 from an electron are kept.
The transverse missing energy, E
missT, is defined as the magnitude of the momentum imbalance in the plane transverse to the beam direction. This transverse energy is computed using clusters found within the range | η | ¡ 4.5 and using calibrated reconstructed objects: electrons, photons, hadronically decaying τ-leptons, jets, muons and unassociated calorimetric energy clusters [42].
To select WZ candidates, events are kept only if they have exactly three leptons of p
T> 25 GeV and no fourth lepton with p
T> 20 GeV. Then, among the three leptons, a pair must have the same flavour, be of opposite sign and have an invariant mass within 20 GeV of the Z boson mass. They are classified according to their composition in lepton flavour: eνee, µνee, eνµµ and µνµµ and analyzed separately before being combined. A value of E
Tmissabove 25 GeV is required. The measured E
missTvector is as- sumed to be the neutrino ~ p
νTand the longitudinal momentum p
νzis then obtained by solving the quadratic equation which results when fixing the invariant mass of the third charged lepton and the neutrino to the mass of the W boson. The solution with the smallest | p
νz| is selected, but if the determinant is negative only the real part is kept. The W transverse mass, defined as m
WT=
q
2p
ℓTE
missT(1 − cos ∆φ), where p
ℓTis
the transverse momentum of the charged lepton and ∆φ is the opening angle between the lepton and the E
missT, is required to be less than 100 GeV in order to suppress events with poorly reconstructed E
missTor in which the E
Tmissis not due to the neutrino from an on-shell W decay. If the lepton associated with the W decay is an electron, a tight selection criterion [40] is applied on this electron. The irreducible background from non-resonant WZ production is reduced by imposing cuts on the difference in rapidity and azimuthal angle of the reconstructed W and Z: ∆y(W , Z) < 1.8 and ∆φ(W , Z) > 2.6. This set of selection criteria defines the signal region. Both the ∆y and ∆η cuts increase the sensitivity for all signal resonance masses of 200 GeV and beyond.
5 Background Estimation
The background from diboson final states (WZ, ZZ and Zγ) is estimated by MC simulation. The reducible background from ℓℓ+ jets (Z+ jets, t¯ t and Wt) involves objects known as fake leptons; this includes both misidentified jets and the leptonic decay of heavy flavor hadrons. The rate of such fake leptons is evaluated by a data-driven method, described below, since the simulation may not reliably model fake leptons. The contributions from ℓ+jets (W+jets, top production) and multijet processes where more than one jet is reconstructed as a lepton are found to be negligible. A dijet enriched sample, containing single reconstructed leptons, is used for the fake rate estimate. The fake rate obtained is then cross- checked using a Z-tagged sample and the difference between the two estimates is treated as systematic uncertainty, typically of order 25%. A control region, where no WZ resonance signal is expected, defined by the inversion of the boson angular cuts ∆y(W, Z) > 1.8 or ∆φ(W , Z) < 2.6 is used to assess the quality of this background modeling.
To estimate the ℓℓ+jets background, two different selection criteria for leptons are defined: good and bad, where good refers to the nominal object selection used for the signal region and bad signifies that the lepton satisfies all but some selected lepton quality criteria. Using only a loose single lepton trigger, a dijet enriched sample is obtained and used for the fake lepton rate evaluation. The jet with highest transverse momentum, having p
T> 25 GeV and | η | < 2.5 is used as a tag jet while the next jet, probe jet, is checked as a candidate good or bad lepton. To suppress the contaminations from W+jets events in the jet+good lepton region, the transverse mass of the lepton candidate and E
Tmisssystem is required to be smaller than 40 GeV. The lepton candidate is required to be back-to-back with the tag jet in the azimuthal angle with ∆φ > 2.5. The contaminations from the electroweak processes, mainly W+jets and Z+ jets events which make up around 25% of the jet +good lepton events in the low p
Tregion and dominate the high p
Tregion, are estimated using the simulation and subtracted. A 10% uncertainty is assigned to the subtraction of electroweak contamination to cover the uncertainties associated with the cross section and other detector e ff ects. The ratio of the number of jets that pass the good quality lepton criteria to the number that pass the bad quality lepton criteria defines the lepton fake factor. This fake factor is then applied to samples selected with two good quality leptons and one bad quality lepton to estimate the ℓℓ+ jets background, after all other nominal selection criteria have been applied.
Defining a bad muon as one which passes all cuts but fails the isolation criteria, the muon fake factor is found, by applying the similar method to a single muon trigger data, to decrease from 18 % to 4 % as the muon p
Tincreases from 25 to 70 GeV. A systematic error on the fake factor, typically 25%, is estimated by varying the choice of muon trigger, the tag jet p
T, the flavor content of the tag jet, and by accounting for the uncertainty in the subtraction of other SM backgrounds. Similarly, bad electrons are defined as those that pass the medium quality criteria (see Sect. 4) but fail the isolation requirement. The fake factor obtained is found to be approximately 20-25% for p
T(e) in the range 25-100 GeV, with an estimated uncertainty between 20 and 30%.
The use of a Z-tagged fake factor mitigates a number of systematic uncertainties in the dijet tagged
method. Using Z-tagged events ensures that the composition, flavor, and kinematics of jets faking lep-
tons is consistent between the measurement and application of the fake factor. However, the statistical uncertainty for Z+ good lepton events dominates in the Z-tagged fake factor estimate. For the Z-tagged method, the electron fake factor is measured in events with a reconstructed Z as in the analysis cuts, E
missT< 25 GeV and M
T(W) < 40 GeV and | m
ℓℓℓ− m
Z| > 20 GeV. The former two cuts suppress WZ contamination and the last cut suppresses Zγ where the photon is mis-reconstructed as an electron. The muon fake factor is measured in events with a reconstructed Z as in the analysis cuts and a third muon with | d
0| /σ(d
0) > 3. A correction from high d
0to low d
0fake muons is estimated via MC. In both cases, good and bad leptons are defined as in the dijet method, except for the muon d
0cut, which is ignored.
Inverting the d
0cut suppresses prompt W decay muons from WZ processes. The results of the dijet and Z-tagged fake factor methods are found to be compatible. Because the overall uncertainty is smaller for the dijet tagged method, the result from the dijet method is used as the central value for the data driven backgrounds.
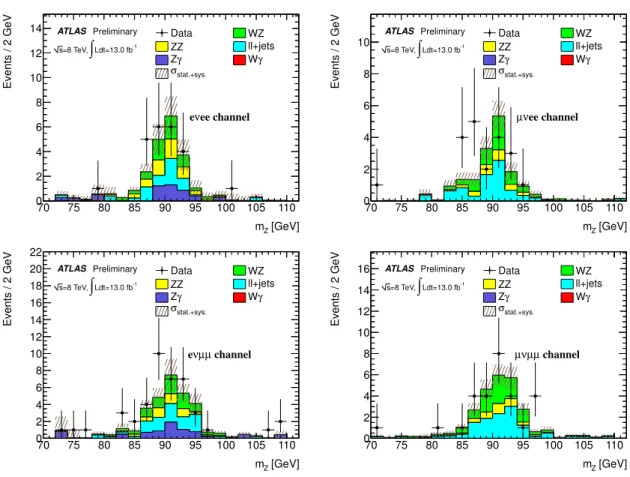
To make sure that the ℓℓ+jets background is well understood, a Z+jet control region is defined which is orthogonal to the signal region, but where a large fraction of events originating from the ℓℓ+jets background is expected: the event selection is the same as for the signal region except that E
Tmiss< 25 GeV and the W transverse mass M
T(W) < 25 GeV. Reasonable agreement between data and predictions can be seen in all lepton channels in Fig. 1.
Since the dominant SM WZ background is estimated by MC simulation, a WZ control region, disjoint
[GeV]
mZ
70 75 80 85 90 95 100 105 110
Events / 2 GeV
0 2 4 6 8 10 12
14 ATLAS Preliminary Ldt=13.0 fb-1
∫
=8 TeV, s
ee channel ν e
Data WZ
ZZ ll+jets
γ
Z Wγ
stat.+sys.
σ
[GeV]
mZ
70 75 80 85 90 95 100 105 110
Events / 2 GeV
0 2 4 6 8 10
ATLAS Preliminary Ldt=13.0 fb-1
∫
=8 TeV, s
ee channel ν µ
Data WZ
ZZ ll+jets
γ
Z Wγ
stat.+sys.
σ
[GeV]
mZ
70 75 80 85 90 95 100 105 110
Events / 2 GeV
0 2 4 6 8 10 12 14 16 18 20 22
ATLAS Preliminary Ldt=13.0 fb-1
∫
=8 TeV, s
channel µ µ ν e
Data WZ
ZZ ll+jets
γ
Z Wγ
stat.+sys.
σ
[GeV]
mZ
70 75 80 85 90 95 100 105 110
Events / 2 GeV
0 2 4 6 8 10 12 14
16 ATLAS Preliminary Ldt=13.0 fb-1
∫
=8 TeV, s
channel µ µ ν µ
Data WZ
ZZ ll+jets
γ
Z Wγ
stat.+sys.
σ
Figure 1: Comparison of the data with the MC prediction for the Z+jets control region selected with
exactly three leptons, E
missT<25 GeV and m
WT<25 GeV: The dilepton invariant mass is shown in the eνee
(top left), µνee (top right), eνµµ (bottom left) and µνµµ (bottom right) channels. The ℓℓ+jet background
is estimated from data using the fake factor measured in the dijet samples.
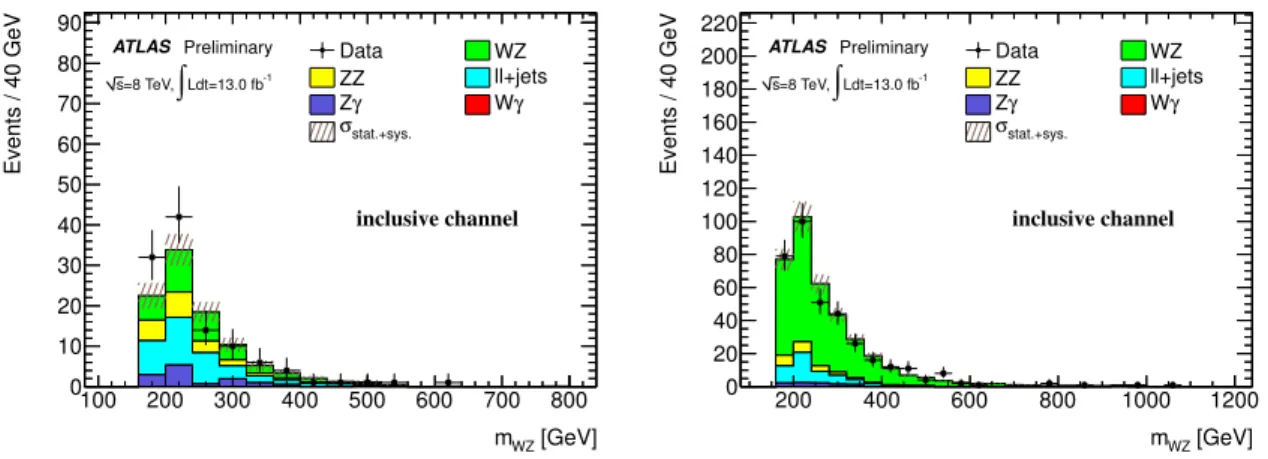
from the signal region, is used to validate its modelling of events similar to those expected to be found in the signal region. The selection of events is the same as in the signal region, except that the cuts on ∆y and ∆φ between the W and Z bosons are reversed. The distribution of events from data and predictions in both the Z+jet control region and WZ control region are shown in Fig. 2.
The number of events in the WZ control region for selected data and MC predictions are summarized in Table 1 for the four individual channels. The ℓℓ+ jets background in these tables are obtained from the data-driven estimation as described above. Good agreement between data and predictions is observed in all four individual channels. Overall, there are 359 events for all channels combined, whereas the SM prediction is 368 ± 5.
Because of the low number of events at high WZ invariant mass, a smooth fit is performed to the MC expected backgrounds to reduce statistical fluctuation and extend the background estimate to a higher mass. For the region M(WZ) > 300 GeV, the distribution of all SM backgrounds except WZ is fitted to a double exponential with fixed normalization to the number of expected events. A double exponen- tial is used as the ansatz because of the potential difference in kinematics between different non-WZ backgrounds. The irreducible SM WZ background is fitted above a mass of 500 GeV to a single expo- nential. Uncertainties associated with the variation of the fit parameters and the variation of the ansatz are considered, with the former covering the later. The stability of the prediction was evaluated by trying different fitting functions, and by varying the initial parameters of the fitting procedure. The statistical uncertainties associated to the fits were found to dominate in the high M(WZ) mass region.
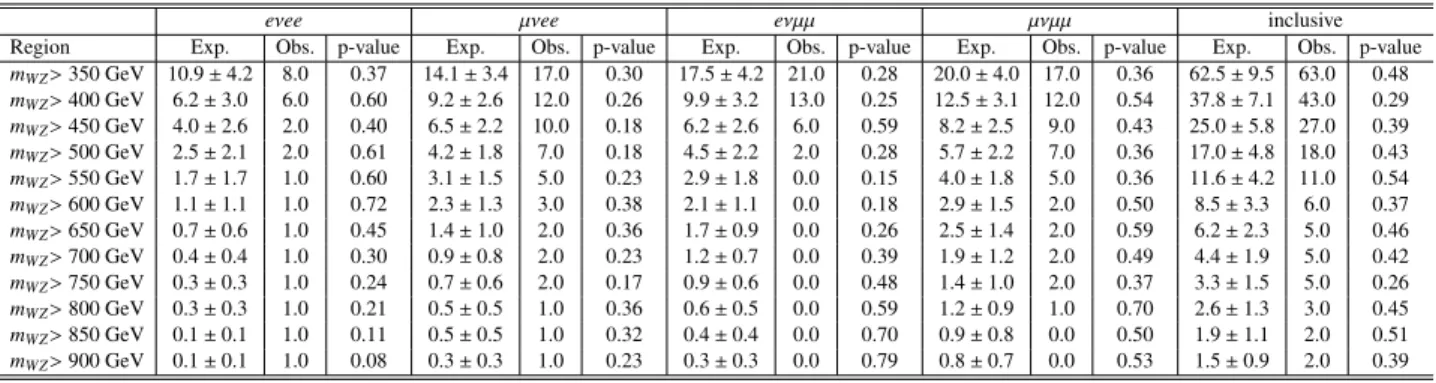
To check the data/MC agreement in the high M(WZ) region, observed and expected numbers of events with m
WZ> 350 - 900 GeV are shown in Table 2, together with the p-value, defined as the probability of the expected background to fluctuate to a number of events equal to or higher than the number of observed events.
6 Systematic Uncertainties
Systematic uncertainties on the inclusive cross sections of the backgrounds are estimated to be 8% for Zγ [43] and 5% for ZZ [44]. For WZ, we take a systematic error of 8.5%, estimated from Ref. [45]
and taking into account a possible 5% effect from higher order contributions [46, 47]. No clear shape difference is observed between predictions of P , S and M G , hence no addition shape systematic uncertainty is applied. A systematic uncertainty associated with the fit used for the back-
[GeV]
mWZ
100 200 300 400 500 600 700 800
Events / 40 GeV
0 10 20 30 40 50 60 70 80 90
ATLAS Preliminary Ldt=13.0 fb-1
∫
=8 TeV, s
inclusive channel
Data WZ
ZZ ll+jets
γ
Z Wγ
stat.+sys.
σ
[GeV]
mWZ
200 400 600 800 1000 1200
Events / 40 GeV
0 20 40 60 80 100 120 140 160 180 200 220
ATLAS Preliminary Ldt=13.0 fb-1
∫
=8 TeV, s
inclusive channel
Data WZ
ZZ ll+jets
γ
Z Wγ
stat.+sys.
σ
Figure 2: Comparison of the WZ invariant mass between data and MC for the Z+jets control region (left)
selected with exactly three leptons, E
missT<25 GeV and m
WT<25 GeV, and the WZ control region (right)
selected with all analysis cuts, but inverting the ∆y and ∆φ cuts between the W and Z bosons.
Channel Data Total background WZ ZZ Zγ ℓℓ+jets eνee 53 67.9 ± 2.4 50.8 ± 1.4 6.7 ± 0.1 4.3 ± 1.5 6.1 ± 1.3
µνee 94 87.8 ± 2.3 70.3 ± 1.6 3.9 ± 0.1 < 0.1 13.6 ± 1.6
eνµµ 102 93.2 ± 2.7 75.2 ± 1.5 5.2 ± 0.2 5.0 ± 1.7 7.8 ± 1.5
µνµµ 110 119 ± 3 95.9 ± 1.7 5.5 ± 0.1 < 0.1 17.7 ± 1.8
Sum 359 368 ± 5 292 ± 3 21.3 ± 0.3 9.3 ± 2.3 45.2 ± 3.1
Table 1: Observed and expected event yields in the SM WZ control region for the eνee, µνee, eνµµ and µνµµ channels. Only statistical uncertainties are included. The theoretical uncertainties in the expected event yields are close to 10%, mainly dominated by the uncertainties on the SM inclusive WZ cross section.
eνee µνee eνµµ µνµµ inclusive
Region Exp. Obs. p-value Exp. Obs. p-value Exp. Obs. p-value Exp. Obs. p-value Exp. Obs. p-value
mWZ>350 GeV 10.9±4.2 8.0 0.37 14.1±3.4 17.0 0.30 17.5±4.2 21.0 0.28 20.0±4.0 17.0 0.36 62.5±9.5 63.0 0.48 mWZ>400 GeV 6.2±3.0 6.0 0.60 9.2±2.6 12.0 0.26 9.9±3.2 13.0 0.25 12.5±3.1 12.0 0.54 37.8±7.1 43.0 0.29 mWZ>450 GeV 4.0±2.6 2.0 0.40 6.5±2.2 10.0 0.18 6.2±2.6 6.0 0.59 8.2±2.5 9.0 0.43 25.0±5.8 27.0 0.39 mWZ>500 GeV 2.5±2.1 2.0 0.61 4.2±1.8 7.0 0.18 4.5±2.2 2.0 0.28 5.7±2.2 7.0 0.36 17.0±4.8 18.0 0.43 mWZ>550 GeV 1.7±1.7 1.0 0.60 3.1±1.5 5.0 0.23 2.9±1.8 0.0 0.15 4.0±1.8 5.0 0.36 11.6±4.2 11.0 0.54 mWZ>600 GeV 1.1±1.1 1.0 0.72 2.3±1.3 3.0 0.38 2.1±1.1 0.0 0.18 2.9±1.5 2.0 0.50 8.5±3.3 6.0 0.37 mWZ>650 GeV 0.7±0.6 1.0 0.45 1.4±1.0 2.0 0.36 1.7±0.9 0.0 0.26 2.5±1.4 2.0 0.59 6.2±2.3 5.0 0.46 mWZ>700 GeV 0.4±0.4 1.0 0.30 0.9±0.8 2.0 0.23 1.2±0.7 0.0 0.39 1.9±1.2 2.0 0.49 4.4±1.9 5.0 0.42 mWZ>750 GeV 0.3±0.3 1.0 0.24 0.7±0.6 2.0 0.17 0.9±0.6 0.0 0.48 1.4±1.0 2.0 0.37 3.3±1.5 5.0 0.26 mWZ>800 GeV 0.3±0.3 1.0 0.21 0.5±0.5 1.0 0.36 0.6±0.5 0.0 0.59 1.2±0.9 1.0 0.70 2.6±1.3 3.0 0.45 mWZ>850 GeV 0.1±0.1 1.0 0.11 0.5±0.5 1.0 0.32 0.4±0.4 0.0 0.70 0.9±0.8 0.0 0.50 1.9±1.1 2.0 0.51 mWZ>900 GeV 0.1±0.1 1.0 0.08 0.3±0.3 1.0 0.23 0.3±0.3 0.0 0.79 0.8±0.7 0.0 0.53 1.5±0.9 2.0 0.39
Table 2: The observed and expected numbers of events in different m
WZregions. The p-value, which is defined as the probability for the expected number of events to fluctuate to the observed number of events or beyond, assuming a Poisson distribution of the expected number of events, is also shown. The relative uncertainties on the expected background were calculated in a conservative fashion by sym- metrizing them in each bin and correlating them between different bins. This together with the statistical fluctuations of each individual channel produces the relative uncertainties shown above.
ground extrapolation is included. This uncertainty is 50% at 800 GeV increasing to 200 % at 1200 GeV.
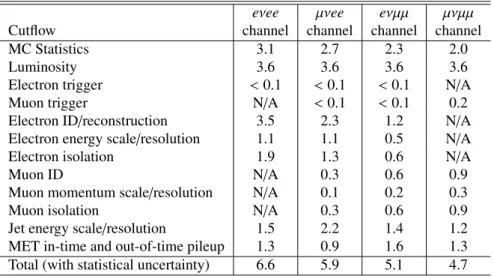
Different sources of experimental systematic uncertainties are summarized in Table 3 for the WZ process. The lepton trigger is almost fully efficient. Its uncertainty, together with the dominant electron reconstruction and identification e ffi ciencies, is measured using the prescriptions described in Ref. [40].
The E
missTuncertainty receives contributions from all reconstructed objects. For calorimeter com- ponents not associated to any objects, the uncertainty contribution is estimated by varying the cluster energy scale. The effects of in-time and out-of-time pileup are also considered through their effects on soft and unclustered energy in the calorimeters as described in Ref. [42].
Finally, the PDF uncertainty in the signal acceptance is evaluated by varying the 20 independent
parameters of the MSTW2008 PDF set and cross-checking with a similar evaluation using the CT10
PDF set. The difference is taken as a further systematic uncertainty. For a W
′mass of 1200 GeV, the
PDF uncertainty is approximately 1%. The theoretical error on the signal cross section is not folded with
other errors in order to allow for reinterpretation of the experimental result in terms of other new physics
models.
eνee µνee eνµµ µνµµ
Cutflow channel channel channel channel
MC Statistics 3.1 2.7 2.3 2.0
Luminosity 3.6 3.6 3.6 3.6
Electron trigger < 0.1 < 0.1 < 0.1 N/A
Muon trigger N/A < 0.1 < 0.1 0.2
Electron ID/reconstruction 3.5 2.3 1.2 N/A
Electron energy scale/resolution 1.1 1.1 0.5 N/A
Electron isolation 1.9 1.3 0.6 N/A
Muon ID N/A 0.3 0.6 0.9
Muon momentum scale/resolution N/A 0.1 0.2 0.3
Muon isolation N/A 0.3 0.6 0.9
Jet energy scale/resolution 1.5 2.2 1.4 1.2
MET in-time and out-of-time pileup 1.3 0.9 1.6 1.3 Total (with statistical uncertainty) 6.6 5.9 5.1 4.7 Table 3: Experimental systematic uncertainties (in %) for the SM WZ process.
7 Results and Interpretation
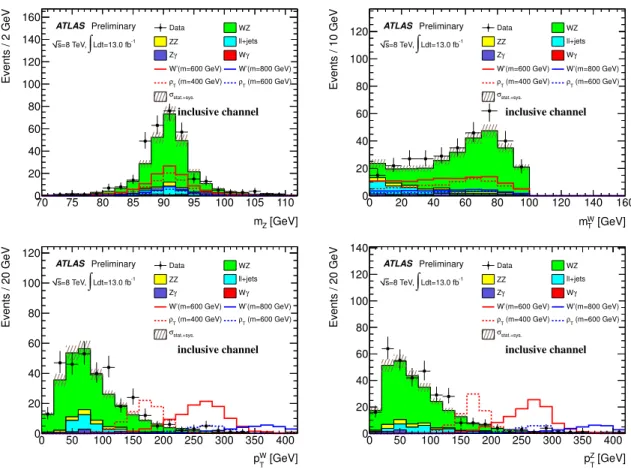
Figure 3 shows various kinematic distributions comparing the data and background estimation with all selection cuts applied in the signal region. Table 5 shows the cut flow table in data for all four channels.
Table 6 shows the expected background yields and the observed data after the signal selection cuts are applied for each channel. Some tension is observed in the µνee and eνµµ channels. The fake background is estimated using the data-driven method detailed in Sect. 5. In total, 324 events have been observed in data with an expectation of SM backgrounds of 286 ± 4 ± 24 events. Table 7 shows the relative selection e ffi ciency for a W
′signal of 800 GeV. The overall acceptance times e ffi ciency is 4 - 9%, depending on the signal point.
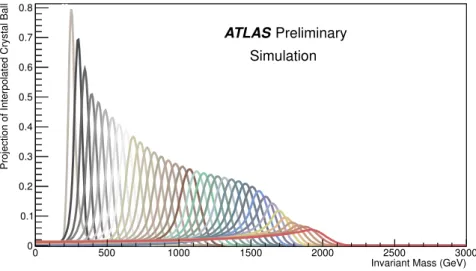
Using a fit to a four-parameter crystal ball function, the WZ resonance mass shapes are fitted and the dependence of the parameters on the W
′mass obtained. This allowed an interpolation to obtain the expected shape of the reconstructed W
′resonance with 50 GeV mass spacing, with corresponding limit for the cross section at these interpolated mass points. The shapes of the signal templates are shown in Fig. 5. For very high pole mass, the reconstructed W
′has a long low-mass tail.
Figure 4 shows the resulting WZ invariant mass distribution in the signal region. The consistency of the observations with the background only hypothesis allows to use this distribution to extract a limit on the W’ signal. This is done with a log-Likelihood ratio method based on a multi-bin counting experiment and the CL
smethod [48]. This frequentist method uses as statistic the ratio CL
sof the confidence level CL
s+bin the presence of a signal, under the hypothesis of signal + background, to the confidence level CL
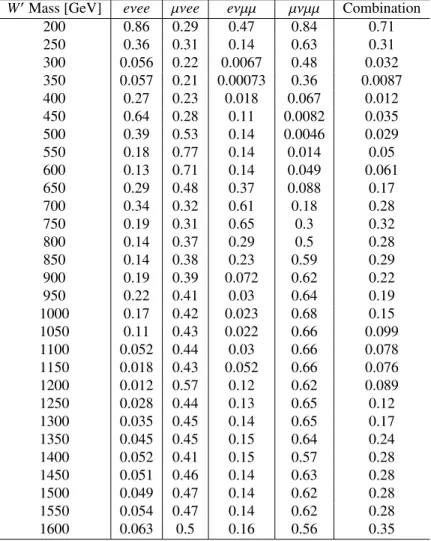
bunder the null hypothesis. The systematic errors are included as nuisance parameters. The p-values for each signal mass hypothesis that were obtained using the interpolation procedure for each channel and for the combination of channels are shown in Table 4.
The limit combination is performed using the same statistical treatment as each individual channel.
Since the channels are orthogonal no statistical correlation between channels is included in this treatment.
Systematic errors coming from the same source, eg: the electron energy scale are correlated across
channels. The observed limit with all the channels combined is shown in Fig. 6. The lower mass limits
on an EGM W
′are shown in Table 8 for the four individual channels as well as for the combination of
all channels. Overall, the excluded cross section is higher than expected by 1 or 2 standard deviations,
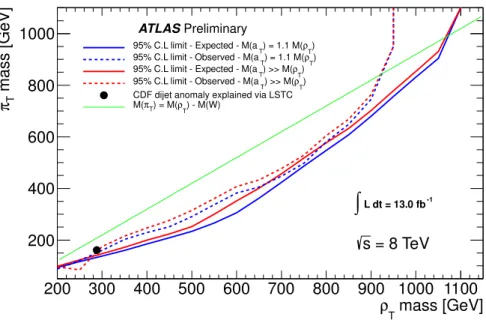
coming primarily from the µνee and eνµµ channels. These limits are also interpreted in the context of
a LSTC model where ρ
T→ WZ. Fig. 7 shows the excluded values of M(ρ
T) versus M(π
T). A mass of
W
′Mass [GeV] eνee µνee eνµµ µνµµ Combination
200 0.86 0.29 0.47 0.84 0.71
250 0.36 0.31 0.14 0.63 0.31
300 0.056 0.22 0.0067 0.48 0.032
350 0.057 0.21 0.00073 0.36 0.0087
400 0.27 0.23 0.018 0.067 0.012
450 0.64 0.28 0.11 0.0082 0.035
500 0.39 0.53 0.14 0.0046 0.029
550 0.18 0.77 0.14 0.014 0.05
600 0.13 0.71 0.14 0.049 0.061
650 0.29 0.48 0.37 0.088 0.17
700 0.34 0.32 0.61 0.18 0.28
750 0.19 0.31 0.65 0.3 0.32
800 0.14 0.37 0.29 0.5 0.28
850 0.14 0.38 0.23 0.59 0.29
900 0.19 0.39 0.072 0.62 0.22
950 0.22 0.41 0.03 0.64 0.19
1000 0.17 0.42 0.023 0.68 0.15
1050 0.11 0.43 0.022 0.66 0.099
1100 0.052 0.44 0.03 0.66 0.078
1150 0.018 0.43 0.052 0.66 0.076
1200 0.012 0.57 0.12 0.62 0.089
1250 0.028 0.44 0.13 0.65 0.12
1300 0.035 0.45 0.14 0.65 0.17
1350 0.045 0.45 0.15 0.64 0.24
1400 0.052 0.41 0.15 0.57 0.28
1450 0.051 0.46 0.14 0.63 0.28
1500 0.049 0.47 0.14 0.62 0.28
1550 0.054 0.47 0.14 0.62 0.28
1600 0.063 0.5 0.16 0.56 0.35
Table 4: The probabilities, or p-value ≡ 1 - CL
b, that the background fluctuates to or above the data in each channel. Systematic uncertainties are included in this calculation.
eνee µνee eνµµ µνµµ
Cutflow Channel Channel Channel Channel
Three leptons and | M
ℓℓ− M
Z| < 20 GeV 201 257 340 349
E
Tmiss>25 GeV 123 193 224 246
m
WT<100 GeV 108 167 200 208
∆y(W , Z) <1.8 98 140 173 177
∆φ(W , Z) > 2.6 55 73 98 98
Table 5: Observed number of events per channel after successive selection criteria are applied.
π
Tbelow the threshold m(π
T) < m(ρ
T) − M(W) modifies the branching ratio BR(ρ
T→ WZ) since the
allowed LSTC decay process ρ
T→ π
TW then becomes accessible, hence making the reinterpretation
of the limits on the cross section in the M(ρ
T) versus M(π
T) plane possible. The 95% CL expected
and observed excluded mass regions in the M(ρ
T) versus M(π
T) plane are shown in Fig. 7, using the
combined four final states assuming the ρ
T→ WZ signal. The CDF dijet anomaly [49] in W+ two jets
events can be explained by LSTC under a certain set of parameters which includes m(ρ
T) = 290 GeV
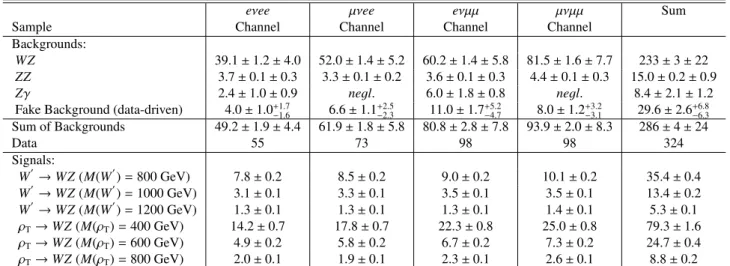
eνee µνee eνµµ µνµµ
Sum
Sample Channel Channel Channel Channel
Backgrounds:
WZ
39.1
±1.2
±4.0 52.0
±1.4
±5.2 60.2
±1.4
±5.8 81.5
±1.6
±7.7 233
±3
±22
ZZ3.7
±0.1
±0.3 3.3
±0.1
±0.2 3.6
±0.1
±0.3 4.4
±0.1
±0.3 15.0
±0.2
±0.9
Zγ2.4
±1.0
±0.9
negl.6.0
±1.8
±0.8
negl.8.4
±2.1
±1.2 Fake Background (data-driven) 4.0
±1.0
+1.7−1.6
6.6
±1.1
+2.5−2.3
11.0
±1.7
+5.2−4.7
8.0
±1.2
+3.2−3.1
29.6
±2.6
+6.8−6.3
Sum of Backgrounds 49.2
±1.9
±4.4 61.9
±1.8
±5.8 80.8
±2.8
±7.8 93.9
±2.0
±8.3 286
±4
±24
Data 55 73 98 98 324
Signals:
W′→WZ
(
M(W′)
=800 GeV) 7.8
±0.2 8.5
±0.2 9.0
±0.2 10.1
±0.2 35.4
±0.4
W′→WZ(
M(W′)
=1000 GeV) 3.1
±0.1 3.3
±0.1 3.5
±0.1 3.5
±0.1 13.4
±0.2
W′→WZ(
M(W′)
=1200 GeV) 1.3
±0.1 1.3
±0.1 1.3
±0.1 1.4
±0.1 5.3
±0.1
ρT→WZ(M(ρ
T)
=400 GeV) 14.2
±0.7 17.8
±0.7 22.3
±0.8 25.0
±0.8 79.3
±1.6
ρT→WZ(M(ρ
T)
=600 GeV) 4.9
±0.2 5.8
±0.2 6.7
±0.2 7.3
±0.2 24.7
±0.4
ρT→WZ(M(ρ
T)
=800 GeV) 2.0
±0.1 1.9
±0.1 2.3
±0.1 2.6
±0.1 8.8
±0.2
Table 6: The estimated background yields, the observed number of data events, and the predicted signal yield after applying the basic signal selection cuts. No selection on the WZ invariant mass is applied.
eνee µνee eνµµ µνµµ
Cutflow Channel Channel Channel Channel
Three leptons 0.085 0.093 0.103 0.114
| M
ℓℓ− M
Z| < 20 GeV 0.954 0.946 0.943 0.948
m
T(W) < 100 GeV 0.916 0.890 0.928 0.913
tight ID W (eν) 0.942 - 0.943 -
E
Tmiss> 25 GeV 0.980 0.974 0.991 0.983
∆y(WZ) < 1.8 0.943 0.943 0.929 0.927
∆φ(WZ) > 2.6 0.977 0.973 0.977 0.978
Total acceptance times efficiency 0.064 0.070 0.076 0.088
Table 7: Relative acceptance times e ffi ciency for each selection cut, and the total acceptance times e ffi - ciency for M(W
′) = 800 GeV.
and m(π
T) = 160 GeV [2].
8 Conclusion
A search for resonant production of a pair of WZ bosons with three charged leptons in the final state has been performed using 13 fb
−1of data collected with the ATLAS detector in pp collisions at √
s = 8 TeV at the Large Hadron Collider. No significant localized excess of events is observed and upper limits on the production cross section times branching ratio of new physics using the reconstructed invariant mass of the WZ system are derived. At 95% CL, EGM W
′bosons with masses up to 1180 GeV are excluded. Assuming the kinematics of the W
′production and decay are valid for the ρ
Ttechnimeson, ρ
Twith masses up to 920 GeV and 920 GeV are excluded for m
aT= 1.1m
ρTand m
aT≫ m
ρTrespectively.
The specific mass hierarchy assumption m
ρT= m
πT+ m
Wand the mixing angle sin χ = 1/3 are used.
[GeV]
mZ
70 75 80 85 90 95 100 105 110
Events / 2 GeV
0 20 40 60 80 100 120 140
160 ATLAS Preliminary Ldt=13.0 fb-1
∫
=8 TeV, s
inclusive channel
Data WZ
ZZ ll+jets
Zγ Wγ
W’(m=600 GeV) W’(m=800 GeV) (m=400 GeV)
ρT ρT (m=600 GeV)
stat.+sys.
σ
[GeV]
WT
m 0 20 40 60 80 100 120 140 160
Events / 10 GeV
0 20 40 60 80 100
120 ATLAS Preliminary Ldt=13.0 fb-1
∫
=8 TeV, s
inclusive channel
Data WZ
ZZ ll+jets
Zγ Wγ
W’(m=600 GeV) W’(m=800 GeV) (m=400 GeV)
ρT ρT (m=600 GeV)
stat.+sys.
σ
[GeV]
W
pT
0 50 100 150 200 250 300 350 400
Events / 20 GeV
0 20 40 60 80 100 120
ATLAS Preliminary Ldt=13.0 fb-1
∫
=8 TeV, s
inclusive channel
Data WZ
ZZ ll+jets
γ
Z Wγ
W’(m=600 GeV) W’(m=800 GeV) (m=400 GeV)
ρT ρT (m=600 GeV)
stat.+sys.
σ
[GeV]
Z
pT
0 50 100 150 200 250 300 350 400
Events / 20 GeV
0 20 40 60 80 100 120 140
ATLAS Preliminary Ldt=13.0 fb-1
∫
=8 TeV, s
inclusive channel
Data WZ
ZZ ll+jets
γ
Z Wγ
W’(m=600 GeV) W’(m=800 GeV) (m=400 GeV)
ρT ρT (m=600 GeV)
stat.+sys.
σ
Figure 3: Comparison of the data with the background estimation for events with all selection cuts applied: dilepton invariant mass (top left), M
TW(top right), W boson p
T(bottom left), and Z boson p
T(bottom right) distributions. The ℓℓ+ jets background is estimated using the fake factor method.
Predictions from W
′and ρ
Tsample signals are also shown.
[GeV]
MWZ
0 200 400 600 800 1000 1200 1400 1600 1800 2000
Events / 40 GeV
20 40 60 80 100 120
γ Z + ZZ ll + jets WZ 2012 Data Total Error Preliminary
ATLAS
Ldt = 13.0 fb-1
∫
= 8 TeV s
[GeV]
MWZ
0 200 400 600 800 1000 1200 1400 1600 1800 2000
Events / 40 GeV
10-4
10-3
10-2
10-1
1 10 102
Z + γ ZZ ll + jets WZ 2012 Data Total Error Preliminary
ATLAS
Ldt = 13.0 fb-1
∫
= 8 TeV s
Figure 4: Comparison of the data with the background estimation for events with all selection cuts
applied and extrapolated backgrounds included: WZ bosons invariant mass with linear (left) and log
scale (right).
Invariant Mass (GeV)
0 500 1000 1500 2000 2500 3000
Projection of Interpolated Crystal Ball
0 0.1 0.2 0.3 0.4 0.5 0.6 0.7 0.8
Preliminary ATLAS
Simulation
Figure 5: Templates of W
′signal with masses between 200 and 2000 GeV in steps of 50 GeV, obtained from interpolating the full-simulated sample distributions as explained in the text, for the eνee channel.
Signal eνee µνee eνµµ µνµµ Combination
[GeV] [GeV] [GeV] [GeV] [GeV]
EGM W
′(expected) 1020 1030 1040 1030 1300 EGM W
′(observed) 1000 1030 900 1030 1180
Table 8: Expected and observed lower mass limits for the EGM W
′boson in the eνee, eνµµ, µνee, µνµµ channels as well as the combination of all channels.
W’ Mass [GeV]
200 400 600 800 1000 1200 1400 1600
BR(WZ) (pb) × σ
10
-11
Expected 95% CL Limit σ
± 1 2 σ
±
W’ EGM Cross Section Observed Limit
Preliminary ATLAS
Ldt = 13.0 fb-1
∫
= 8 TeV s
Figure 6: The expected excluded production cross section limit at 95% CL multiplied by the branching
fraction for the combined eνee, µνee, eνµµ, and µνµµ final state assuming the W
′→ WZ signal.
mass [GeV]
ρ
T200 300 400 500 600 700 800 900 1000 1100 mass [GeV]
Tπ
200 400 600 800
1000
)ρT
) = 1.1 M(
95% C.L limit - Expected - M(aT
T) ρ ) = 1.1 M(
95% C.L limit - Observed - M(aT T) ρ ) >> M(
95% C.L limit - Expected - M(aT T) ρ ) >> M(
95% C.L limit - Observed - M(aT
CDF dijet anomaly explained via LSTC ) - M(W)
ρT
) = M(
πT
M(
L dt = 13.0 fb-1
∫
Preliminary ATLAS