ATLAS-CONF-2012-094 10/07/2012
ATLAS NOTE
ATLAS-CONF-2012-094
July 9, 2012
Search for neutral MSSM Higgs bosons in √
s = 7 TeV pp collisions with the ATLAS detector
The ATLAS Collaboration
Abstract
A search for the neutral Higgs bosons of the Minimal Supersymmetric Standard Model (MSSM) is reported. The analysis is based on a sample of proton-proton colli- sions at a centre-of-mass energy of 7 TeV recorded with the ATLAS detector at the Large Hadron Collider. The data were recorded in 2011 and correspond to an integrated lumi- nosity of 4.7−4.8 fb−1. Higgs boson decays into oppositely-charged muon orτlepton pairs are considered for final states requiring either the presence or absence of b jets.
No statistically significant excess over the expected background is observed and exclu- sion limits at the 95 % confidence level are derived for the production cross section of a generic Higgs boson,φ, as a function of the Higgs boson mass and forh/A/Hproduction in the MSSM as a function of the parameters mA and tanβ in the mmaxh scenario with µ >0.
c Copyright 2012 CERN for the benefit of the ATLAS Collaboration.
Reproduction of this article or parts of it is allowed as specified in the CC-BY-3.0 license.
1 Introduction
Discovering the mechanism responsible for electroweak symmetry breaking is one of the major goals of the physics program at the Large Hadron Collider (LHC) [1]. In the Standard Model (SM) this mechanism requires the existence of a single scalar particle, the Higgs boson [2, 3, 4, 5, 6]. However, the mass of this particle is quadratically divergent due to quantum corrections. This problem can be solved by introducing supersymmetry, a symmetry between fermions and bosons, by which the divergent corrections to the Higgs boson mass are cancelled.
In the Minimal Supersymmetric Standard Model (MSSM) [7, 8], two Higgs doublets are nec- essary, coupling separately to up-type and down-type fermions. This results in five physical Higgs bosons, two of which are neutral and CP-even (h, H)
1, one of which is neutral and CP-odd (A), and two of which are charged (H
±). At tree level their properties can be described in terms of two param- eters, typically chosen to be the mass of the CP-odd Higgs boson, m
A, and the ratio of the vacuum expectation values of the two Higgs doublets, tan β. Couplings to down-type fermions are enhanced with increasing tan β for A and either H or h, while the corresponding couplings to up-type fermions are suppressed with increasing tan β. Additionally, couplings to the Standard Model vector bosons are absent for A and suppressed for either H or h. This has important consequences for both production and decay of neutral MSSM Higgs bosons.
For setting of exclusion limits the analysis is evaluated in the context of the m
maxhbenchmark sce- nario [9] with µ > 0. In the m
maxhscenario the parameters in the ˜ t and ˜ b sector and the gaugino masses are fixed to obtain the maximum possible mass for the lightest CP-even Higgs boson for a given tan β and mass of the CP-odd Higgs boson m
A. This guarantees conservative exclusion bounds from the LEP experiments. The sign of the Higgs sector bilinear coupling µ is generally not constrained, but in the evaluation of the analysis µ > 0 is chosen as this is favoured by the measurements of (g
−2)
µ.
For high tan β in this scenario the masses of the Higgs bosons are such that for m
A< 125 GeV the h and A bosons are degenerate in mass and for m
A> 125 GeV the H and A bosons are degenerate in mass to within a few GeV.
The most common MSSM neutral Higgs production mechanisms at a hadron collider are the b quark annihilation and gluon-fusion processes, the latter of which proceeds primarily through a b quark loop for high tan β. Both processes have cross sections that increase with tan β, with the b- associated production process becoming dominant at high tan β values. In this case the presence of a b jet in the final state can offer improved background rejection. The most common decay modes at high tan β are to a pair of b quarks or τ leptons, with branching ratios close to 90 % and 10 %, respectively, across the mass range considered. Additionally, the direct decay into two muons occurs rarely, with a branching ratio around 0.04 %, but it offers a clean signature.
Previous searches for neutral MSSM Higgs bosons have been performed at LEP [10], the Teva- tron [11, 12, 13] and the LHC [14, 15]. In light of recent results from LHC Standard Model Higgs searches [16, 17], theoretical investigations [18] have demonstrated compatibility between a signif- icant parameter space of the MSSM and an assumed signal at M
h ∼125 GeV, consistent with the lighter CP-even MSSM Higgs boson. In this paper a search using 4.7
−4.8 fb
−1of proton-proton col- lision data collected with the ATLAS detector in 2011 is presented. The µ
+µ
−and τ
+τ
−decay modes are considered, with the latter divided into separate search channels according to the visible particles in the decay of each τ lepton (either an electron, a muon, or one or more hadrons). Each channel is further classified according to jet multiplicity and jet flavour.
1By convention the lighterCP-even Higgs boson is calledh, the heavierCP-even Higgs boson is calledH.
2 The ATLAS detector
The ATLAS detector at the LHC is a multipurpose apparatus with a forward-backward symmetric cylindrical geometry and nearly 4π coverage in solid angle [19]. It consists of an inner detector surrounded by a thin superconducting solenoid providing a 2 T axial magnetic field, electromagnetic and hadronic calorimeters, and a muon spectrometer, incorporating three large superconducting air- core toroid magnets with bending power between 2.0 and 7.5 Tm. The inner detector covers the pseudorapidity
2range
|η
|< 2.5. It consists of silicon pixel, semi-conductor micro-strip, and transition radiation tracking detectors. Lead/liquid-argon (LAr) sampling calorimeters provide electromagnetic (EM) measurements with high granularity. A hadronic (iron/scintillator-tile) calorimeter covers the central pseudorapidity range (
|η
|< 1.7). The end-cap and forward regions are instrumented with LAr calorimeters for both EM and hadronic energy measurements up to
|η
| =4.9. A three-level trigger system is used to select events. The first-level trigger is implemented in hardware and uses a subset of the detector information to reduce the rate to at most 75 kHz. This is followed by two software-based trigger levels that together reduce the event rate to approximately 300 Hz. The trigger requirements were adjusted to changing data-taking conditions in 2011.
3 Data and Monte Carlo simulation samples
The data used in this search were recorded by the ATLAS experiment during the 2011 LHC run with proton-proton collisions at a centre-of-mass energy of 7 TeV. They correspond to an integrated luminosity of approximately 4.7 fb
−1(τ
+τ
−channels) or 4.8 fb
−1(µ
+µ
−channels) after data quality selection criteria to require that all relevant detector sub-systems used in this analysis were operational.
The integrated luminosity has an uncertainty of 3.9 %, measured as described in References [20, 21]
and based on the whole 2011 dataset.
Higgs boson production: The Higgs production mechanisms considered are gluon-fusion and b quark associated production. The cross sections for the first process have been calculated using HIGLU [22] and ggh@nnlo [23]. For b-associated production, a matching scheme described in Ref- erence [24] is used to combine 4-flavour [25, 26] and 5-flavour [27] calculations. The masses, cou- plings, and branching ratios of the Higgs bosons are computed with FeynHiggs [28]. Details of the calculations and associated strong coupling constant, parton distribution function (PDF) and scale un- certainties can be found in Reference [29]. Gluon-fusion production is simulated with POWHEG [30], while b quark associated production is simulated with SHERPA [31].
The h/A/H
→τ
+τ
−and h/A/H
→µ
+µ
−decay modes are considered for the decay of the Higgs boson. Pseudoscalar A-boson samples for both production processes were generated, and these sam- ples are also employed for H and h assuming the mass combinations of the m
maxh, µ > 0 MSSM benchmark scenario and the same kinematics for the decay products. The signal samples with m
Aclosest to the computed mass of the H and h boson are used for H and h boson production for the h/A/H
→τ
+τ
−channels, respectively.
For the τ
+τ
−decay mode, 15 samples with Higgs boson masses in the range of 90 GeV to 500 GeV with tan β
=20 were generated, and are scaled to the appropriate cross section for other tan β values.
2ATLAS uses a right-handed coordinate system with its origin at the nominal interaction point (IP) in the centre of the detector and thez-axis along the beam pipe. Thex-axis points from the IP to the centre of the LHC ring, and they-axis points upwards. Cylindrical coordinates (r, φ) are used in the transverse plane,φbeing the azimuthal angle around the beam pipe. The pseudorapidity is defined in terms of the polar angleθasη=−ln tan(θ/2).
The increase in the Higgs boson natural width with tan β, of the order of 1 GeV in the range considered, is negligible compared to the experimental resolution in this channel.
For the µ
+µ
−decay mode, seven samples with Higgs boson masses in the range of 110 GeV to 300 GeV and with tan β
=40 were generated. Additionally, to study the tan β dependence of the width of the resonance, signal samples for both production modes are generated for m
A =150 GeV and 250 GeV, each at tan β
=20 and tan β
=60. Due to the higher resolution in this channel, signal distributions for different intermediate m
A-tan β values are obtained using an interpolation procedure described in Section 5.
The generated Monte Carlo samples for the h/A/H
→τ
+τ
−decay modes were passed through the full GEANT4 [32, 33] detector simulation, while the samples for the h/A/H
→µ
+µ
−decay mode were passed through the full GEANT4 detector simulation or the ATLFast-II [32] simulation of the ATLAS detector.
Background processes: The production of W and Z/γ
∗bosons in association with jets is simulated with the ALPGEN [34] and PYTHIA [35] generators, while PYTHIAB [36] is used for the production of b b ¯ samples. The t t ¯ production process is generated with MC@NLO [37]. MC@NLO and HER- WIG are both used for the generation of electroweak di-boson (WW, WZ, ZZ) samples. Single-top production through the s- and t-channels, and in association with W bosons, is generated using both MC@NLO and AcerMC [38]. For all event samples described above, parton showers and hadronisa- tion are simulated with HERWIG [39] and the activity of the underlying event with JIMMY [40]. The loop-induced gg
→WW processes are generated using gg2WW [41]. Multi-jet production is gener- ated with PYTHIA. The following PDF sets are used: CT10 [42] for MC@NLO, CTEQ6L1 [43] for ALPGEN and SHERPA and modified leading-order MRST2007 [44] for PYTHIA samples.
The τ leptons are decayed using either SHERPA or TAUOLA [45]. In all samples except the ones generated with SHERPA, initial-state and final-state radiation of photons is simulated using PHOTOS [46]. The Z/γ
∗ →τ
+τ
−background processes are modelled with a τ-embedded Z/γ
∗ →µ
+µ
−data sample described in Section 6. All generated Monte Carlo background samples were passed through the full GEANT4 simulation of the ATLAS detector.
All signal and background samples were reconstructed with the same software as used for data. To take into account the presence of multiple interactions occurring in the same and neighbouring bunch crossings (referred to as pile-up), simulated minimum bias events were added to the hard process in each generated event. Prior to the analysis, simulated events are reweighted in order to match the distribution of the average number of pile-up interactions per bunch crossing in the data.
4 Object reconstruction
An electron candidate is formed from energy deposits in the electromagnetic calorimeter associated with a track measured in the inner detector. Electrons are selected if they have a transverse energy E
T> 15 GeV, lie within
|η
|< 2.47, but outside of the transition region between the barrel and end- cap calorimeters (1.37 <
|η
|< 1.52), and meet quality requirements based on the expected shower shape [47].
A muon candidate is formed from a high-quality track measured in the inner detector matched to hits in the muon spectrometer [48]. Muons are required to have a transverse momentum of p
T>
10 GeV and to lie within
|η
|< 2.5. In addition, the point of closest approach of the inner detector track must be no further than 1 cm from the primary vertex
3, as measured along the z-axis. This
3The primary vertex is defined as the vertex with the largestΣp2Tof the associated tracks.
requirement reduces the contamination due to cosmic-ray muons and beam-induced backgrounds.
Identified electrons and muons are required to be isolated from additional activity in the inner detector and the calorimeter. The scalar sum of the transverse momenta of all tracks from the same vertex as the lepton, with p
Tabove 1 GeV and located within a cone of radius
4∆R=0.4 around the lepton direction, must be less than 6 % of the lepton energy for the τ
+τ
−channels, or less than 10 % for the µ
+µ
−channels. The sum excludes the track associated to the lepton itself. In addition, a pile- up-dependent requirement on the calorimetric energy within a cone of radius
∆R =0.2 around the lepton direction, excluding the energy associated to the lepton itself, is applied in the τ
+τ
−channels.
Jets are reconstructed using the anti-k
talgorithm [49] with a radius parameter of R
=0.4, tak- ing three-dimensional noise-suppressed clusters in the calorimeters [50] as input. The jet energy is calibrated using corrections derived from Monte Carlo applied to these constituent clusters [51, 52].
This calibration is validated by test beam and collision data. Reconstructed jets with E
T> 20 GeV and within
|η
|< 2.5 are selected. Events are discarded if a jet is associated with out-of-time activ- ity or calorimeter noise. To reduce the effect of pile-up, at least three-quarters of a jet’s transverse momentum, as measured by the sum of the transverse momenta of the associated tracks, must come from tracks matched to the primary vertex [53]. Jets are tagged as originating from a b quark based on the impact parameter of associated tracks and the reconstruction of b-hadron decays inside the jet.
A multivariate algorithm, which is based on a neural network, is used in this analysis [54].
Hadronic decays of τ leptons, which are labelled τ
had, are characterised by the presence of one, three or in rare cases more charged pions accompanied by a neutrino and possibly neutral pions, resulting in a collimated shower profile in the calorimeters and only a few nearby tracks. The visible decay products are then combined into τ jet candidates. Candidates are reconstructed as jets, which are re-calibrated to account for the different calorimeter response to hadronic τ decays compared to hadronic jets. Information on the collimation, isolation, and shower profile is combined into a boosted decision tree discriminant to reject backgrounds from jets [55]. In this analysis, three selections with identification efficiency of about 60 %, 45 % and 35 % are used. The rejection factor against jets varies from about 20 for the highest identification efficiency selection to about 300 for the lowest. A τ jet candidate must lie within
|η
|< 2.5, have a transverse momentum greater than 20 GeV, one or three associated tracks (with p
T> 1 GeV), and a total charge of
±1. Dedicated electron and muon veto algorithms are used.
Leptonic decays of τ leptons, which are labelled τ
lep, are characterised by the presence of one electron or muon and two neutrinos. Leptonic τ decays including an electron or muon are labelled τ
eor τ
µrespectively.
When different objects selected according to the above criteria overlap with each other geometri- cally (within
∆R< 0.2), only one of them is considered for further analysis. The overlap is resolved by selecting muon candidates, electron candidates, τ jet candidates and jet candidates in this order of priority.
The magnitude and direction of the missing transverse momentum [56], E
Tmiss, is reconstructed in- cluding contributions from muon tracks and energy deposits in the calorimeters. Clusters of calorime- ter cells belonging to jets (including τ jets) with p
T> 20 GeV are calibrated to the hadronic en- ergy scale. Calorimeter cells not associated with any object are also considered and are calibrated at the electromagnetic energy scale. The contributions of muons to E
Tmissare calculated differently for isolated and non-isolated muons, to properly account for the energy deposited by muons in the calorimeters.
4∆R = q
(∆η)2+(∆φ)2, where∆ηis the difference in pseudorapidity of the two objects in question, and∆φis the difference between their azimuthal angles.
5 The µ
+µ
−decay channel
The search for MSSM Higgs bosons in the µ
+µ
−decay channel is complicated by the small branch- ing fraction of the h/A/H
→µ
+µ
−decay and considerable background rates. The low signal-to- background ratio is compensated to some extent by the very clean signature of the µ
+µ
−final state in the detector. Furthermore, searches in this channel profit from the good mass resolution.
Signal and background processes: The signature of the h/A/H
→µ
+µ
−decay is characterised by a pair of isolated muons with high transverse momenta and opposite charge. In the b quark associated production mode, the final state can be further characterised by the presence of one or two low- p
Tb jets. The missing transverse momentum is small and of the order of the resolution of the E
missTmeasurement.
Several background processes are considered in this analysis. The dominant background is Z/γ
∗→µ
+µ
−from either the Drell-Yan continuum or produced in association with jets. In particular, Z/γ
∗production in association with b quarks is an irreducible background for the b quark associated Higgs production. The Z/γ
∗→τ
+τ
−decay with a subsequent decay of τ leptons to two muons is also taken into account.
In addition to the Z/γ
∗background, the production of t¯ t, b b, ¯ W+jets, WW and single top quark events is considered. When b jets are required in the µ
+µ
−final state, t t ¯ production becomes the second most important background after Z/γ
∗→µ
+µ
−.
Event selection: Events considered in the µ
+µ
−analysis must pass a single muon trigger with a transverse momentum threshold of 18 GeV. At least one reconstructed muon is required to be matched to the η–φ region of the trigger, and this muon is required to have p
T> 20 GeV to be in the plateau region of the trigger efficiency. In each event at least one other muon of opposite charge is required to be reconstructed with p
T> 15 GeV.
A muon pair is formed using the two highest- p
Tmuons of opposite charge. This muon pair is required to have an invariant mass greater than 70 GeV. No explicit rejection of events containing more than two muons is applied in order to retain µ
+µ
−events accompanied by b jets. Events having a missing transverse momentum greater than 40 GeV are rejected.
The large background provided by Z/γ
∗boson decays can be efficiently reduced by requiring that the event contains at least one jet which is tagged as a b jet. However, due to the low transverse momentum of b jets in signal events, this requirement also results in a significant loss of the signal.
To avoid such a loss in sensitivity, the analysis is divided into a channel with no identified b jets and a channel with at least one identified b jet based on a working point of the b-tagging algorithm which has a signal efficiency of 70 % in simulated t t ¯ events.
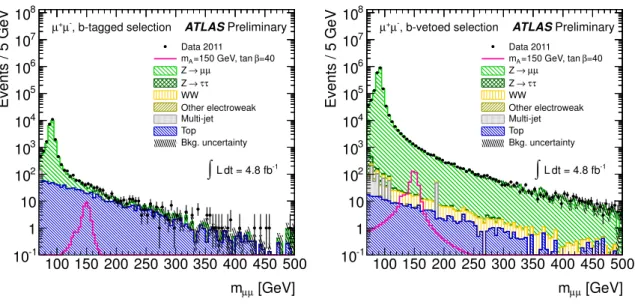
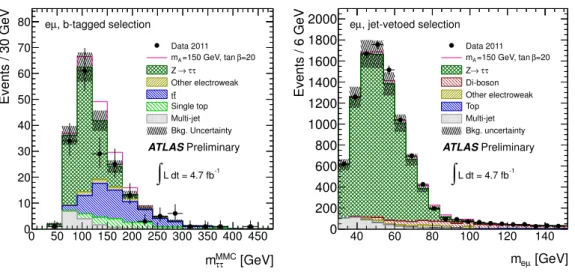
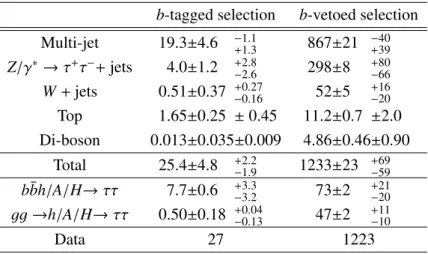
Figure 1 shows the µ
+µ
−invariant mass distribution from both data and simulated background processes for selected events with and without b jets. The b-vetoed selection is characterised by high statistics due to the dominant contribution from Z/γ
∗decays which leads to a rather low signal-to- background ratio. Remaining backgrounds include WW and t t ¯ production whose contributions are roughly two orders of magnitude lower. The two dominant background processes in the b-tagged selection are Z/γ
∗and t t ¯ production. The b-tagged selection offers a better signal-to-background ratio but suffers from low statistics.
Background modelling: The final observable in the µ
+µ
−decay channel is the invariant mass distri-
bution. A hypothetical signal would be present as a small resonance on top of the high-mass tail of the
[GeV]
µ
mµ
100 150 200 250 300 350 400 450 500
Events / 5 GeV
10-1
1 10 102
103
104
105
106
107
108
Data 2011 β=40
=150 GeV, tan mA
µ µ
→ Z
τ τ
→ Z WW
Other electroweak Multi-jet Top
Bkg. uncertainty , b-tagged selection
µ-
µ+ ATLAS Preliminary
dt = 4.8 fb-1
L
∫
[GeV]
µ
mµ
100 150 200 250 300 350 400 450 500
Events / 5 GeV
10-1
1 10 102
103
104
105
106
107
108
Data 2011 β=40
=150 GeV, tan mA
µ µ
→ Z
τ τ
→ Z WW
Other electroweak Multi-jet Top
Bkg. uncertainty , b-vetoed selection
µ-
µ+ ATLAS Preliminary
dt = 4.8 fb-1
L
∫
Figure 1: Final mass distributions for the h/A/H
→µ
+µ
−final state. The invariant mass distribution of the two muons is shown for the b-tagged (left-hand side) and the b-vetoed selection (right-hand side). The data are compared to the background expectation and an added hypothetical MSSM signal (m
A =150 GeV, tan β
=40). Simulated backgrounds are shown for illustration purposes. The background uncertainties include the statistical uncertainties only.
Z boson superimposed on a continuous contribution from non-resonant backgrounds such as t t. The ¯ Z/γ
∗process dominates the background with a relative fraction of 99.9 % for the b-vetoed selection and 95.8 % for the b-tagged selection. In the b-vetoed selection the non-resonant background is com- posed of t t, ¯ W
+W
−and b b ¯ events and contributes 0.1 %; in the b-tagged selection the non-resonant background is dominated by t t ¯ events and contributes 4.2 %.
The background in this final state is estimated in a data-driven way. By scanning over the µ
+µ
−invariant mass distribution, local sideband fits provide the expected background estimate in the mass region of interest. To this end, a parameterisation of the background shape is fit to the µ
+µ
−invariant mass distribution in ranges determined to be sufficiently large. A search window to either side of the mass point being investigated is excluded from the fit. The widths of the search windows are motivated by the expected signal width for each point in the scanned m
A–tan β grid and account for asymmetries in the signal invariant mass distribution. The upper and lower boundaries of the search windows are defined by the m
µµvalues where the signal model predictions are 10 % of their maximum.
The parameterisation of the µ
+µ
−invariant mass distribution, f
B( x), is given by f
B(x, N, A, B, M
Z,
ΓZ, σ)
=N
·f
Z(x, A, B, M
Z,
ΓZ)
⊗f
Gauss(x, σ)
, (1)
where x represents the running invariant mass and
⊗the convolution operator. The function f
Zde- scribing the Z/γ
∗production is
f
Z(x, A, B, M
Z,
ΓZ)
=A 1
x
2 +B x
2−M
2Zx
2−M
Z22+
M
2ZΓ2Z+
x
2x
2−M
2Z2+
M
Z2Γ2Z. (2)
This is convolved with a Gaussian distribution accounting for the finite mass resolution. The function
f
Zis a simplification of the pure γ
∗and Z propagators, including Z-γ
∗interference contributing to
the process q q ¯
→Z/γ
∗ →µ
+µ
−, and hence in principle only describes the background from Z/γ
∗production. The parameterisation f
Bis found to be a good approximation of the shape of the total µ
+µ
−background even in the b-tagged selection, which has non-negligible contributions from physics processes other than Z/γ
∗.
In total, the fit function f
Bhas six free parameters. The total normalization of the curve is described by the parameter N, parameters A and B represent the relative normalisations of the γ
∗and Z-γ
∗contributions with respect to the Z term. M
Zrepresents the Z mass, and the natural width of the Z resonance,
ΓZ, is fixed to
ΓZ =2.4952 GeV [57]. The parameter σ represents the mean µ
+µ
−mass resolution in the muon reconstruction.
For every point on the m
A–tan β grid, a binned likelihood fit of f
Bto the data is performed and a point-by-point estimation of the fit parameters results in the total background estimate. The un- certainty on the background estimate is obtained from the confidence contour of the fit, given by a variation of the χ
2by one standard deviation.
The background model is validated from goodness-of-fit studies using the χ
2normalised to the number of degrees of freedom (χ
2/DoF) and the χ
2probability (P(χ
2)). In addition, the background model is extended by Bernstein polynomials of different orders to test if additional degrees of free- dom change either χ
2/DoF or P(χ
2), which would hint at problems in the shape modelling. Further validation of the capability of the model to describe the shape of the data is performed by varying the fit ranges for certain mass points and accounting for the fit residuals. The goodness-of-fit studies do not show a significant mismodeling of the background beyond the statistical fluctuations for either the b-vetoed or the b-tagged selection.
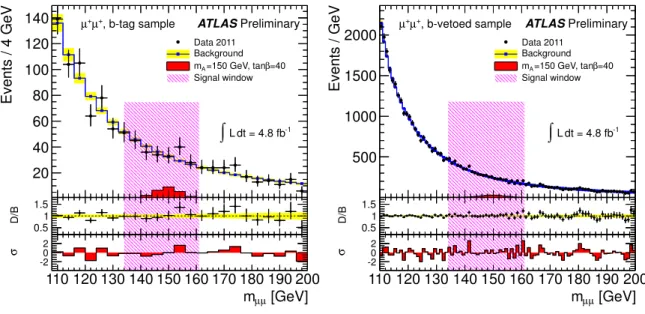
Figure 2 compares the data with the background estimate predicted from sideband fits in both the b-vetoed and b-tagged selections for the signal mass point m
A =150 GeV and tan β
=40. The data fluctuate around the background prediction leading to local bin-by-bin significances of typically less than 2 σ. Table 1 shows the number of observed events in the fit range around the mass point m
A=150 GeV compared to the number of background events predicted by the sideband fits in the b- vetoed and b-tag selections, respectively. In addition, the number of expected signal events produced in gluon-fusion or in association with b quarks is shown for tan β
=40. The numbers shown are for illustration purposes only; the full shape information of the invariant mass distribution is used to obtain the final result.
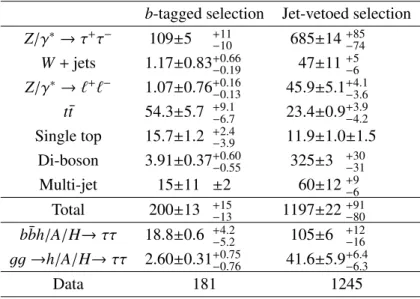
b-tagged selection b-vetoed selection
Mass Point m
A =150 GeV
Fit Range [110, 200] GeV
Background 980
±48 35890
±563
b bh/A/H ¯
→µµ 28.3
±3.2 271
±31 gg
→h/A/H
→µµ 2.34
±0.37 141
±15
Data 985 36044
Table 1: The number of events observed in data and the expected number of signal and background
events in the h/A/H
→µ
+µ
−channel. The number of background events is predicted from sideband
fits to the µ
+µ
−invariant mass distribution in the fit range around the signal mass point m
A=150 GeV
for both the h/A/H
→µ
+µ
−b-vetoed and b-tagged channels. The number of expected signal events
produced in gluon-fusion or in association with b quarks is shown for tan β
=40. The uncertainty is
derived from the fit results.
110 120 130 140 150 160 170 180 190 200
Events / 4 GeV
20 40 60 80 100 120 140
Data 2011 Background
β=40
=150 GeV, tan mA
Signal window , b-tag sample
µ+
µ+ ATLAS Preliminary
dt = 4.8 fb-1
L
∫
110 120 130 140 150 160 170 180 190 200
D/B 0.5
1 1.5
[GeV]
µ
mµ
110 120 130 140 150 160 170 180 190 200
σ
-202
110 120 130 140 150 160 170 180 190 200
Events / GeV
500 1000 1500
2000 Data 2011
Background β=40
=150 GeV, tan mA
Signal window , b-vetoed sample
µ+
µ+ ATLAS Preliminary
dt = 4.8 fb-1
L
∫
110 120 130 140 150 160 170 180 190 200
D/B 0.5
1 1.5
[GeV]
µ
mµ
110 120 130 140 150 160 170 180 190 200
σ
-202
Figure 2: Invariant mass distribution (solid circles) and predicted background (blue) from sideband fits to the data shown for the signal mass point at m
A =150 GeV and tan β
=40 for the b-tagged (left-hand side) and the b-vetoed selections (right-hand side) of the h/A/H
→µ
+µ
−final state. The insets labelled with D/B show the ratio of the data to the the predicted background. The insets labelled with σ show the bin-by-bin significances of the deviations of the data compared to the background prediction.
Signal modelling: The h/A/H
→µ
+µ
−signal is expected to appear as a narrow resonance in the µ
+µ
−invariant mass distribution. The resolution in the relevant mass range is typically 2.5
−3 % and numerous mass points are needed for a complete mass scan. In addition, the influence of tan β on the reconstructed width of the signal invariant mass distribution needs to be taken into account. The natural width of the neutral MSSM Higgs bosons increases with tan β. The reconstructed width can be sensitive to this variation because of the good experimental mass resolution.
To interpolate between the different resonances obtained from a limited number of simulated signal samples, the signal µ
+µ
−invariant mass distribution is parameterised with
f
S( x, N, M,
Γ, σ,c, ς)
=N
1 x
2−M
22+
M
2Γ2 ⊗f
Gauss(x, σ)
+c f
Landau(
−x, M, ς)
, (3) where x represents the running µ
+µ
−invariant mass. The parameterisation consists of a Breit-Wigner function describing the signal peak convolved with a Gaussian distribution accounting for the finite mass resolution and a Landau function with left-hand side tail which models the asymmetric part of the signal invariant mass distribution.
Function f
Sis characterised by six parameters. The width of the Breit-Wigner function,
Γ, isfixed to its theoretical predictions calculated with FeynHiggs [28]. The remaining five parameters are free-floating. N is the overall normalization parameter and c specifies the relative normalization of the Landau function with respect to the Breit-Wigner function. The parameter M specifies the mean of the Breit-Wigner and the Landau distributions, σ determines the width of the Gaussian distribution and ς represents the scale parameter of the Landau function.
The function f
Sis fit to each signal sample available from simulation. Each fit results in a set of
fitted parameters, (N, M, σ, c, ς), depending on the point in the m
A–tan β plane. The distributions of
the five fit parameters are parameterised in m
Aand tan β with polynomials of different orders. The resulting polynomials are used to interpolate between the limited number of simulated signal samples, thus providing a set of parameters which in addition to the predicted natural width,
Γ, fully define thenormalised probability density function for an arbitrary point in the m
A–tan β plane.
This procedure is used to generate invariant mass distributions for signal masses from 120–
150 GeV in 5 GeV steps and from 150–300 GeV in 10 GeV steps, as well as for tan β values from 5–70 in steps of 3 or 5. For both the b-vetoed and b-tagged selections the interpolated normalised probability density functions are obtained separately for the Higgs boson production from gluon- fusion and in association with b quarks.
The resulting number of expected signal events in the fit range around the mass point m
A =150 GeV is given in Table 1 for both the b-vetoed and b-tagged selections, assuming the m
maxhscenario and tan β
=40.
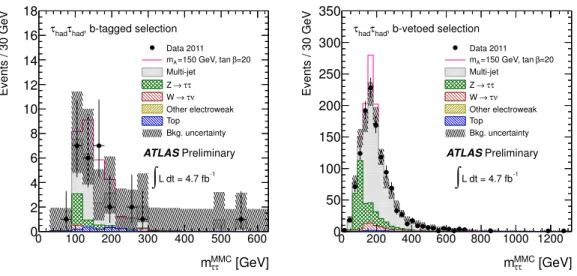
6 The τ
+τ
−decay channel
The h/A/H
→τ
+τ
−decay mode is analysed in several categories according to whether each τ lepton decays into an electron, a muon, or hadrons in addition to one or more neutrinos. The four decay modes considered here are: τ
eτ
µ, τ
eτ
had, τ
µτ
had, τ
hadτ
had. These decays have branching ratios of 6 % (τ
eτ
µ), 23 % (τ
eτ
had), 23 % (τ
µτ
had), and 42 % (τ
hadτ
had). The combination of τ
eτ
hadand τ
µτ
hadis referred to as τ
lepτ
had.
6.1 Common background estimation and mass reconstruction techniques
τ-embedded Z/γ∗ →µ+µ−
data: Z/γ
∗ →τ
+τ
−events form a largely irreducible background to the Higgs boson signal in all selected final states. It is not possible to select a data-driven Z/γ
∗→τ
+τ
−control sample which is Higgs signal-free. However, Z/γ
∗ →µ
+µ
−events can be selected in data with high purity and without significant signal contamination. Furthermore, the event topology and kinematics are, apart from the different masses of τ leptons and muons, identical to those of Z/γ
∗→τ
+τ
−events. Therefore Z/γ
∗→µ
+µ
−events are selected in data based on a single muon trigger and modified using the so-called embedding technique, which replaces the muons by simulated τ leptons.
The hits of the muon tracks and the associated calorimeter cells in a cone of
∆R =0.1 around the muon direction are removed from the data event and replaced by the detector response of a simulated Z/γ
∗ →τ
+τ
−event with the same kinematics. The object and event reconstruction is performed on the combined event. Only the τ decays and the detector response are taken from the simulation, whereas the underlying event kinematics and the associated jets are taken from data.
The event yield of the embedded sample after the selection of the τ decay products is normalised to the corresponding event yield obtained in a simulated Z/γ
∗ →τ
+τ
−sample. This procedure has been extensively validated [58].
Jets misidentified as hadronic
τdecays: A fraction of jets originating from quarks or gluons will
have a signature such that they are misidentified as hadronic τ lepton decays. It has been shown
in Reference [59] that this misidentification fraction is higher in simulated samples than in data. To
account for this difference the Monte Carlo background estimate is corrected based on control samples
in data for backgrounds in which the identified τ
hadcomes from a jet. Details are presented in the
description of the analysis-specific background estimation.
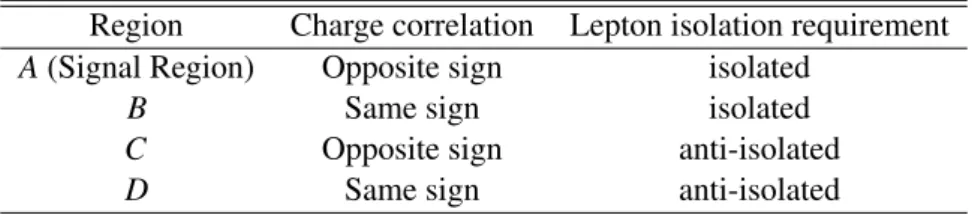
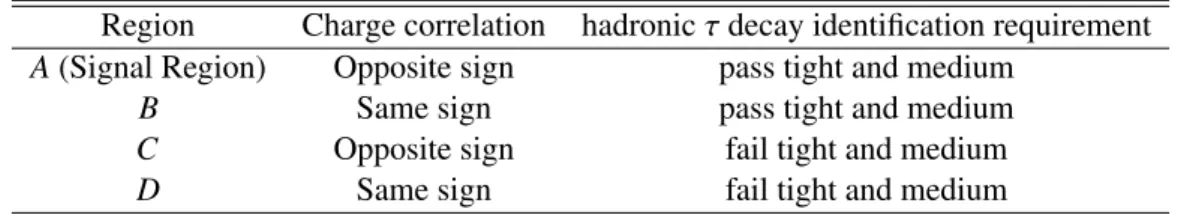
The
ABC Dbackground estimation method: The so-called ABCD method is used for the esti- mation of the background from QCD multi-jet processes from data. Four independent samples are selected by using selection criteria on two variables. One of these regions is the signal region. The other three regions are independent control regions dominated by the background that is to be esti- mated. The regions obtained by inverting the criterion on one or the other of the two selected variables are labelled B and C. The region defined by simultaneously inverting the selection criteria on both variables is labelled D. If the two selected variables are uncorrelated for the background in question, the event yield n
Aof this background in the signal region can be estimated by the event yield n
Bin region B scaled by the ratio of event yields n
Cand n
Din regions C and D:
n
A =n
B×n
Cn
D ≡n
B×r
C/D. (4)
For variables that are uncorrelated with the two used for the ABCD separation, the shape from any of the control regions can be used to model the distribution in the signal region.
To avoid biasing the estimated event yields and shapes, the remaining contributions from other backgrounds should be negligible or they have to be subtracted from the observed data events in the control regions.
τ+τ−
mass reconstruction: Due to the presence of neutrinos from the two τ decays, the reconstruc- tion of the Higgs boson invariant mass requires special techniques. The simplest of these is the visible mass, defined as the invariant mass of the visible τ-decay products. Although the most probable value is not located at the nominal Higgs boson mass, it offers acceptable mass resolution while avoiding any dependence on the resolution of the measurement of missing transverse momentum.
A more sophisticated method is the Missing Mass Calculator (MMC) [60]. This algorithm tries to evaluate the most probable mass of the τ
+τ
−system by deriving an approximate solution of the equations describing the Higgs boson decay into a τ
+τ
−pair. Due to the unknown kinematics of the neutrinos escaping detection, these equations cannot be solved analytically. But, using the knowledge about simulated τ lepton decays, the measured missing transverse momentum, E
missT, and its known resolution, the most probable mass of the τ
+τ
−system is evaluated instead.
The visible mass is used for the jet-vetoed τ
eτ
µdecay channel, while all other decay channels use the MMC mass.
6.2 Analysis of the h/A/H → τ
eτ
µdecay channel
Signal topology and event selection: The preselection is applied to events containing electrons or muons: either a single electron trigger condition with a p
Tthreshold of 20 GeV or 22 GeV depending on the instantaneous luminosity, a combined electron-muon trigger condition with a p
Tthreshold of 10 GeV for the electron and 6 GeV for the muon, or a single muon trigger condition with a p
Tthresh- old of 18 GeV must be fulfilled. Subsequently, exactly one isolated electron and one isolated muon of opposite electric charge, and with a di-lepton invariant mass above 30 GeV are required. If a single lepton trigger requirement is fulfilled, the p
Tthreshold applied to the corresponding reconstructed particle is raised from the one applied to all reconstructed electrons and muons to p
T> 24 GeV for electrons and p
T> 20 GeV in for muons. In order to further suppress events arising from di-boson production, W
→ℓν, and t¯ t processes, the opening angle between the two lepton candidates in the transverse plane must satisfy the condition
∆φeµ> 2.0.
The event sample is then split according to its jet content (using jets with p
T> 20 GeV) to
account for the two dominant Higgs boson production mechanisms in the MSSM, gluon-fusion and
b-associated production.
Events containing an identified b jet enter the b-tagged selection. Events with an additional b jet are rejected to reduce the t t ¯ contribution. The working point of the flavour tagging algorithm pro- vides a b jet tagging efficiency of 75 % in simulated t¯ t events. A cut on the scalar sum of the lepton transverse momenta and missing transverse momentum, E
Tmiss+p
T,e+p
T,µ< 125 GeV, is applied to reduce top quark and di-boson backgrounds. In addition, the combination of the transverse opening angles between the lepton directions and the direction of E
Tmissis required to satisfy the condition
Pℓ=e,µ
cos
∆φEmissT ,ℓ