Hard QCD Results with Jets at the LHC
Sven Menke
1,aon behalf of the ATLAS and CMS collaborations
Max-Planck-Institut f¨ur Physik, F¨ohringer Ring 6, 80805 M¨unchen, Germany
Abstract. Hard QCD results in proton-proton collisions at √
s = 7 TeV with jets from data recorded up to the end of 2010 by the CMS and ATLAS experiments at the LHC are reported. Inclusive jet and di-jet cross section measurements as well as observables sensitive to multi-jet activity are shown and compared to simulations based on leading log parton showers as well as NLO QCD predictions. Novel approaches to identify highly boosted massive final states by exploiting the jet substructure are tested on the dominant QCD background.
1 Introduction
The ATLAS [1] and CMS [2] experiments both have rich QCD programs involving high p
⊥jets aiming to probe the structure of the colliding protons, to measure the strong coupling constant and to test the standard model (SM) at the shortest distance scales accessible today in the high- center-of-mass proton-proton collisions of the LHC. Fur- thermore deviations from the SM would indicate the pres- ence of new physics beyond the SM. The datasets recorded up to the end of 2010 and corresponding to integrated lu- minosities of L ' 35 pb
−1per experiment have been used by ATLAS and CMS to update their measurements of in- clusive jet and di-jet cross sections, as well as to mea- sure multi-jet and angular di-jet distributions. New meth- ods based on the sub-structure of jets to detect heavily boosted massive objects ending up in single jets at the LHC have also been tested on the dominant QCD background and compared to expectations.
2 Jet reconstruction and calibration
The infrared- and collinear-safe Anti-k
⊥jet clustering al- gorithm [3] is used by both experiments in the inclusive reconstruction mode with distance parameters 0.4 ≤ R ≤ 0.7. Input to the jet algorithm are 4-vectors stemming ei- ther from stable particles in generator-level simulations, partons in NLO calculations, topological calorimeter clus- ters [4,5] in ATLAS or particle flow (PF) objects [6,7] in CMS in full simulations and data. Topological clusters can be calibrated prior to the jet making [5] in ATLAS or left at the electromagnetic (EM) scale. The PF objects use in- formation from all CMS subsystems and are calibrated to correspond to stable particles like γ’s, leptons, charged and neutral hadrons. In all cases residual jet-level corrections are needed to account for particle losses not detectable on cluster or PF object level [8,9] with larger corrections (up to a factor of 2) for EM-scale inputs and small corrections (on the level of 5 − 10%) for already calibrated inputs. The jet-level calibrations are Monte Carlo (MC) based correc- tion functions in |η| and p
⊥. Jet energy scale (JES) and
a
e-mail: menke@mppmu.mpg.de
uncertainty are validated with in-situ methods using p
⊥balance in di-jet and γ-jet events and the momentum pro- jection fraction method in γ-jet events. The Monnte Carlo based correction factors are validated with single particle test-beam data and E/p measurements of isolated hadrons in collision data which are then extrapolated using frag- mentation predictions to the jet-level. The systematic JES uncertainty is typically 3 − 6% for both ATLAS and CMS over a large range of pseudo-rapidities and p
⊥, with the larger values at large |η|, very low and very high p
⊥.
3 Inclusive jet cross section measurements
The inclusive jet cross section is measured by ATLAS [10]
and CMS [11] as a function of transverse jet momentum p
⊥and jet rapidity y. The data is corrected bin-by-bin for migration e ff ects in p
⊥due to the steeply falling spectrum in p
⊥and the finite p
⊥resolution. In CMS the corrected
[TeV]
m12 10-1 2×10⁻¹ 1 2 3 4 5 [pb/TeV]max|yd|12m/dσ2d
10-2 1 102 104 106 108 1010 1012 1014 1016 1018 1020 1021
Systematic uncertainties
Non-pert. corr.
× NLO pQCD (CTEQ 6.6)
8) 10
× < 2.8 ( max
| y 2.1 < |
6)
× 10 < 2.1 (
|max y 1.2 < |
4)
× 10 < 1.2 (
|max y 0.8 < |
) 102
× < 0.8 ( max y| 0.3 < |
0)
× 10 < 0.3 (
|max y |
ATLASPreliminary
= 0.4 R jets, anti-kt
dt = 37 pb-1
∫L = 7 TeV, s
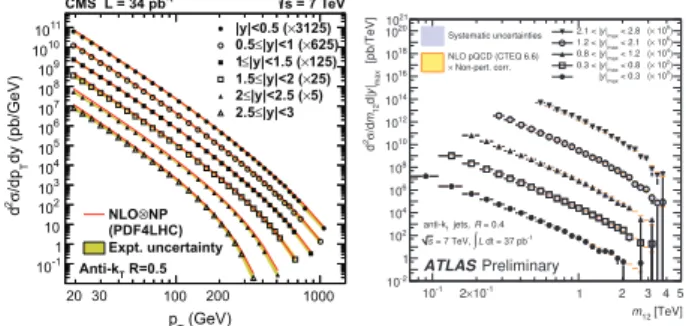
Fig. 1. Inclusive jet cross section from CMS (left) for Anti-k
⊥jets with R = 0.5 as function of p
⊥for 6 rapidity intervals scaled for easier viewing. The data points (symbols) are compared to NLO predictions (solid lines) corrected for non-perturbative e ff ects.
Experimental uncertainties are indicated by the yellow bands;
Double di ff erential cross section from ATLAS (right) for Anti-k
⊥di-jet events with R = 0.4 as function of di-jet mass m
12for 5 in- tervals of maximum rapidity | y
max| with systematic experimental uncertainties (grey band). NLO predictions with NP corrections and uncertainties are shown as well (yellow band).
arXiv:1201.4978v2 [hep-ex] 25 Jan 2012
EPJ Web of Conferences
[GeV]
pT
102 103
/d|y|T(CTEQ 6.6)/dp0σ2/d|y|/dT/dpσ2d 0.4
0.6 0.8 1 1.2 1.4 1.6 1.8 2
(CL90)
∆PDF jets. R =0.4 (0.0<|y|<0.3) anti-kt
Data CTEQ 6.6 CT10
NNPDF 2.0(100) NNPDF 2.1(100) MSTW2008
ATLASPreliminary
[GeV]
pT
102 103
/d|y|T(CTEQ 6.6)/dp0σ2/d|y|/dT/dpσ2d 0.4
0.6 0.8 1 1.2 1.4 1.6 1.8 2
(CL90)
∆PDF jets. R =0.4 (0.0<|y|<0.3) anti-kt
Data CTEQ 6.6 HERAPDF 1.0
HERAPDF 1.5 GJR 2008
ATLASPreliminary
[GeV]
T p 102
/d|y|T(CTEQ 6.6)/dp0σ2/d|y|/dT/dpσ2d 0.5
1 1.5 2 2.5
(CL90)
∆PDF jets. R =0.4 (2.1<|y|<2.8) anti-kt
Data CTEQ 6.6 CT10
NNPDF 2.0(100) NNPDF 2.1(100) MSTW2008
ATLASPreliminary
[GeV]
T p 102
/d|y|T(CTEQ 6.6)/dp0σ2/d|y|/dT/dpσ2d 0.5
1 1.5 2 2.5
(CL90)
∆PDF jets. R =0.4 (2.1<|y|<2.8) anti-kt
Data CTEQ 6.6 HERAPDF 1.0
HERAPDF 1.5 GJR 2008
ATLASPreliminary
Fig. 2. Ratio of the inclusive jet cross section from ATLAS for Anti-k
⊥jets with R = 0.4 as function of p
⊥over NLO predic- tions for |y| < 0.3 (top) and 2.1 < |y| < 2.8 (bottom). The refer- ence NLO prediction is CTEQ 6.6 which is compared to the ra- tios using CT10, MSTW 2008, NNPDF 2.0 and NNPDF 2.1 (left);
HERAPDF 1.0, HERAPDF 1.5 and GJR08 (right). Error bars in- dicate statistical errors. The light shaded band shows the exper- imental systematic uncertainties excluding a common 3.4% un- certainty from the luminosity measurement. The other bands in- dicate the respective theoretical uncertainties.
spectra are obtained by fitting a modified power-law func- tion with Gaussian smearing in p
⊥to the observed spec- tra. In ATLAS the correction factors are obtained from full detector simulations including detector ine ffi ciencies. Typ- ical corrections are in the 10 − 15% range but can extend to 30 − 50% at the edges of the phase space. The NLO per- turbative QCD (pQCD) predictions on parton-level on the other hand are corrected for non-perturbative (NP) e ff ects due to hadronisation and the underlying event activities.
These corrections are obtained by comparing simulations with leading log generators (PYTHIA / HERWIG) which are run with and without these e ff ects enabled. The corrections depend strongly on jet size. For R = 0.5, 0.6 the underlying event e ff ects dominate and corrections are around 1.2 − 1.4 at small p
⊥. For R = 0.4 hadronisation e ff ects are domi- nant and corrections of about 0.8 are obtained at low p
⊥. The corrections approach unity at larger p
⊥for all used R values.
Figure 1 (left) shows the inclusive jet cross section mea- surement for jets with size R = 0.5 as a function of jet transverse momentum measured by CMS. The experimen- tal uncertainties are in the range 10 − 20% and are dom- inated by the uncertainties on JES and resolution. Similar distributions for R = 0.4 and R = 0.6 are obtained by AT- LAS, with uncertainties in the range of 10−30%. Di ff erent NLO predictions are tested [12,13] by comparing the ra- tios of data to NLO MC predictions for various PDF sets.
Figure 2 shows an example from ATLAS for the rapidity region |y| < 0.3 for R = 0.4 and R = 0.6. CMS obtains sim- ilar comparisons for R = 0.5. The NLO predictions are in general systematically above the data but still compatible with the measurement within the assigned uncertainties.
The deviations become larger at large |y| and p
⊥.
The double differential cross section in the maximum jet rapidity |y
max| and di-jet mass m
12for di-jet events as measured by ATLAS [10] is shown in Figure 1 (right) for
JJ
0 0.5 1 1.5 2
1 MJJ (TeV)
Ratio to NLO (CT10) ⊗ NP
CMS L = 36 pb-1 √s = 7 TeV Dijet Mass Anti-kT R=0.7 0.0 ≤ |y|max < 0.5
CMS Data CT10 ⊗ NP, ∆PDF CL68 MSTW2008 ⊗ NP NNPDF2.1 ⊗ NP HERAPDF1.0 ⊗ NP ABKM09 ⊗ NP
0.2 0.5 3
0 0.5 1 1.5 2
1
MJJ (TeV)
Ratio to NLO (CT10) ⊗ NP
CMS L = 36 pb-1 √s = 7 TeV Dijet Mass Anti-kT R=0.7 2.0 ≤ |y|max < 2.5
CMS Data CT10 ⊗ NP, ∆PDF CL68 MSTW2008 ⊗ NP NNPDF2.1 ⊗ NP HERAPDF1.0 ⊗ NP ABKM09 ⊗ NP
0.7 2 4
Fig. 3. Ratio of the double di ff erential di-jet cross section from CMS for Anti-k
⊥jets with R = 0.7 as a function of the di- jet mass (M
jj) over NLO predictions for | y | < 0.5 (left) and 2.0 < |y| < 2.5 (right). The reference NLO prediction uses CT10 which is compared to the ratios using MSTW 2008, NNPDF 2.1, HERAPDF 1.0 and ABKM09 instead. Error bars indicate statistical errors. The grey band shows the experimental systematic uncer- tainties and the yellow band the typical PDF uncertainty (CT10).
Non-perturbative uncertainties are dominant at low masses and not shown in the figures.
R = 0.4. Similar results are obtained by CMS [14] for R = 0.7. Both ATLAS and CMS use full simulations to obtain the bin-by-bin migration corrections for the distri- butions. Dominant experimental systematic uncertainties stem from the JES uncertainty and are in the range of 15 − 30% for ATLAS and around 15% at low masses and 60%
at high masses for CMS. As is the case for the inclusive jet cross section measurement a comprehensive compar- ison to NLO pQCD predictions has been made by both ATLAS [10] and CMS [13]. Figure 3 shows the ratio of the measured double di ff erential di-jet cross section to that predicted in CT10-based MC simulation for two rapidity bins. The agreement with HERAPDF is best, but all tested PDF sets agree within uncertainties.
4 Angular and multi-jet variables
Due to their sensitivity to new physics and their ability to probe mass scales without explicitly relying on JES cal- ibrations the angular distributions of multi-jet events are of particular interest. The azimuthal de-correlation ∆φ of the two most energetic jets as measured by ATLAS [15]
is shown in the left plot of figure 4. Values close to π are expected for di-jet events while smaller values indicate the presence of additional jets. NLO pQCD calculations using NLOJet++ and MSTW 2008 agree with the data for ∆φ < π.
Leading log simulations (PYTHIA, HERWIG, SHERPA agree with the data and give a good description of the perturba- tively diverging point ∆φ = π. The right side plot of fig- ure 4 shows the distribution of χ
dijet= exp |y
1− y
2|, the ex- ponential of the rapidity di ff erence between the two lead- ing jets in p
⊥, as measured by CMS [16] for di ff erent di- jet mass intervals. The distribution in χ
dijetis expected to be almost flat for QCD while new physics (such as quark com- positeness) would cause excess events at small χ
dijet. The comparison to NLO pQCD calculations with NLOJet++
and the CTEQ 6.6 PDF-set shows good agreement with
the data, and a lower limit on the contact interaction scale
for left-handed quarks of Λ
+= 5.6 TeV (Λ
−= 6.7 TeV) for
Hadron Collider Physics Symposium 2011
[radians]
φ /2 ∆
π 2π/3 5π/6 π ]-1 [radiansφ∆/dσ dσ1/
10-3 10-2 10-1 1 10 102 103 104 105 106 107 108 109
=36 pb-1 dt
∫L Data
8)
×10 800 GeV ( max>
pT
7)
×10 800 GeV (
≤ max pT
<
600 6)
×10 600 GeV (
≤ max pT
<
500 5)
×10 500 GeV (
≤ max pT
<
400 4) 10
× 400 GeV (
≤ max pT
<
310 3)
×10 310 GeV (
≤ max pT
<
260 2)
×10 260 GeV (
≤ max pT
<
210 1)
×10 210 GeV (
≤ max pT
<
160 0)
×10 160 GeV (
≤ max pT
<
110
4) αs O(
NLO pQCD unc.
αs PDF &
scale unc.
ATLAS s=7 TeV
|<0.8 y
>100 GeV | pT jets R=0.6 anti-kt
dijet
χ
2 4 6 8 10 12 14 16
dijetχ/ddijetσ ddijetσ1/
0.1 0.2 0.3 0.4 0.5 0.6 0.7
dijet
χ
2 4 6 8 10 12 14 16
dijetχ/ddijetσ ddijetσ1/
0.1 0.2 0.3 0.4 0.5 0.6 0.7
> 2.2 TeV
Mjj (+0.5)
dijet
χ
2 4 6 8 10 12 14 16
dijetχ/ddijetσ ddijetσ1/
0.1 0.2 0.3 0.4 0.5 0.6 0.7
< 2.2 TeV Mjj
1.8 < (+0.4)
dijet
χ
2 4 6 8 10 12 14 16
dijetχ/ddijetσ ddijetσ1/
0.1 0.2 0.3 0.4 0.5 0.6 0.7
< 1.8 TeV Mjj
1.4 < (+0.3)
dijet
χ
2 4 6 8 10 12 14 16
dijetχ/ddijetσ ddijetσ1/
0.1 0.2 0.3 0.4 0.5 0.6 0.7
< 1.4 TeV Mjj
1.1 < (+0.25)
dijet
χ
2 4 6 8 10 12 14 16
dijetχ/ddijetσ ddijetσ1/
0.1 0.2 0.3 0.4 0.5 0.6 0.7
< 1.1 TeV Mjj
0.85 < (+0.2)
dijet
χ
2 4 6 8 10 12 14 16
dijetχ/ddijetσ ddijetσ1/
0.1 0.2 0.3 0.4 0.5 0.6 0.7
< 0.85 TeV Mjj
0.65 < (+0.15)
dijet
χ
2 4 6 8 10 12 14 16
dijetχ/ddijetσ ddijetσ1/
0.1 0.2 0.3 0.4 0.5 0.6 0.7
< 0.65 TeV Mjj
0.5 < (+0.1)
dijet
χ
2 4 6 8 10 12 14 16
dijetχ/ddijetσ ddijetσ1/
0.1 0.2 0.3 0.4 0.5 0.6 0.7
< 0.5 TeV Mjj
0.35 < (+0.05)
dijet
χ
2 4 6 8 10 12 14 16
dijetχ/ddijetσ ddijetσ1/
0.1 0.2 0.3 0.4 0.5 0.6 0.7
< 0.35 TeV Mjj 0.25 <
CMS = 7 TeV s L = 36 pb-1 Data
QCD prediction = 5 TeV + Λ
= 5 TeV Λ-
Fig. 4. Azimuthal de-correlation ∆φ of the two most energetic jets as measured by ATLAS (left) for Anti-k
⊥jets with R = 0.6 for different p
max⊥intervals (black markers) compared to NLO pQCD calculations (red lines) with associated errors (hatch pattern); The distribution of χ
dijet(black points) for different M
jjranges as mea- sured by CMS (right) for Anti-k
⊥jets with R = 0.5 compared to NLO pQCD calculations (shaded band) and predictions includ- ing contact interactions (colored lines) for compositeness scales of Λ
+/−= 5 TeV.
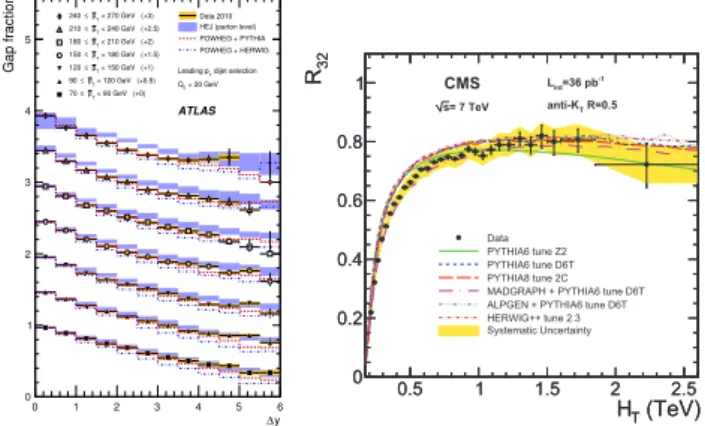
destructive (constructive) interference has been obtained at 95% CL. A complementary study of the rapidity gap be- tween the two jets with either leading p
⊥or the largest ra- pidity gap ∆y has been done by ATLAS [17]. The so-called gap-fraction is defined as the fraction of events without ad- ditional jet activity in the rapidity interval between the two jets. Any additional jet within the gap has to have a trans- verse momentum above a veto scale p
⊥> Q
0, with the default choice Q
0= 20 GeV to stay far away from Λ
QCD. The gap-fraction is shown in the left plot of figure 5 for the choice of leading jets in p
⊥as a function of ∆y for various intervals of the average transverse momentum of the two leading jets ¯ p
⊥. The comparison with HEJ calcu- lations shows some deviations in the large ¯ p
⊥regions but the agreement improves as ¯ p
⊥approaches Q
0, which is ex- pected since HEJ is designed to give a good description of QCD in the limit where all jets have similar p
⊥. The best description is achieved with POWHEG interfaced to PYTHIA although deviations are observed at large ∆y. POWHEG in- terfaced to HERWIG tends to predict smaller gap fractions over the full phase space and the deviations increase for larger ∆y as for the POWHEG + PYTHIA case.
The right hand plot in figure 5 shows the cross sec- tion ratio of three-jet over two-jet events R
32as a func- tion of the total transverse momentum sum H
⊥= P
jets
p
⊥as measured by CMS [18]. Many systematic uncertainties such as those due to the JES and the jet selection e ffi ciency largely cancel in this ratio, while the uncertainty due to the integrated luminosity vanishes entirely. Therefore R
32provides a stringent test of QCD predictions. Events with two or more Anti-k
⊥jets with R = 0.5 with | y | < 2.5 and p
⊥> 50 GeV and H
⊥> 0.2 TeV are selected and compared to various PYTHIA6, PYTHIA8 and HERWIG++
based tunes and to simulations using the multi-parton fi- nal state generators MADPGRAPH and ALPGEN interfaced to PYTHIA6. All predictions describe the observed ratio well in the region H
⊥> 0.5 TeV but, with the exception of MADPGRAPH, overshoot between 10 − 30% at lower H
⊥.
< 270 GeV (+3) T p
≤ 240
< 240 GeV (+2.5) T p
≤ 210
< 210 GeV (+2) T p
≤ 180
< 180 GeV (+1.5) pT
≤ 150
< 150 GeV (+1) T p
≤ 120
< 120 GeV (+0.5) pT
≤ 90
< 90 GeV (+0) T p
≤ 70
Data 2010 HEJ (parton level) POWHEG + PYTHIA POWHEG + HERWIG
dijet selection T Leading p = 20 GeV Q0
ATLAS
y
∆
0 1 2 3 4 5 6
Gap fraction
0 1 2 3 4 5
(TeV) HT
0.5 1 1.5 2 2.5
32R
0 0.2 0.4 0.6 0.8 1
(TeV) HT
0.5 1 1.5 2 2.5
32R
0 0.2 0.4 0.6 0.8
1 CMS
= 7 TeV s
=36 pb-1 Lint
R=0.5 anti-KT
Data PYTHIA6 tune Z2 PYTHIA6 tune D6T PYTHIA8 tune 2C MADGRAPH + PYTHIA6 tune D6T ALPGEN + PYTHIA6 tune D6T HERWIG++ tune 2.3 Systematic Uncertainty
Fig. 5. Gap-fraction (left) for the two leading jets in p
⊥as a function of ∆y for various intervals of ¯ p
⊥as measured by AT- LAS (markers and yellow error band) compared to HEJ calcula- tions (blue band) and NLO simulations with POWHEG interfaced to PYTHIA (red dashes) and HERWIG (blue dot-dashes); Ratio of inclusive 3-jet over the 2-jet cross sections R
32as function of to- tal transverse momentum H
⊥(right) as measured by CMS (black dots and yellow uncertainty band) compared to various simu- lations using di ff erent PYTHIA tunes, MADGRAPH, ALPGEN and HERWIG++.
5 Jet mass and sub-structure
In the high energy regime of LHC, heavy objects with masses O(100 GeV), can receive large Lorentz boosts such that their decay products are measured in a single jet. Sev- eral approaches are considered to explore the sub-structure of these jets with the aim to identify such heavy objects.
Among them are:
C / A filtering: The clustering of large (R ' 1.2) Cambridge- Aachen (C / A) [19] type jets is reversed until a large drop in jet-mass is observed. The remaining constituents are re-clustered with a smaller R parameter.
Jet pruning: C / A or k
⊥[20,21] jet-clustering is performed on the constituents of a large jet and in each clustering step the softer of the two clusters being combined is discarded if it’s transverse momentum is below a cer- tain fraction of the original jet p
⊥and the angular dis- tance between the two clusters is large.
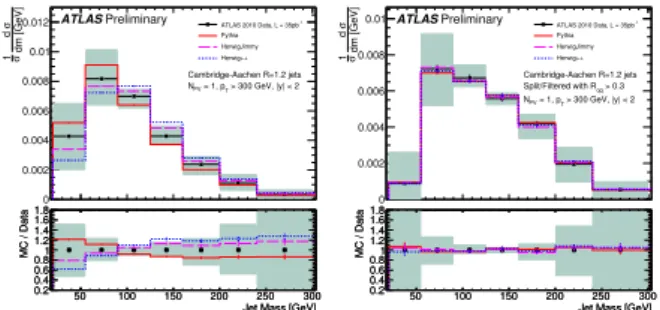
For the jet sub structure algorithms to be useful they have to be tested on QCD jets as this will be the main back- ground. C / A Filtering is useful for the decays of heavy par- ticles to two low mass objects and the QCD behavior has been studied in ATLAS in [22]. The mass drop m
1/m
jetof the leading subjet is required to be smaller than 0.67 (light subjet) and the p
⊥asymmetry
min(p
1⊥, p
2⊥) × ∆R
1,2/m
jet2larger than 0.09 (fairly symmetric). Once a reversed clus-
tering step with these properties is found the current jet is
re-clustered with C / A and R = min(0.3, ∆R
1,2/2) finding n
new subjets of which the leading min(3, n) are combined
to give the final C / A filtered jet. Figure 6 shows the spec-
trum of jet masses for C / A jets with R = 1.2 before and
after the filtering procedure in events with exactly one pri-
mary vertex (to remove pile-up) and at least one jet with
p
⊥> 300 GeV and |y| < 2. The agreement with all three
predictions is good although HERWIG++ produces jets with
larger mass (before filtering) compared to data. Jet prun-
EPJ Web of Conferences
50 100 150 200 250 300
dm [GeV]
σd σ1
0 0.002 0.004 0.006 0.008 0.01
0.012 ATLAS 2010 Data, L = 35pb-1
Pythia HerwigJimmy Herwig++
Cambridge-Aachen R=1.2 jets > 300 GeV, |y| < 2 = 1, pT NPV
Preliminary ATLAS
Jet Mass [GeV]
50 100 150 200 250 300
MC / Data
0.2 0.4 0.6 0.81 1.2 1.4 1.61.8
Jet Mass [GeV]
50 100 150 200 250 300
MC / Data
0.2 0.4 0.6 0.81 1.2 1.4
1.61.8 50 100 150 200 250 300
dm [GeV]
σd σ1
0 0.002 0.004 0.006 0.008
0.01 ATLAS 2010 Data, L = 35pb-1
Pythia HerwigJimmy Herwig++
Cambridge-Aachen R=1.2 jets > 0.3 Split/Filtered with Rqq
> 300 GeV, |y| < 2 = 1, pT NPV
Preliminary ATLAS
Jet Mass [GeV]
50 100 150 200 250 300
MC / Data
0.2 0.4 0.6 0.81 1.2 1.4 1.61.8
Jet Mass [GeV]
50 100 150 200 250 300
MC / Data
0.2 0.4 0.6 0.81 1.2 1.4 1.61.8
Fig. 6. Jet masses for C / A jets with R = 1.2 before (left) and after (right) the filtering procedure (see text) as measured by ATLAS.
The data (black points and shaded error band) is fully corrected for detector e ff ects and compared to PYTHIA, HERWIG/JIMMY and HERWIG++. The lower portions of the plots show ratios of the distributions over data.
2) (GeV/c mjet
0 20 40 60 80 100 120 140
Probability
0 0.02 0.04 0.06 0.08 0.1 0.12 0.14 0.16 0.18 0.2
0.22 DataPythia TuneZ2
Pythia TuneD6T Herwig++ Tune23
= 7TeV s -1 at 34.7 pb CMS Preliminary Jet Pruning Algorithm
mjet1 0 0.1 0.20.3 0.40.5 0.60.70.8 0.9m1
Probability
0 0.005 0.01 0.015 0.02 0.025 0.03 0.035 0.04
0.045 Data
Pythia TuneZ2 Pythia TuneD6T Herwig++ Tune23
= 7TeV s -1 at 34.7 pb CMS Preliminary Jet Pruning Algorithm