A TLAS-CONF-2012-097 09 July 2012
ATLAS NOTE
ATLAS-CONF-2012-097
July 6, 2012
Measuring the b-tag e ffi ciency in a t t ¯ sample with 4.7 fb − 1 of data from the ATLAS detector
The ATLAS Collaboration
Abstract
Many physics analyses in ATLAS depend on the reconstruction of b-jets. Aside from reliable b-tagging algorithms, an appropriate description of the b-tagging efficiencies based on measurements with data is essential for correctly modelling the measurements in Monte Carlo simulation. Furthermore, the systematic uncertainties need to be estimated realisti- cally. Since many analyses at a centre of mass energy of √
s = 7 TeV include high p T jets, it is desirable to calibrate the b-tagging algorithms at comparable jet energies. With the large data sample collected in 2011 of 4.7 fb − 1 , new calibration methods based on t¯ t events have been developed. The measurements of the b-tagging efficiency are provided in the form of jet p T dependent scale factors that correct the b-tagging performance in simulation to that observed in data. For all b-tagging algorithms calibrated, the scale factors measured with the various t t ¯ based methods are in good agreement with each other. The total uncertainties range from 5% to 15% for jet p T in the range 25 GeV to 300 GeV.
c Copyright 2012 CERN for the benefit of the ATLAS Collaboration.
Reproduction of this article or parts of it is allowed as specified in the CC-BY-3.0 license.
1 Introduction
The identification of b-jets is of great importance in many physics analyses at the LHC. The performance of b-tagging algorithms has to be validated using data, as the Monte Carlo simulation does not fully de- scribe the performance of the detector. The calibration of b-tagging algorithms includes the measurement of the mis-tag rates and b-tagging efficiency.
The main b-tagging efficiency calibration methods used so far, the so called system8 and p rel T meth- ods, are described in detail in [1] based on an integrated luminosity of L = 4.7 fb − 1 collected in 2011.
These measurements are based on a sample of jets with muons inside, where the muons are serving as a reference b-tagging algorithm to obtain a b-jet sample on which the calibrations can be performed. At the LHC, the large t t ¯ production cross section of σ t t ¯ = 177 ± 3(stat.) +8 − 7 (sys.) ± 7(lum.) pb [2] offers an alternative source of events enriched in b-jets. This distinctive topology with high p T leptons, multiple jets, and large missing transverse momentum provides highly selective trigger objects and is relatively easy to reconstruct. With the large integrated luminosity of 4.7 fb − 1 collected during 2011, the methods based on t t ¯ selections have become competitive for the first time. In addition to providing b-tagging calibration measurements in an inclusive b-jet sample rather than a sample of semileptonic b-jets, these methods also allow to extend the calibrated p T range. Furthermore, the t t ¯ environment of high jet multiplicity and high p T b-jets is more similar to the final states to which b-tagging is applied than the semileptonic jet sample.
This note presents analyses performed with three different methods using two statistically indepen- dent selections of t t ¯ events according to the single lepton and dilepton decay modes of top quark pairs.
Applying the same calibration method to the two independent data selections and to calibrate the same data selection with different, independent methods is an essential cross check to ensure the reliability of the individual calibration analyses. The results of all calibration methods are presented in the form of
p T -dependent scale factors κ data/sim ε b , defined as
κ data/sim ε b (p T ) = ε data b (p T )
ε sim b ( p T ) , (1)
where ε sim b is the fraction of b-jets which are tagged in simulated events, with the jet flavour defined by matching to generator level partons. In physics analyses, these p T -dependent scale factors are then ap- plied as weights to the jets in Monte Carlo simulation, to reproduce the b-tagging performance measured in data.
2 Data, simulated samples and top quark pair reconstruction
2.1 Monte Carlo samples
The t t ¯ signal is simulated using MC@NLO v3.41 [3] with the mass of the top quark set to 172.5 GeV and with the cross section normalised to the approximate NNLO calculation from Hathor 1.2 [4] using the MSTW 2008 50% PDF sets [5], incorporating PDF+α S uncertainties according to the MSTW pre- scription [6] cross checked with the approximate NNLO calculation of Cacciari et al. [7] as implemented in Top++1.0 [8]. For the main backgrounds, which consist of W /Z boson production in association with multiple jets, ALPGEN v2.13 [9] is used, which implements the exact LO matrix elements for final states with up to six partons. Using the LO PDF set CTEQ6L1 [10], the following backgrounds are generated:
W+jets events with up to five partons, Z/γ ∗ +jets events with up to five partons and with the dilepton
invariant mass m ℓℓ > 40 GeV and diboson WW+jets, WZ+jets and ZZ+jets events. A separate sample
of Z boson production generated with ALPGEN is used to cover the region 10 GeV < m ℓℓ < 40 GeV.
The MLM [9, 11] matching scheme of the ALPGEN generator is used to remove overlaps between the n and n + 1 parton samples.
For all but the diboson processes, separate samples are generated that include b b ¯ quark pair pro- duction at the matrix-element level. In addition, for the W+jets process, separate samples containing Wc+jets and Wc c+jets events are produced. ¯
The MC@NLO generator is used for the background of single-top s- and Wt-channel and AcerMC for t-channel production. The uncertainty due to the choice of t t ¯ generator is evaluated by comparing the predictions of MC@NLO with those of POWHEG [12] interfaced to HERWIG or PYTHIA.
The flavour labeling of jets in Monte Carlo simulation is done by spatially matching the jet with generator level partons: if a b-quark is found within ∆R = p
∆η 2 + ∆φ 2 < 0.3 of the jet direction, the jet is labeled as a b-jet. If no b-quark is found the procedure is repeated for c-quarks and τ-leptons. A jet for which no such association could be made is labeled as a light-flavour jet. In this note, tau lepton induced jets are also treated as light jets.
2.2 Event selection
Events in the single lepton and dilepton t t ¯ channels are triggered using a high p T single lepton trigger (electron or muon). The key objects for b-tagging are the reconstructed primary vertex, the calorimeter jets, and tracks reconstructed in the inner detector. Jets are reconstructed from topological clusters [13]
of energy in the calorimeter using the anti-k t algorithm with a distance parameter of 0.4 [14–16]. The jet energy is calibrated using p T - and η-dependent correction factors [17]. The tracks are associated with the calorimeter jets with a spatial matching in ∆R(jet, track) = p
(∆η) 2 + (∆φ) 2 [18]. Since a well- reconstructed primary vertex is important in b-tagging analyses, all measurements require at least three tracks associated with the primary vertex. The primary vertex is defined to be the vertex for which the associated tracks have the highest sum in squared transverse momenta. The t t ¯ analyses require isolated electrons and muons, as well as missing transverse momentum.
In all t¯ t analyses, both in the single lepton and dilepton channels, the b-tagging efficiency measure- ment is performed in a sample comprising all lepton flavour combinations (e+jets and µ+jets or ee, µµ and eµ).
2.2.1 Selection of the single lepton sample
In the single lepton channels (e+jets and µ+jets), the following event selection is applied:
• The appropriate single electron (with trigger thresholds at 20, 22 or 45 GeV, depending on the data taking period) or single muon trigger (trigger threshold at 18 GeV) has fired.
• The event contains exactly one reconstructed lepton with p T > 25 GeV (e) or p T > 20 GeV (µ), matching the corresponding high-level trigger object.
• In the e+jets channel, the missing transverse momentum E miss T > 30 GeV and the transverse mass m T (lν) > 30 GeV, while, in the µ+jets channel, E T miss > 20 GeV and E miss T + m T (lν) > 60 GeV.
Here, m T (lν) is the transverse mass of the selected lepton and the E miss T vector. These cuts reduce the contribution from multijet background.
• The event is required to have at least four jets with p T > 25 GeV, | η | < 2.5 and a jet vertex fraction
(JVF) with respect to the primary vertex of | JVF | > 0.75. The JVF of a jet with respect to a vertex
is defined as the ratio of the p T of matched tracks originating from that vertex to the total p T of all
tracks matched to the jet
JVF(jet i , vtx j ) = P
k p T (trk jet k i , vtx j ) P
n P
l p T (trk jet l i , vtx n )
(2) and can be interpreted as the probability of the jet to originate from that vertex.
2.2.2 Background estimation in the single lepton channel
The dominant background in the single lepton channel arises from W boson production with associated jets (W+jets). Its estimate is based on the prediction from Monte Carlo simulation, corrected with scale factors derived directly from data. The correction of the overall normalisation is obtained with a charge asymmetry method [19]. The flavour composition of the W+jets sample is measured with a tag counting method [20], which provides scale factors for Wb b/c ¯ c+jets, ¯ Wc+jets and W with light flavour jets events used to correct Monte Carlo simulation predictions.
The second most important contribution to the background comes from multijet production and is measured directly in data using the matrix method which relies on finding a relationship between events with real and fake leptons which is described in [21]. Rate estimates of other backgrounds processes, such as single top, diboson and Z+jets production are obtained from Monte Carlo simulation.
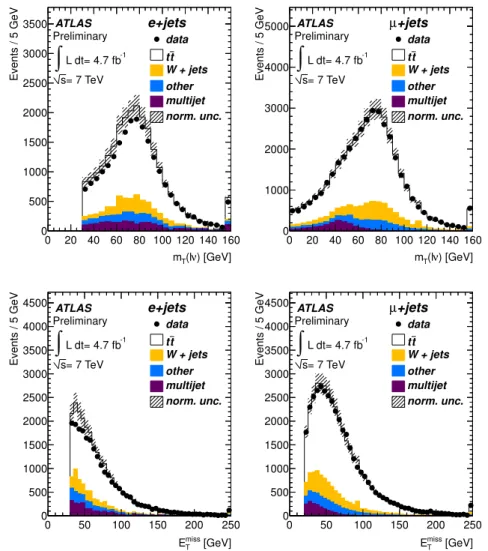
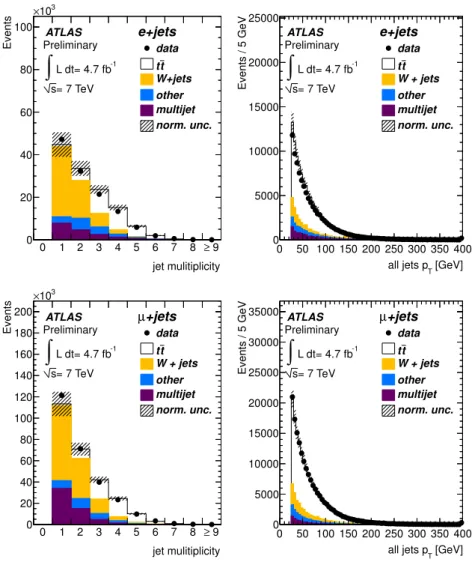
Figure 1 shows the transverse mass m T (lν) of the lepton and E T miss vector, as well as E miss T spectrum and in Figure 2 the jet multiplicity and jet p T is presented. Those distributions are sensitive to a correct description of the multijet and W+jets backgrounds, and they all show a good agreement between the predicted background and signal contributions and data.
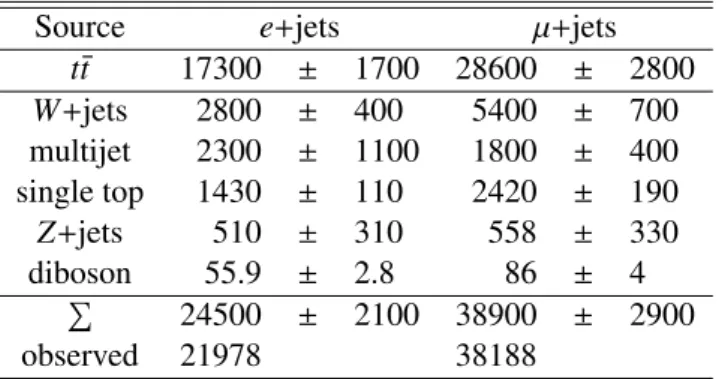
The final yields of the event selection for e+jets and µ+jets channels are presented in Table 1.
Source e+jets µ+jets
t t ¯ 17300 ± 1700 28600 ± 2800
W+jets 2800 ± 400 5400 ± 700
multijet 2300 ± 1100 1800 ± 400 single top 1430 ± 110 2420 ± 190
Z+jets 510 ± 310 558 ± 330
diboson 55.9 ± 2.8 86 ± 4
P 24500 ± 2100 38900 ± 2900
observed 21978 38188
Table 1: The number of events passing the single lepton selection requirements corresponding to a lumi-
nosity of 4.7 fb − 1 together with theoretical uncertainties on the cross sections (t t, single top and ¯ Z+jets
production) or uncertainties on the estimation directly from data (W+jets and multijet).
) [GeV]
ν
T
(l m
0 20 40 60 80 100 120 140 160
Events / 5 GeV
0 500 1000 1500 2000 2500 3000
3500 e+jets
= 7 TeV s ATLAS Preliminary
L dt= 4.7 fb
-1∫ data t W + jets t
other multijet norm. unc.
) [GeV]
ν
T
(l m
0 20 40 60 80 100 120 140 160
Events / 5 GeV
0 1000 2000 3000 4000
5000 µ +jets
= 7 TeV s ATLAS Preliminary
L dt= 4.7 fb
-1∫ data t W + jets t
other multijet norm. unc.
[GeV]
miss
E
T0 50 100 150 200 250
Events / 5 GeV
0 500 1000 1500 2000 2500 3000 3500 4000
4500 e+jets
= 7 TeV s ATLAS Preliminary
L dt= 4.7 fb
-1∫ data t W + jets t
other multijet norm. unc.
[GeV]
miss
E
T0 50 100 150 200 250
Events / 5 GeV
0 500 1000 1500 2000 2500 3000 3500 4000
4500 µ +jets
= 7 TeV s ATLAS Preliminary
L dt= 4.7 fb
-1∫ data t W + jets t
other multijet norm. unc.
Figure 1: Transverse mass m T (lν) of the lepton and E miss T (upper row) for the e+jets channel (left) and µ+jets channel (right). E miss T spectra (bottom row) for the e+jets channel (left) and µ+jets channel (right).
All event selection criteria, including the requirement of at least 1 b-tagged jet, are applied. “Other” is a sum of contributions from Z+jets, single top and diboson production. The last bin is inclusive in all figures.
2.2.3 Selection of the dilepton sample
A very clean sample of t t ¯ events with dileptonic decays (ee, µµ and eµ) can be obtained with the following event selection criteria:
• The appropriate single electron (trigger threshold at 20, 22 or 45 GeV depending on the data taking period) or single muon trigger (trigger threshold at 18 GeV) has fired.
• Exactly two oppositely charged leptons (ee, µµ or eµ), with the electron candidate satisfying p T >
25 GeV, and the muon candidate p T > 20 GeV, where at least one of them must be associated with a high-level lepton trigger object.
• At least two jets with p T > 25 GeV, | η | < 2.5 and jet vertex fraction of | JVF | > 0.75.
jet mulitiplicity 0 1 2 3 4 5 6 7 8 ≥ 9
Events
0 20 40 60 80 100
10
3×
e+jets
= 7 TeV s ATLAS Preliminary
L dt= 4.7 fb
-1∫ data t W+jets t
other multijet norm. unc.
[GeV]
all jets p
T0 50 100 150 200 250 300 350 400
Events / 5 GeV
0 5000 10000 15000 20000 25000
e+jets
= 7 TeV s ATLAS Preliminary
L dt= 4.7 fb
-1∫ data t W + jets t
other multijet norm. unc.
jet mulitiplicity 0 1 2 3 4 5 6 7 8 ≥ 9
Events
0 20 40 60 80 100 120 140 160 180 200
10
3×
+jets µ
= 7 TeV s ATLAS Preliminary
L dt= 4.7 fb
-1∫ data t W + jets t
other multijet norm. unc.
[GeV]
all jets p
T0 50 100 150 200 250 300 350 400
Events / 5 GeV
0 5000 10000 15000 20000 25000 30000
35000 µ +jets
= 7 TeV s ATLAS Preliminary
L dt= 4.7 fb
-1∫ data t W + jets t
other multijet norm. unc.
Figure 2: Jet multiplicity (left) in events passing the single lepton selection and the p T of all jets (right) in the e+jets channel (upper row) and µ+jets channel (bottom row). “Other” is a sum of contributions from Z+jets, single top and diboson production. The last bin is inclusive in all figures.
• ee and µµ channels:
– To suppress backgrounds from Z+jets and multijet events, the missing transverse momentum must satisfy E miss T > 60 GeV, and the invariant mass of the two leptons must differ by at least 10 GeV from the Z boson mass (Z mass veto): | m ℓℓ − m Z | > 10 GeV.
– To suppress backgrounds from Υ and J/ψ decays, a low mass cut of m ℓℓ > 15 GeV is applied.
• eµ channel:
– In the eµ channel, no E miss T or Z boson mass veto cuts are applied. However, the scalar sum of the transverse momenta of the jets and of the charged leptons H T (ℓ, jets), must satisfy H T > 130 GeV to further suppress background from the Z( → ττ)+jets production.
2.2.4 Background estimation in the dilepton channel
The dominant background in the dilepton channel is originating from fake leptons. This background con-
tains W boson production with associated jets, single top in s- and t-channel, the single lepton decay of t t ¯
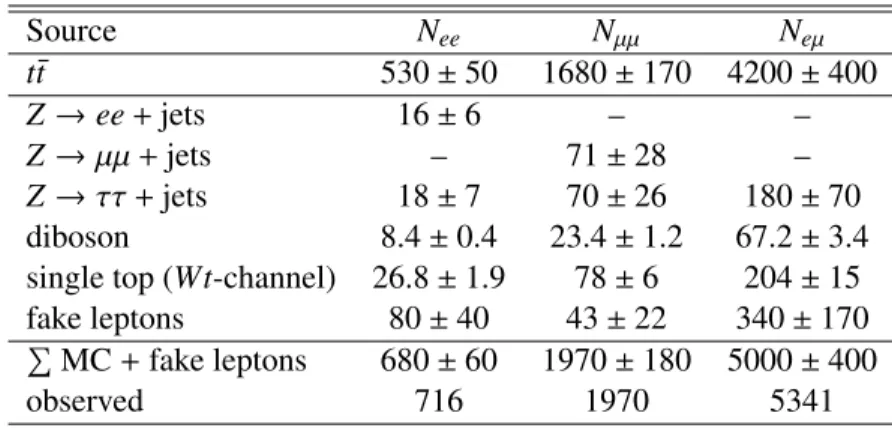
Source N ee N µµ N eµ
t¯ t 530 ± 50 1680 ± 170 4200 ± 400
Z → ee + jets 16 ± 6 – –
Z → µµ + jets – 71 ± 28 –
Z → ττ + jets 18 ± 7 70 ± 26 180 ± 70
diboson 8.4 ± 0.4 23.4 ± 1.2 67.2 ± 3.4
single top (Wt-channel) 26.8 ± 1.9 78 ± 6 204 ± 15
fake leptons 80 ± 40 43 ± 22 340 ± 170
P MC + fake leptons 680 ± 60 1970 ± 180 5000 ± 400
observed 716 1970 5341
Table 2: The number of events passing the dilepton selection requirements presented for the corre- sponding ℓℓ-channel separately corresponding to a luminosity of 4.7 fb − 1 . Shown uncertainties are the theoretical uncertainties on the cross section for simulation.
pairs and multijet events. There are two sources of faked prompt leptons: electron-like jets reconstructed as electrons or non-prompt leptons from a decay of a heavy flavour hadron within a jet.
In the dilepton sample the fake lepton background is estimated directly from data with a matrix method [21] for each of the three channels separately. All background processes which contain two prompt leptons (diboson, Z+jets and single top in the Wt-channel) are directly taken from the simulation.
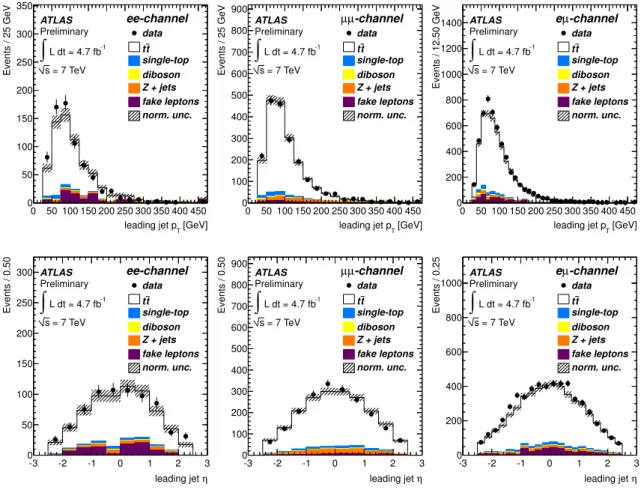
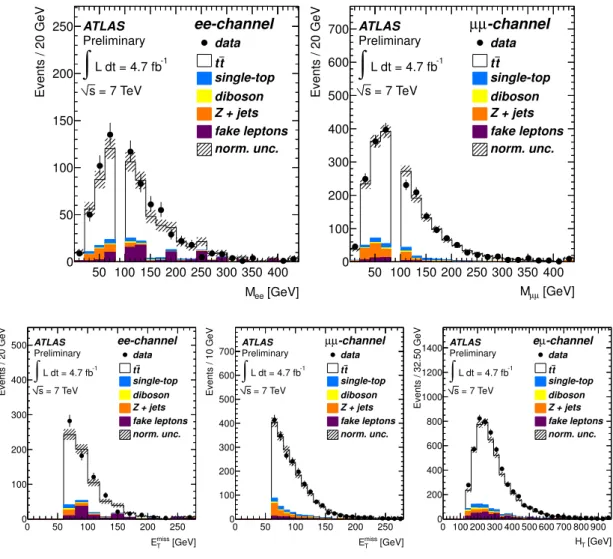
The final yields for the three different channels are presented in Table 2, while the distributions, showing the leading jet p T and η, invariant dilepton mass, E T miss and H T , can be found in Figures 3 and 4.
In all figures a good agreement between data and simulation can be seen.
2.3 b-tagging algorithms
The b-tagging algorithms calibrated in this note are SV0, IP3D+SV1, JetFitterCombNN and MV1. More details about SV0 can be found in [22] while the IP3D+SV1 and JetFitterCombNN (also referred to as JetFitter+IP3D) algorithms are described in [23]. The MV1 algorithm is a neural network-based algorithm that uses the output weights of IP3D, SV1 and JetFitterCombNN as inputs.
The above b-tagging algorithms all provide an output weight w, discriminating between b-jets and non-b-jets. Lower values of w are assigned to c- and light-flavour jets, whereas the purity of b-jets increases with w. For each b-tagging algorithm a set of operating points, corresponding to a certain w cut value, are defined and calibrated:
• SV0: ε sim b = 50%
• IP3D + SV1: ε sim b = 60%, ε sim b = 70%, ε sim b = 80%
• JetFitterCombNN: ε sim b = 57%, ε sim b = 60%, ε sim b = 70%, ε sim b = 80%
• MV1: ε sim b = 60%, ε sim b = 70%, ε sim b = 75%, ε sim b = 85%
where ε sim b is the nominal b-tagging efficiency derived from an inclusive sample of simulated t¯ t events.
3 b-tagging calibration methods
The methods presented in this note to measure the b-tagging efficiency exploit the large b-jet content
of t t ¯ events. The tag counting method fits the multiplicity of b-tagged jets in t t ¯ candidate events while
the kinematic selection method measures the b-tagging rate of the leading jets in the t t ¯ signal sample.
[GeV]
leading jet p
T0 50 100 150 200 250 300 350 400 450
Events / 25 GeV
0 50 100 150 200 250 300 350
ee-channel ATLAS
Preliminary
= 7 TeV s
L dt = 4.7 fb
-1∫ data t single-top t diboson Z + jets fake leptons norm. unc.
[GeV]
leading jet p
T0 50 100 150 200 250 300 350 400 450
Events / 25 GeV
0 100 200 300 400 500 600 700 800
900 ATLAS µ µ -channel
Preliminary
= 7 TeV s
L dt = 4.7 fb
-1∫ data t single-top t diboson Z + jets fake leptons norm. unc.
[GeV]
leading jet p
T0 50 100 150 200 250 300 350 400 450
Events / 12.50 GeV
0 200 400 600 800 1000 1200
1400 ATLAS e µ -channel
Preliminary
= 7 TeV s
L dt = 4.7 fb
-1∫ data t single-top t diboson Z + jets fake leptons norm. unc.
η leading jet
-3 -2 -1 0 1 2 3
Events / 0.50
0 50 100 150 200 250
300 ATLAS ee-channel
Preliminary
= 7 TeV s
L dt = 4.7 fb
-1∫
data t t single-top diboson Z + jets fake leptons norm. unc.
η leading jet
-3 -2 -1 0 1 2 3
Events / 0.50
0 100 200 300 400 500 600 700 800
900 ATLAS µ µ -channel
Preliminary
= 7 TeV s
L dt = 4.7 fb
-1∫
data t t single-top diboson Z + jets fake leptons norm. unc.
η leading jet
-3 -2 -1 0 1 2 3
Events / 0.25
0 200 400 600 800 1000
-channel µ e ATLAS
Preliminary
= 7 TeV s
L dt = 4.7 fb
-1∫
data t t single-top diboson Z + jets fake leptons norm. unc.
Figure 3: Distributions of the p T (top) and η (bottom) of the leading jet for the ee, µµ and eµ channels.
Finally, the kinematic fit method uses a fit of the t¯ t event topology to extract highly purified sample of b-jets from which the b-tagging efficiency is obtained.
The tag counting and kinematic selection methods can be applied to both the single lepton and dilep- ton decay channels, whereas the kinematic fit method is restricted by construction to the single lepton channel.
3.1 Tag counting method
The tag counting method makes use of the fact that since the branching fraction of t → Wb in the Standard Model is very close to unity, each t t ¯ event is expected to contain exactly two real b-jets. If there were no other sources of b-jets and if only b-jets were b-tagged, the expected number of events with two b-tagged jets would be ε 2 b N sig while the number of events with one b-tagged jet would be ε b (1 − ε b ) 2N sig , where N sig is the number of t t ¯ signal events.
In reality, the mean number of reconstructed (or tagged) b-jets in a t¯ t event is not exactly two, since
the b-jets from the top quark decays can be out of the detector acceptance, and additional b-jets can be
produced through gluon splitting. Moreover, c-jets and light flavour jets, which come from the hadronic
W boson decay or initial or final state radiation, can be tagged as b-jets and consequently contribute to
the number of b-tagged jets in the event. These effects are taken into account by evaluating the expected
fractions, F i jk , of events containing i b-jets, j c-jets and k light-flavour reconstructed jets that pass the
event selection. The F i jk fractions are estimated from Monte Carlo simulation and are derived separately
[GeV]
M ee
50 100 150 200 250 300 350 400
Events / 20 GeV
0 50 100 150 200
250 ATLAS ee-channel
Preliminary
= 7 TeV s
L dt = 4.7 fb -1
∫ data t single-top t diboson Z + jets fake leptons norm. unc.
[GeV]
µ
M µ
50 100 150 200 250 300 350 400
Events / 20 GeV
0 100 200 300 400 500 600
700 ATLAS µ µ -channel
Preliminary
= 7 TeV s
L dt = 4.7 fb -1
∫ data t single-top t diboson Z + jets fake leptons norm. unc.
[GeV]
T
E
miss0 50 100 150 200 250
Events / 20 GeV
0 100 200 300 400
500 ATLAS ee-channel
Preliminary
= 7 TeV s
L dt = 4.7 fb
-1∫ data t single-top t diboson Z + jets fake leptons norm. unc.
[GeV]
T
E
miss0 50 100 150 200 250
Events / 10 GeV
0 100 200 300 400 500 600 700
-channel µ ATLAS µ
Preliminary
= 7 TeV s
L dt = 4.7 fb
-1∫ data t single-top t diboson Z + jets fake leptons norm. unc.
[GeV]
H
T0 100 200 300 400 500 600 700 800 900
Events / 32.50 GeV
0 200 400 600 800 1000 1200
1400 ATLAS e µ -channel Preliminary
= 7 TeV s
L dt = 4.7 fb
-1∫ data t single-top t diboson Z + jets fake leptons norm. unc.
Figure 4: Distributions of the invariant mass of two leptons in the ee- and µµ-channels (top) and the missing transverse momentum in the ee- and µµ-channels and H T in the eµ-channel (bottom).
for the t¯ t signal and the various background processes. The expected number of events with n b-jets is calculated as the sum of all these contributions. The b-tagging efficiency can be extracted by fitting the expected event counts to the observed counts.
The expected number of t¯ t signal events with n b-tagged jets, < N n >, is calculated as
< N n > = X
i, j,k
(σ t¯ t · BF · A t¯ t · L · F i jk t¯ t + N bkg · F bkg i jk ) × X
i ′ +j ′ +k ′ =n
i i ′
!
· ε b i ′ · (1 − ε b ) i − i ′ · j j ′
!
· ε c j ′ · (1 − ε c ) j − j ′ · k k ′
!
· ε l k ′ · (1 − ε l ) k − k ′
, (3)
where i, j and k (i ′ , j ′ and k ′ ) represent the number of pretagged (tagged) b-, c- and light-flavour jets.
BF is the branching fraction to each final state, (e+jets, µ+jets, ee, µµ and eµ), including leptonically
decaying τ-leptons, A t¯ t is the event selection efficiency for that particular final state and L is the integrated
luminosity. The binomial coefficients account for the number of arrangements in which the n-tags can
be distributed. The efficiencies to mis-tag a c-jet or light-flavour jet as a b-jet, ε c and ε l respectively, are
fixed to the values found in Monte Carlo simulation but with data driven scale factors applied [24]. N bkg
is the number of background events. In the dilepton channel, the expected number of Z+jets background events, N Z+jets , is treated separately from other backgrounds sources, N other , since it gives the largest contribution of all simulated background processes.
To apply the method as a function of p T , the F i jk fractions are computed in p T bins using only the jets in each event that fall in a given p T bin. For both signal and background the dominant fraction is F 000 which occurs when no jets fall in that particular p T bin. Since a single event can contribute to several p T
bins, this method maximises the use of the available jets in the sample.
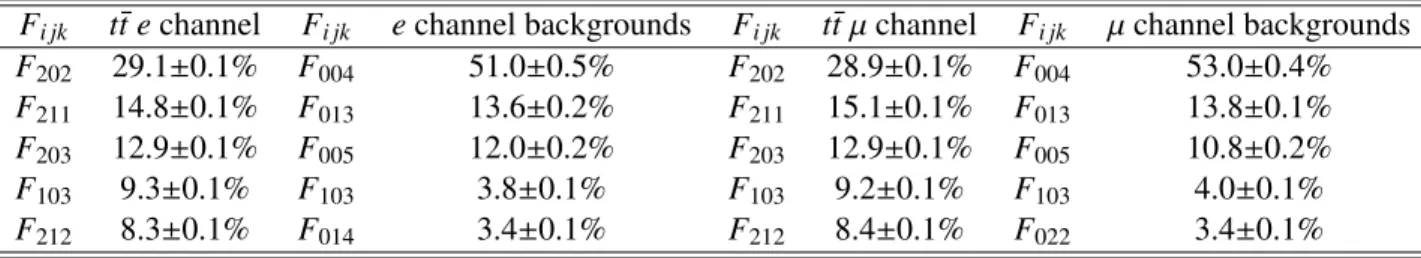
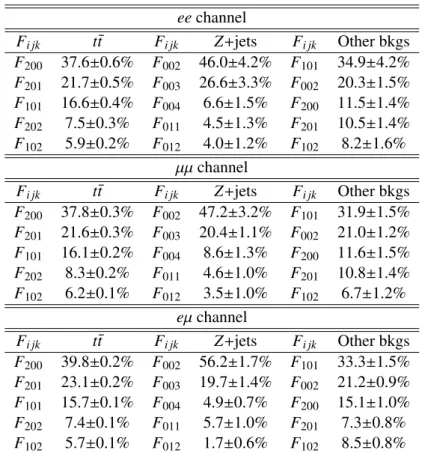
The dominant t t F ¯ i jk contributions in the single lepton channel are shown in Table 3 for all jets with p T above 25 GeV and Table 4 for the 30 − 40 GeV p T bin. The corresponding F i jk fractions in the dilepton channel are shown in Table 5.
F i jk t t e ¯ channel F i jk e channel backgrounds F i jk t t ¯ µ channel F i jk µ channel backgrounds F 202 29.1 ± 0.1% F 004 51.0 ± 0.5% F 202 28.9 ± 0.1% F 004 53.0 ± 0.4%
F 211 14.8 ± 0.1% F 013 13.6 ± 0.2% F 211 15.1 ± 0.1% F 013 13.8 ± 0.1%
F 203 12.9 ± 0.1% F 005 12.0 ± 0.2% F 203 12.9 ± 0.1% F 005 10.8 ± 0.2%
F 103 9.3 ± 0.1% F 103 3.8 ± 0.1% F 103 9.2 ± 0.1% F 103 4.0 ± 0.1%
F 212 8.3 ± 0.1% F 014 3.4 ± 0.1% F 212 8.4 ± 0.1% F 022 3.4 ± 0.1%
Table 3: The leading F i jk fractions for jets with p T > 25 GeV in the e+jets and µ+jets channels, obtained from the simulated t t ¯ and inclusive background samples. Uncertainties are statistical only.
F i jk t t e ¯ channel F i jk e channel backgrounds F i jk t t ¯ µ channel F i jk µ channel backgrounds F 000 41.0 ± 0.1% F 001 37.6 ± 1.5% F 000 40.7 ± 0.1% F 001 37.4 ± 0.5%
F 001 25.1 ± 0.1% F 000 37.4 ± 0.8% F 001 25.3 ± 0.1% F 000 36.4 ± 0.3%
F 100 11.6 ± 0.1% F 002 13.8 ± 0.5% F 100 11.4 ± 0.1% F 002 14.4 ± 0.2%
F 101 6.5 ± 0.1% F 003 2.7 ± 0.3% F 101 6.5 ± 0.1% F 003 2.8 ± 0.1%
F 010 5.3 ± 0.1% F 100 2.4 ± 0.1% F 002 5.3 ± 0.1% F 010 2.5 ± 0.1%
Table 4: The leading F i jk fractions for jets with p T between 30 and 40 GeV in the e+jets and µ+jets channels, obtained from the simulated t t ¯ and inclusive background samples. Uncertainties are statistical only.
Different approaches are considered in the single lepton and dilepton analyses to take into account the contributions from background events. In the single lepton channel, the 0-jet bin is dominated by multijet and W+jets backgrounds and is therefore not included in the fit. The multijet background is subtracted from the n-tag distribution prior to performing the fit since the F i jk fractions cannot be reliably estimated from Monte Carlo simulation. For the remaining background processes, dominated by W+jets, F i jk bkg values are calculated from Monte Carlo simulations and included in the fit to extract the b-tagging efficiency. In the dilepton channel the main background obtained from Monte Carlo simulation, Z+jets, is included into the F i jk bkg parameters along with much smaller contributions from single top and diboson production. The dilepton channel suffers from a lower branching ratio but has a higher purity than the single lepton channel so the 0-tag bin is kept to minimize the statistical uncertainty of the measurement.
The extraction of parameters in Equation 3 from the data is performed using a likelihood fit with the MINUIT program. The likelihood function used is
L = Gaus(σ tt | σ tt,MC , δ σ tt,rmMC ) Gaus( ˜ N bkg | N bkg,MC , δ N bkg ) Y
n − tags
Pois(N n | < N n >). (4)
ee channel
F i jk t t ¯ F i jk Z+jets F i jk Other bkgs F 200 37.6 ± 0.6% F 002 46.0 ± 4.2% F 101 34.9 ± 4.2%
F 201 21.7 ± 0.5% F 003 26.6 ± 3.3% F 002 20.3 ± 1.5%
F 101 16.6 ± 0.4% F 004 6.6 ± 1.5% F 200 11.5 ± 1.4%
F 202 7.5 ± 0.3% F 011 4.5 ± 1.3% F 201 10.5 ± 1.4%
F 102 5.9 ± 0.2% F 012 4.0 ± 1.2% F 102 8.2 ± 1.6%
µµ channel
F i jk t t ¯ F i jk Z+jets F i jk Other bkgs F 200 37.8 ± 0.3% F 002 47.2 ± 3.2% F 101 31.9 ± 1.5%
F 201 21.6 ± 0.3% F 003 20.4 ± 1.1% F 002 21.0 ± 1.2%
F 101 16.1 ± 0.2% F 004 8.6 ± 1.3% F 200 11.6 ± 1.5%
F 202 8.3 ± 0.2% F 011 4.6 ± 1.0% F 201 10.8 ± 1.4%
F 102 6.2 ± 0.1% F 012 3.5 ± 1.0% F 102 6.7 ± 1.2%
eµ channel
F i jk t t ¯ F i jk Z+jets F i jk Other bkgs F 200 39.8 ± 0.2% F 002 56.2 ± 1.7% F 101 33.3 ± 1.5%
F 201 23.1 ± 0.2% F 003 19.7 ± 1.4% F 002 21.2 ± 0.9%
F 101 15.7 ± 0.1% F 004 4.9 ± 0.7% F 200 15.1 ± 1.0%
F 202 7.4 ± 0.1% F 011 5.7 ± 1.0% F 201 7.3 ± 0.8%
F 102 5.7 ± 0.1% F 012 1.7 ± 0.6% F 102 8.5 ± 0.8%
Table 5: The leading F i jk fractions in the ee, µµ and eµ channels, obtained from the simulated t t, ¯ Z+jets
and other background samples. Only the statistical uncertainty is shown.
The number of events in each n-tag bin is described by a Poisson probability with an average value corresponding to the number of expected events. The t¯ t cross section and N bkg are floating parameters of the fit but are each constrained by a Gaussian distribution with a width of one standard deviation of the respective theory uncertainties. The uncertainty introduced by the Monte Carlo simulation statistics has been estimated from the uncertainties given in the F i jk tables (Tables 3, 4 and 5) and is found to be negligible.
b-tagged jets n
0 1 2 ≥ 3
Events
0 10 20
103
×
tagged e+jets L dt = 4.7 fb
-1∫ data t t
W+jets Other Fake Leptons uncertainty ATLAS Preliminary
b-tagged jets n
0 1 2 ≥ 3
Events
0 10 20 30
103
×
+jets µ tagged L dt = 4.7 fb
-1∫ data t t
W+jets Other Fake Leptons uncertainty ATLAS Preliminary
b-tagged jets n
0 1 2 ≥ 3
Events
0 200 400
600 ee−channel
L dt = 4.7 fb
-1∫ data t t
Z+jets Other Fake Leptons uncertainty ATLAS Preliminary
b-tagged jets n
0 1 2 ≥ 3
Events
0 0.5 1 1.5
10
3×
µ µ −channel L dt = 4.7 fb
-1∫ data t t
Z+jets Other Fake Leptons uncertainty ATLAS Preliminary
b-tagged jets n
0 1 2 ≥ 3
Events
0 2 4
10
3×
µ e −channel L dt = 4.7 fb
-1∫ data t t
Z+jets Other Fake Leptons uncertainty ATLAS Preliminary
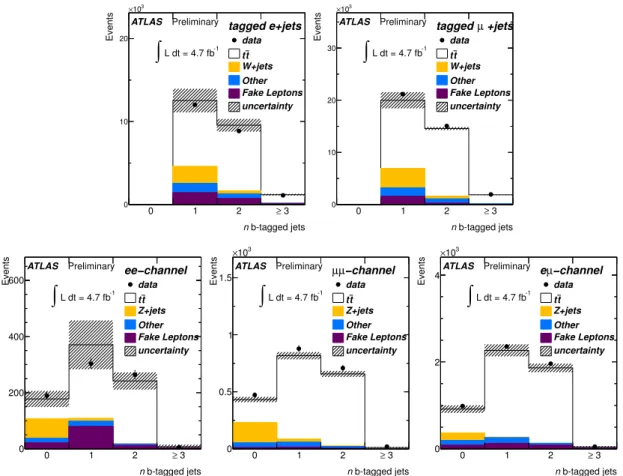
Figure 5: The b-tagged jet multiplicity distribution in Monte Carlo simulation superimposed with the distribution observed in data for e+jets (top left), µ+jets (top right), ee (bottom left), µµ (bottom middle) and eµ (bottom left) channels.
In Figure 5 the number of fitted b-tagged jets for all of the channels in comparison to Monte Carlo simulation are shown. The measured b-tagged jet multiplicity distributions are well reproduced by the Monte Carlo simulation.
3.2 Kinematic selection method
The kinematic selection method relies on the knowledge of the flavour composition of the t¯ t signal and background samples, and extracts the b-tagging efficiency by measuring the fraction of b-tagged jets in data. Given an expected fraction of b-, c- and light-flavour jets, as well as the c- and light-flavour jet mis-tag efficiencies, the fraction of b-tagged jets in data is given by
f b− tag = ε b f b− jets + ε c f c− jets + ε l f l− jets + ε fake f fake (5)
which can be rearranged in the following way to solve for the b-tagging efficiency, ε b :
ε b = 1
f b − jets ·
f b − tag − ε c f c − jets − ε l f l − jets − ε fake f fake
. (6)
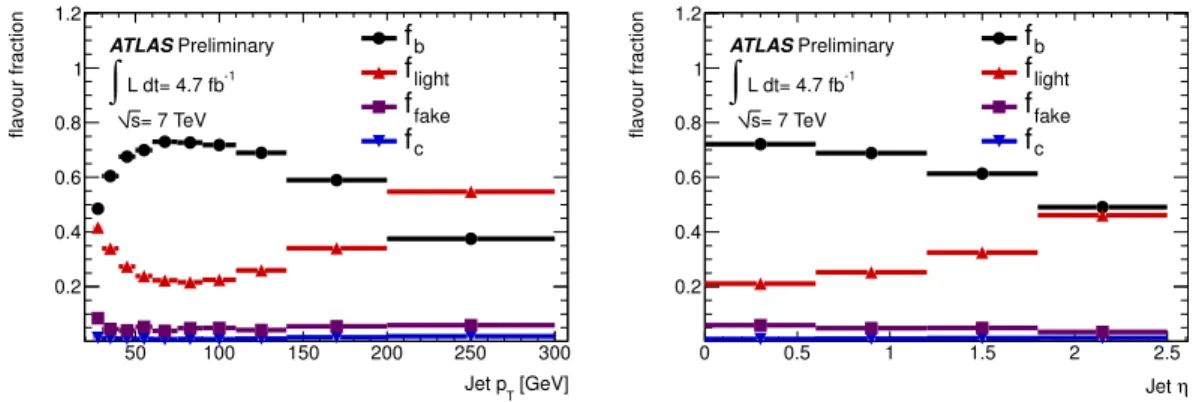
Here, f b − jets , f c − jets and f l − jets are the expected fractions of b-, c- and light-flavour jets from simulated events and the ε c and ε l are the mis-tag efficiencies for c- and light-flavour jets to be tagged as b-jets, which are taken from Monte Carlo simulation and corrected for data-to-simulation scale factors from [25, 26]. They are obtained from the sum of simulated events from all processes, assuming the expected jet kinematics and the expected signal and background contributions to the analysed sample. f fake is the fraction of jets from the fake lepton (in the dilepton channel) or multijet (in the single lepton channel) background and is determined from data. The flavour fractions are calculated with respect to the sum of jets from Monte Carlo simulation and follow the relation f b − jets + f c − jets + f l − jets + f fake = 1. The flavour composition of the jet sample obtained after applying a dilepton selection is shown in Figure 6 binned in both p T and η. The expected fraction of b-tagged fake lepton or multijet events, ε fake , is estimated from data, as detailed below.
[GeV]
Jet p
T50 100 150 200 250 300
flavour fraction
0.2 0.4 0.6 0.8 1 1.2
L dt= 4.7 fb
-1∫
= 7 TeV s
ATLAS Preliminary f b light
f f fake
f c
η Jet
0 0.5 1 1.5 2 2.5
flavour fraction
0.2 0.4 0.6 0.8 1 1.2
L dt= 4.7 fb
-1∫
= 7 TeV s
ATLAS Preliminary f b light
f f fake
f c
Figure 6: Expected jet flavour composition of the two leading jets in the selected dilepton events as a function of jet p T (left) and η (right).
The fraction of b-tagged multijet events in the single lepton channel, ε fake , is measured in a data control region enriched in multijet events. The control region is obtained by reverting the E miss T and m T (lν) selection criteria:
• e+jets channel: 5 GeV < E miss T < 30 GeV and m T (lν) < 25 GeV;
• µ+jets channel: 5 GeV < E T miss < 15 GeV or E miss T + m T (lν) < 60 GeV.
Moreover, the leptons in the control region are only required to fulfill looser selection criteria (so called loose leptons). Loose muons are not required to fulfill any isolation criteria, while the isolation for loose electrons is less strict than for the tight criterion used in the baseline event selection [27]. From the events measured in the control region in data the predicted contributions of the t¯ t, single top, diboson, W+jets and Z+jets processes obtained from Monte Carlo simulation are subtracted.
In the dilepton channel, the fraction of b-tagged jets coming from the fake lepton background ε fake is determined by taking into account only those events in which the charge of both leptons have the same sign. The remaining event selection criteria are required to be passed. Since it is expected that neither the dileptonic t t ¯ decay nor the background processes Z+jets or single top can produce same sign events, a sample which is very enriched in events having at least one fake lepton is obtained.
To increase the signal-to-background ratio as well as the purity of the analysed sample, the events in
the single lepton channel are required to, in addition to the selection from Section 2.2.1, have at least one
jet b-tagged with the MV1 tagging algorithm at an operating point corresponding to an efficiency of 70%.
Based on which jet is b-tagged, the single lepton sample is split in two sub-samples in the following way:
• If the leading jet is b-tagged, the b-tagging rate of the next three jets is measured (L234 sample).
• If the next-to-leading jet is b-tagged, the b-tagging rate of the leading jet is measured (L1 sample).
Subsequently, jets are divided in bins of p T , in which the number of b-tagged jets from each selection is counted. To calculate the b-tagging efficiency, the combined L1+L234 sample is used.
In the dilepton analysis, the b-jet fraction of the sample is increased by using only the two leading jets in each event, as this reduces the contamination of c- and light-flavour jets originating from gluon radiation.
3.3 Kinematic fit based method
The kinematic fit method is based on the selection of a high purity b-jet sample by applying a kinematic fit [28–30] to the events passing the selections described in Section 2.3. The kinematic fit performed on the single lepton t t ¯ event topology provides a mapping between the reconstructed jets and the lepton onto the b-jets originating directly from the top quark decays and the jets (leptons) from the subsequent hadronic (leptonic) W-boson decay. The kinematic fit exploits the masses of the two top quarks and W bosons as constraints, leading to four constraints in total with one unmeasured parameter resulting in three degrees of freedom. The fit, which is based on a χ 2 -minimisation method, is performed on all permutations the six highest p T jets, and the permutation with the lowest value in χ 2 is retained.
The b-tag efficiency is measured with the jets assigned by the fit to be the b-jet on the leptonic side of the event. While the kinematic fit selects the correct jet association with a reasonably high efficiency ( ≈ 60%), the permutation with the lowest χ 2 is not always the correct one. In addition to the combinatorial background the sample still contains physics background, such as single top and W+jets events. Therefore, a high purity weight distribution of b-jets can only be obtained from data by using a statistical background subtraction. This subtraction is done by dividing the sample into two orthogonal sub-samples based on information about the jets associated to the hadronic side of the event: the first sub- sample (“signal sample”) results from applying additional cuts resulting in a higher fraction of correct mappings, while the second sub-sample (“background sample”) is enriched in incorrect mappings. The additional cuts applied to the signal sample are:
• The jet identified by kinematic fitting with the b-jet on the hadronic side of the event needs to be b-tagged by the MV1 tagging algorithm at the 70% efficiency operating point. This is applied to suppress the W+jets events and incorrect permutations.
• The jets associated with the hadronic W-decay must not be b-tagged by the MV1 b-tagging algo- rithm at the 70% efficiency operating point.
• Only events with six or less jets with p T > 25 GeV are considered.
The background sample is instead defined by removing the b-tagging requirement on the hadronic b-jet and the jet multiplicity requirement and inverting the b-tagging veto on the jets associated to the W decay:
• One of the jets assigned by the kinematic fit to the hadronic W decay is required to be b-tagged by the MV1 tagging algorithm at the 70% efficiency operating point.
To verify that the signal sample is enriched in correct mappings at low values of fit χ 2 , while the
background sample is dominated by incorrect mappings at all values of fit χ 2 , a truth-match based on
a ∆R cut to the original partons of the hard interactions is performed in Monte Carlo simulation. Here, groupings of partons, hadron-level jets and reconstructed jets are chosen in a way that minimise the sum of their respective distances in the η − φ plane. Such a triplet is considered to be matched if the respective sum of the three distances in the η − φ-plane passes the requirement (∆R parton + ∆R hadron jet + ∆R reco jet ) < 0.5.
Due to e.g. unreconstructed jets, it will not always be possible to define the above triplets, and thus a portion of events will remain unmatched. The unmatched mappings remain in the analysis as they are, in Monte Carlo simulations the truth b-jets are taken into account independent from there matching status.
The χ 2 distribution of both the signal and background samples are shown together with the result of the truth-match in Figure 7. As desired, the signal sample has a sizable fraction of correct mappings, while the background sample almost exclusively is made up of unmatched or incorrect mappings. Fur- thermore, the correct mappings have predominantly a low χ 2 -value, while the high χ 2 -region is fully dominated by incorrect and unmatched mappings.
χ 2
0 10 20 30 40 50 60 70 80 90 100
Events
0 100 200 300 400 500 600
data t t W+jets
Z+jets diboson single-top multijets norm. unc.
ATLAS Preliminary L dt= 4.7 fb -1
∫ data t W+jets Z+jets t
diboson single-top multijets norm. unc.
χ 2
0 10 20 30 40 50 60 70 80 90 100
Events
0 100 200 300 400 500
600 ATLAS Preliminary L dt= 4.7 fb -1
∫ correct incorrect
unmachted
χ 2
0 10 20 30 40 50 60 70 80 90 100
Events
0 100 200 300 400 500 600
700 data
t t W+jets Z+jets diboson single-top multijets norm. unc.
ATLAS Preliminary L dt= 4.7 fb -1
∫ data t W+jets Z+jets t
diboson single-top multijets norm. unc.
χ 2
0 10 20 30 40 50 60 70 80 90 100
Events
0 100 200 300 400 500 600 700
800 ATLAS Preliminary L dt= 4.7 fb -1
∫ correct incorrect
unmachted
Figure 7: The χ 2 distributions of events in the signal sample (upper row) and the background sample (lower row). The overlaid truth-match is shown in the plots on the right.
The remaining background of incorrect mappings in the signal sample selected from data can there-
fore be estimated from the background sample. As events with high values of χ 2 are predominantly
incorrect mappings in both sub-samples, the background sample prediction can be normalised at high χ 2
values (χ 2 > 25), by using the scale factor
S BG = R ∞
25 dχ 2 S R ∞
25 dχ 2 B . (7)
The background-subtracted b-tag weight distribution of the b-jet from the leptonic decay in the signal sample, from which the b-tagging efficiency is eventually extracted, is subsequently derived by sub- tracting the b-tag weight distribution in the background sample, scaled according to Equation 7. As this subtraction scheme is performed on data, one significant advantage of this method is the reduced dependence on Monte Carlo simulation.
For the background subtraction method to work correctly it is imperative that the shape of the χ 2 distribution of the non-b portion of the background sample agrees with that of the non-b portion of the signal sample. This is verified in the upper left plot of Figure 9. It is furthermore crucial that the shapes of the b-tag weight distribution for b-jets and non-b-jets have the same shape in the signal and background samples. This is shown to be the case for the JetFitterCombNN b-tagging algorithm in Figure 8 and holds true for all b-tagging algorithms.
0 0.01 0.02 0.03 0.04 0.05 0.06
0.07 bjet distribtion
signal background ATLAS Preliminary
Simulation
JetFitterCOMBNN weight
-4 -2 0 2 4 6 8 10 12 14
sig/bg
0.51
1.5
0
0.05 0.1 0.15 0.2 0.25 0.3 0.35
0.4 nonb distribtion
signal background ATLAS Preliminary
Simulation
JetFitterCOMBNN weight
-4 -2 0 2 4 6 8 10 12 14
sig/bg
0.51 1.5
Figure 8: The weight distribution for the JetFitterCombNN b-tagging algorithm for b-jets (left) and non- b-jets (right) in the signal and background samples. The signal and background shapes are found to agree.
The measurement of the b-tagging efficiency is based on the b-tag weight distribution (see Sec- tion 2.3) of the sample of b-jets on the leptonic side of the event. An important advantage of this method is that a continuous calibration of the b-tag weight distribution is feasible, as the full distribution is re- constructed. The b-tag efficiency for a given operating point, corresponding to a certain weight cut w cut , can be calculated using the (normalised to unity) weight distribution T (w) of the selected b-jet sample after the background subtraction by integration above the threshold w cut :
ε(w cut ) = Z ∞
w cut
T (w) dw. (8)
Depending on the available statistics the measurement of the b-tag efficiency can be binned in any pa- rameter, for example p T or η.
The complete sequence of calibration steps for the MV1 b-tagging algorithm in the inclusive bin
(25 GeV < p T < 200 GeV) is presented in Figure 9. After a correct scaling of the background sample
(upper row) the prescription results in a background-subtracted distribution of the MV1 weight (lower left plot). Using Equation 8 the efficiency is derived (lower right). It is shown that the method applied to simulated events (“expected”) describes the distribution obtained from the sample of true b-jets in Monte Carlo simulated events. The scaling factor quoted is the ratio of the efficiency measured in data and the efficiency calculated from true b-jets in simulated events.
0 10 20 30 40 50 60 70 80 90 100
Events
200 400 600 800 1000 1200 1400
1600
signalnonb signal scaled. bkgd nonb bkgd
MV1 25-200 GeV
= 7 TeV
-1
s L dt= 4.7fb
∫
ATLAS Preliminary
0 10 20 30 40 50 60 70 80 90 100
data/mc
0.51 1.5
χ
20 10 20 30 40 50 60 70 80 90 100
nonb bg/sig 0.8
1 1.2
-0.2 0 0.2 0.4 0.6 0.8 1 1.2
Events
10 10
210
310
410
5signal nonb signal scaled. bkgd nonb bkgd
MV1 25-200 GeV
= 7 TeV
-1
s L dt= 4.7fb
∫
ATLAS Preliminary
-0.2 0 0.2 0.4 0.6 0.8 1 1.2
data/mc
0.51 1.5
MV1 weight
-0.2 0 0.2 0.4 0.6 0.8 1 1.2
nonb bg/sig 0.8 1 1.2
Normalized Events
10
-310
-210
-11 10
ATLAS Preliminary
data expected truth MV1 25-200 GeV
= 7 TeV
-1
s L dt = 4.7fb
∫
MV1 weight
-0.2 0 0.2 0.4 0.6 0.8 1 1.2
sign.
-2 -1 01 2
b
∈ b -T a g g in g E ff ic ie n cy
0.2 0.4 0.6 0.8 1 1.2 1.4
85%
75%
70%
60%
ATLAS Preliminary
data expected truth MV1 25-200 GeV
= 7 TeV
-1