ATLAS-CONF-2010-069 28July2010
ATLAS NOTE
ATLAS-CONF-2010-069
July 21, 2010
Performance of primary vertex reconstruction in proton-proton collisions at √
s =7 TeV in the ATLAS experiment
The ATLAS Collaboration
Abstract
Performance results of the primary vertex reconstruction of the ATLAS experiment in proton-proton collisions at a centre-of-mass energy of 7 TeV are presented. The primary vertex coordinate distributions, constrained by the beam-spot position and size, are shown.
The position resolution is assessed using a data-driven method.
1 Introduction
The ATLAS detector [1] is a general-purpose particle detector at the Large Hadron Collider (LHC [2]), designed to cover a wide range of physics measurements. For most of these analyses, the knowledge of the position of the primary interaction point (primary vertex) of the proton-proton collision is important.
Even though most of the collisions recorded so far originate from soft interactions, characterized by low transverse momentum tracks and large primary vertex resolutions, it is nevertheless interesting to study the vertex reconstruction performance on these events.
This note presents a first estimates of the coordinate resolutions of primary vertices reconstructed in ATLAS for minimum bias events in 7 TeV proton-proton collisions. About 3.4·106events taken in spring 2010 were used for this analysis, corresponding to an integrated luminosity of approximately 6 nb−1. The L1 MBTS 1 trigger was used for the selection of collision events. It relies on the combination of two different devices: the Beam Pick-up probes and the Minimum Bias Trigger Scintillators, for which at least a hit in one of the two end-caps is required [3, 4].
The reconstruction of the interaction vertex is based on the reconstruction of charged-particle tracks in the ATLAS inner detector. They are formed from signals in the high-resolution semiconductor pixel and silicon microstrip (SCT) detectors and, at higher radii with respect to the interaction point, from the information provided by the straw-tube tracking detectors (TRT). A detailed description of the Inner Detector and of its expected performance can be found in Ref. [1], and of the track reconstruction per- formance in Ref. [5]. The ATLAS coordinate system is defined in such a way that the z direction points anticlockwise along the LHC accelerator ring in the direction of the colliding beams, x points to the centre of the accelerator andypoints upwards. These three axes form a right-handed coordinate system.
2 Reconstruction of primary vertices
The reconstruction of primary vertices is organized in two steps: a) the primary vertex finding algorithm, dedicated to associate reconstructed tracks to the vertex candidates, and b) the vertex fitting algorithm, dedicated to reconstruct the vertex position and its corresponding error matrix. It also refits the associated tracks constraining them to originate from the reconstructed interaction point. The detailed implementa- tion of the finding and fitting algorithms is described below.
In this analysis, reconstructed tracks fulfilling the following quality requirements are used for the primary vertex reconstruction:
• pT>150 MeV,
• |d0|<4 mm,
• σ(d0)<5 mm,
• σ(z0)<10 mm,
• at least 4 hits in the SCT detector,
• at least 6 hits in the pixel and SCT detectors.
Here d0 and z0 denote the transverse and longitudinal impact parameters of tracks with respect to the centre of the luminous region, andσ(d0) andσ(z0) denote the corresponding uncertainties as estimated in the track fit. The symbol pT denotes the reconstructed track transverse momentum. The selection criteria based on the impact parameters are designed to remove a good fraction of the tracks originating from secondary interactions. As estimated from simulations, based on results obtained with the PYTHIA Monte Carlo program [6] and the full simulation of the ATLAS detector, in non-diffractive pp collisions
at 7 TeV, the above requirements are fulfilled by (83.5±0.1)% of reconstructed tracks corresponding to primary particles.
The luminous region in ATLAS is determined during a physics run, typically every≈ 10 minutes, by applying an unbinned maximum likelihood fit to the distribution of primary vertices recorded in this period of time, where the same primary vertex reconstruction algorithm is used as described in the following, but without applying the beam-spot constraint. A detailed description of how the beam-spot is determined and on the uncertainties connected with its determination can be found in Ref. [7].
The Iterative Vertex Finding approach used for this study works as follows:
• Reconstructed tracks compatible with originating from the interaction region are pre-selected ac- cording to the criteria listed above.
• A vertex seed is found by looking for the global maximum in the distribution of z coordinates of the tracks, computed at the point of closest approach to the beam spot center.
• The vertex position is determined using the adaptive vertex fitting algorithm [8], which takes as input the seed position and the tracks around it. The adaptive vertex fitter is a robustχ2based fitting algorithm which deals with outlying track measurements by down-weighting their contribution to the overall vertex χ2. The down-weighting is performed progressively, while the fit iterations proceed according to a fixed number of steps (deterministic annealing scheme [8]).
• Tracks incompatible with the vertex by more than approximately 7σare used to seed a new vertex.
The compatibility of the track to the vertex is expressed in terms of aχ2with 2 degrees of freedom.
The present cut isχ2 > 49. This procedure is repeated until no unassociated tracks are left in the event or no additional vertex can be found.
The very loose cut ofχ2 > 49 is intended to reduce the number of single vertices which split into two due to the presence of outlying track measurements.
In standard reconstruction, the parameters of the beam-spot are used both during the finding to pre- select compatible tracks and during the fitting step to constrain the vertex fit. The transverse beam-spot width in the 7 TeV runs varies between approximately 60µm for the first run and about 30µm for the later runs with squeezed beams. A small increase in the width during the fills due to the growth in emittance of the beams is also observed. The bunch length results in a luminous region size of approximately 20÷40 mm, depending on machine parameters.
In the vertex fit, the beam-spot constraint has a significant impact on vertices reconstructed out of very few tracks. There the transverse resolution is dominated by the beam-spot information. The typical resolution of a low multiplicity vertex (>100µm) is in fact significantly worse than the transverse beam- spot width (30-60µm). However, in the z direction, the length of the luminous region has no visible effect on the longitudinal resolution of the primary vertices, which is determined from the intrinsic longitudinal track resolution of the primary tracks; the only effect of the beam-spot constraint is to remove far outliers.
The level of expected pile-up is sufficiently low, with an average number of interactions per bunch crossing of less than 0.2, so that it is expected to have no significant impact on the vertex resolution for the data presented here.
3 Results
3.1 Distributions of primary vertex position
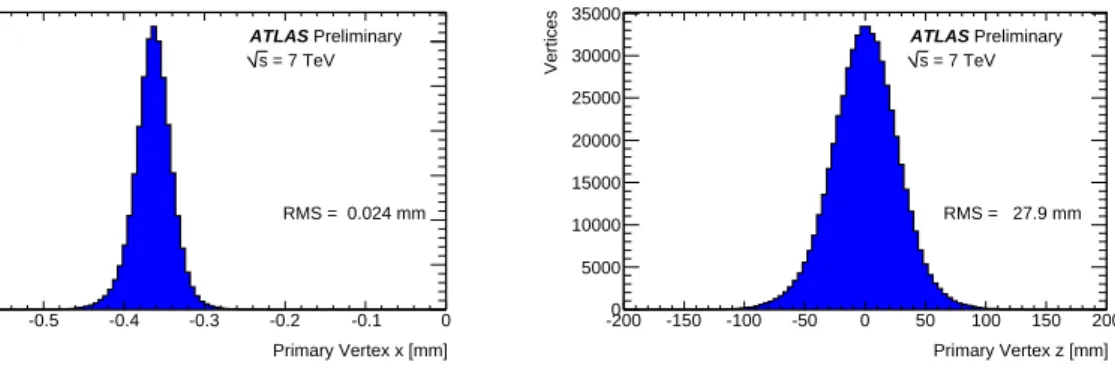
The distributions of the reconstructed primary vertex positions in the transverse plane (x coordinate) and along the z axis are shown in Fig. 1. As already mentioned, since the beam-spot constraint is used during
Primary Vertex x [mm]
-0.6 -0.5 -0.4 -0.3 -0.2 -0.1 0
Vertices
0 10000 20000 30000 40000 50000 60000
RMS = 0.024 mm ATLAS Preliminary
= 7 TeV s
Primary Vertex z [mm]
-200 -150 -100 -50 0 50 100 150 200
Vertices
0 5000 10000 15000 20000 25000 30000 35000
RMS = 27.9 mm ATLAS Preliminary
= 7 TeV s
Figure 1: Distribution of reconstructed primary vertices in 7 TeV data, in the transverse plane (x coordi- nate) (left) and in the longitudinal direction (right).
the vertex fit, the distribution of vertices in the transverse plane is pulled towards the position of the beam-spot, which varies from fill to fill and, with smaller amplitude, within a fill. In contrast, in the longitudinal direction the beam-spot constraint has nearly no effect.
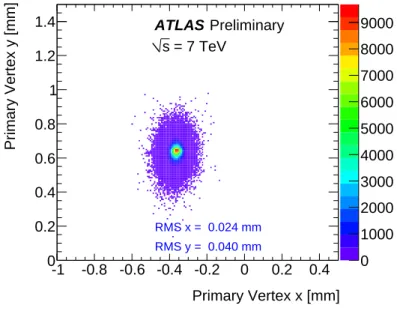
Two-dimensional distributions of the primary vertex positions in the x-y, x-z and y-z planes are shown in Figs. 2-3. It can be noted that the beam widths in x and inyare different. A significant tilt of the luminous region in the x-z plane is also observed.
3.2 Determination of scale factors for vertex errors
The description of the vertex errors in data is not necessarily the same as in the Monte Carlo simulation.
The estimation of the vertex uncertainty provided by the vertex fit is primarily based on the transverse and longitudinal impact parameter errors provided by the track reconstruction algorithm. The latter errors can also be significantly different in simulation and in data, since these depend on various factors, for instance the correct description of sub-detector hit cluster errors, multiple scattering, ionization energy losses due to material in the detector and the residual misalignment.
A correction to the vertex error provided by the vertex fit can be obtained by defining a scale factor Kxfor the errors on the vertex x coordinate, xPV:
σxPV,true =KxσxPV,fit, (1)
whereσxPV,true is the correct vertex uncertainty andσxPV,fitis the uncertainty estimated by the vertex fit.
Similar scale factors can be defined analogously for theyand z coordinates. The scale factor can then be derived from data by considering a large set of reconstructed primary vertices and making the hypothesis that the tracks used in the vertex fit really do originate from the reconstructed interaction point. By randomly splitting the reconstructed vertices in two, each conserving approximately half the original number of tracks, it is possible to use their separation to get an estimate of their combined intrinsic resolution. The two split vertices have to be reconstructed independently and therefore no beam-spot constraint during the fit is used. In order to avoid biases due to the outlier removal procedure which is performed during the vertex fit, it is essential not to remove any outliers before splitting the vertices into halves.
The scale factor can be determined by looking at the distribution of the pull, i.e. the distance between the vertex pairs, normalized to the respective error:
pullx = x1,PV−x2,PV q
σ2x
1,PV,fit+σ2x
2,PV,fit
. (2)
0 1000 2000 3000 4000 5000 6000 7000 8000 9000
Primary Vertex x [mm]
-1 -0.8 -0.6 -0.4 -0.2 0 0.2 0.4
Primary Vertex y [mm]
0 0.2 0.4 0.6 0.8 1 1.2 1.4
RMS x = 0.024 mm RMS y = 0.040 mm ATLAS Preliminary
= 7 TeV s
Figure 2: Two-dimensional distribution of reconstructed primary vertices in 7 TeV data, in the x-yplane.
0 500 1000 1500 2000 2500
Primary Vertex z [mm]
-200 -150 -100 -50 0 50 100 150 200
Primary Vertex x [mm]
-1 -0.8 -0.6 -0.4 -0.2 0 0.2 0.4
RMS x = 0.024 mm RMS z = 27.9 mm
ATLAS Preliminary = 7 TeV s
0 200 400 600 800 1000 1200 1400 1600 1800
Primary Vertex z [mm]
-200 -150 -100 -50 0 50 100 150 200
Primary Vertex y [mm]
0 0.2 0.4 0.6 0.8 1 1.2 1.4
RMS y = 0.040 mm RMS z = 27.9 mm
ATLAS Preliminary = 7 TeV s
Figure 3: Two-dimensional distributions of reconstructed primary vertices in 7 TeV data, in the x-z plane (left) and in they-z plane (right).
The standard deviation σof a Gaussian fit to this distribution provides an estimate of the scale factor Kx by which the uncertainty estimate provided by the vertex fit has to be rescaled to match the real uncertainty on the measurement of the vertex position. Since the pull distributions, in particular for low number of tracks per vertex (Ntrk) or low transverse momentum sum (
q
Pp2T), do not show a perfectly Gaussian behaviour, an iterative Gaussian fit is performed in the [−2σ,+2σ] interval, until no significant change in the fit parameters is seen anymore. The pulls are evaluated as a function of the mean Ntrk for the two vertices and as a function of
q
p2T(average), where p2T(average) is the average value of theP p2T for two vertices.The square root of sum of p2T is used because this quantity was found to be the most efficient criterion to identify the signal collisions among pile up.
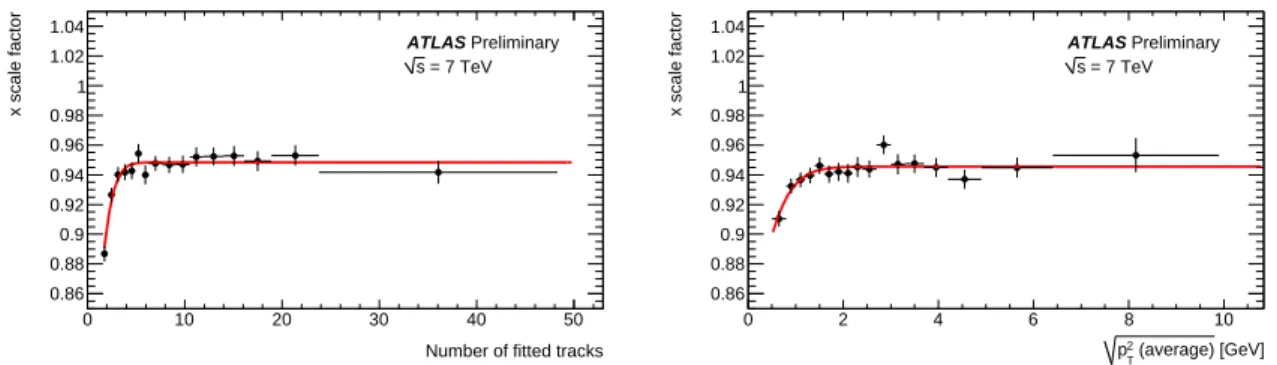
Although relatively close to unity, it is found that the scale factors K obtained using the vertex splitting technique do depend on Ntrk and on
q
p2T(average), as shown in Figs. 4-5. For high values of Ntrk (> 40) and of
q
p2T(average) (> 8 GeV) the results of the Gaussian fits are unreliable due to poor statistics, which becomes significantly worse when splitting the vertices into halves. Therefore a variable binning has been adopted.
The behaviour of theyscale factor appears to be identical to the x scale factor and thus will not be described separately. In order to reduce the statistical uncertainty of the scale factors, the distributions are approximated with a function, defined as:
f (x; KPV,x0, σ)= KPV 1+exph
−(x2−·σx02)2i, (3) where x = Ntrk or x =
q
p2T(average) and the parameter KPV represents the asymptotic scale factor at high values of x. This function models the experimental data very well. The systematic uncertainty due to the choice of the fitting function can be significant when extrapolating the fit results to higher values of Ntrk and
q
p2T(average). By using a simple first order polynomial as an alternative fit function, the resulting uncertainty in this region has been estimated to be within 1%. Therefore, an additional error of 1% as a conservative estimate of the related systematic uncertainty has been assigned.
The red curves in Figs. 4-5 represent the results of these fits. The turn-on behaviour of the scale factors in low pT or low vertex track multiplicity events may be due to the present dependence of the impact parameter error estimates of the tracks on their transverse momenta and is currently under inves- tigation. The asymptotic KPVscale factors are measured to be≈0.95 in the x direction and≈0.92 in the z direction.
Number of fitted tracks
0 10 20 30 40 50
x scale factor
0.86 0.88 0.9 0.92 0.94 0.96 0.98 1 1.02 1.04
ATLAS Preliminary = 7 TeV s
[GeV]
(average)
2
pT
0 2 4 6 8 10
x scale factor
0.86 0.88 0.9 0.92 0.94 0.96 0.98 1 1.02 1.04
ATLAS Preliminary = 7 TeV s
Figure 4: Estimated Kx factor as a function of the number of tracks Ntrk (left) and the value of q
p2T(average) (right).
Number of fitted tracks
0 10 20 30 40 50
z scale factor
0.86 0.88 0.9 0.92 0.94 0.96 0.98 1 1.02 1.04
ATLAS Preliminary = 7 TeV s
[GeV]
(average)
2
pT
0 2 4 6 8 10
z scale factor
0.86 0.88 0.9 0.92 0.94 0.96 0.98 1 1.02 1.04
ATLAS Preliminary = 7 TeV s
Figure 5: Estimated Kz factor as a function of the number of tracks Ntrk (left) and the value of q
p2T(average) (right).
0 100 200 300 400 500 600 700
Number of Tracks
0 10 20 30 40 50 60 70
x vertex Error [mm]
10-2
10-1
1 10 102
ATLAS Preliminary = 7 TeV s
0 200 400 600 800 1000
[GeV]
2 T
∑ p
0 1 2 3 4 5 6 7 8 9 10
x vertex Error [mm]
10-2
10-1
1 10 102
ATLAS Preliminary = 7 TeV s
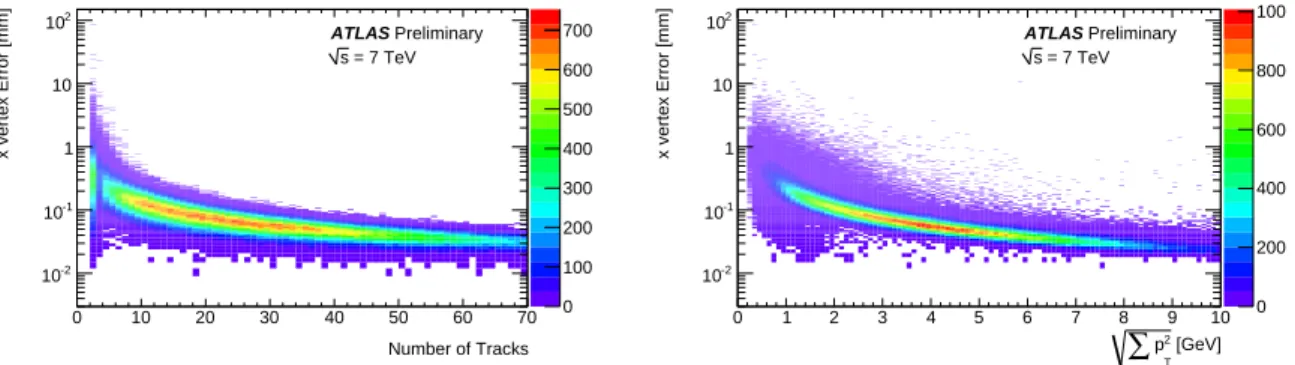
Figure 6: Two-dimensional distribution of reconstructed vertex errorsσxPV,fitas obtained from the vertex fit versus the number of tracks Ntrk(left) and versus the value of
q P
trkp2T(right).
0 100 200 300 400 500
Number of Tracks
0 10 20 30 40 50 60 70
z vertex Error [mm]
10-2
10-1
1 10 102
ATLAS Preliminary = 7 TeV s
0 100 200 300 400 500 600
[GeV]
2 T
∑ p
0 1 2 3 4 5 6 7 8 9 10
z vertex Error [mm]
10-2
10-1
1 10 102
ATLAS Preliminary = 7 TeV s
Figure 7: Two-dimensional distribution of reconstructed vertex errorsσzPV,fitas obtained from the vertex fit versus the number of tracks Ntrk(left) and versus the value of
q P
trkp2T(right).
3.3 Determination of vertex resolution in data
Figures 6 and 7 show the distributions of fitted errors on the reconstructed x and z vertex position as a function of the number of fitted tracks and total accumulated transverse momentum. As expected, the errors decrease with increasing values of Ntrk and
q P
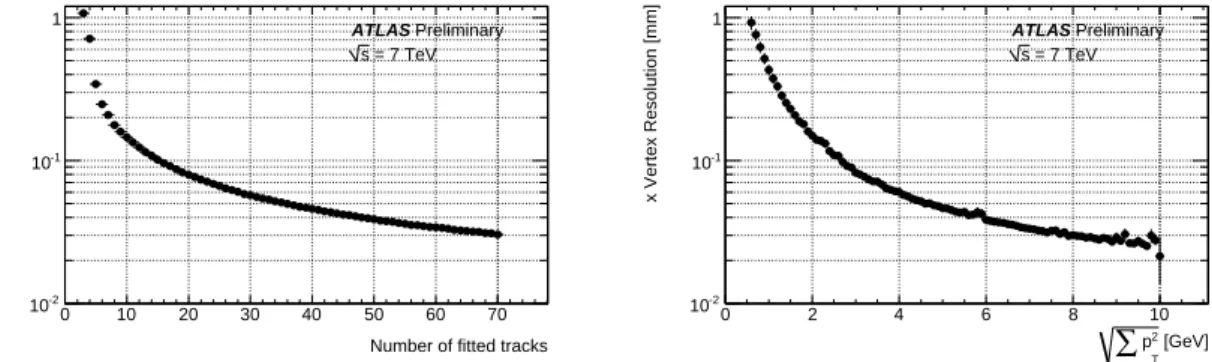
trkp2T. The experimental resolution on the reconstructed vertex position is estimated by scaling the average vertex errors with the scale factors described in Section 3.2. The average value and the correction are calculated in bins of number of fitted tracks and total accumulated transverse momentum. Figures 8 and 9 show the dependence of the vertex position resolutions in x and z on the number of fitted tracks and total accumulated transverse momentum.
The x (z) resolution of the reconstructed primary vertices turns out to be approximately 1−2 mm (about 2 mm) when only two or three tracks are present in the event, since most of these are typically close to the threshold of pT > 150 MeV of a steeply falling distribution, while it approaches 30µm (50µm) for 70 tracks and
q P
trkp2T over 8 GeV. The vertex resolution is expected to improve significantly when moving out from the minimum bias regime to higher track multiplicities and values of
q P
trkp2T.
4 Conclusions
The primary vertex reconstruction algorithm used in ATLAS was briefly described and first performance results in minimum bias events have been presented. The vertex resolution in the transverse and lon-
Number of fitted tracks
0 10 20 30 40 50 60 70
x Vertex Resolution [mm]
10-2
10-1
1 ATLAS Preliminary
= 7 TeV s
[GeV]
2 T
∑ p
0 2 4 6 8 10
x Vertex Resolution [mm]
10-2
10-1
1 ATLAS Preliminary
= 7 TeV s
Figure 8: Estimated vertex resolution σxPV,true in 7 TeV data as a function of the number of tracks Ntrk
(left) or as a function of the value of q
P
trkp2T(right).
Number of fitted tracks
0 10 20 30 40 50 60 70
z Vertex Resolution [mm]
10-2
10-1
1 ATLAS Preliminary
= 7 TeV s
[GeV]
2 T
∑ p
0 2 4 6 8 10
z Vertex Resolution [mm]
10-2
10-1
1 ATLAS Preliminary
= 7 TeV s
Figure 9: Estimated vertex resolutionσzPV,true in 7 TeV data as a function of the number of tracks Ntrk (left) or as a function of the value of
q P
trkp2T(right).
gitudinal directions has been estimated as a function of the number of tracks at the vertex and of the accumulated transverse momentum, using a data-driven method. For events with 70 tracks or
q P
trkp2T over 8 GeV the resolution has been measured to be about 30µm in the transverse plane and about 50µm in the longitudinal direction.
References
[1] The ATLAS Collaboration, The ATLAS Experiment at the CERN Large Hadron Collider, 2008 JINST 3 S08003.
[2] L. Evans, (ed.), P. Bryant, (ed.), LHC Machine, JINST 3 (2008) S08001.
[3] The ATLAS Collaboration, Charged-track multiplicities in pp interactions at √
s=900 GeV, Phys.
Lett. B 688 (2010) 21-42.
[4] The ATLAS Collaboration, Performance of the Minimum Bias Trigger in pp Collisions at √ s=900 GeV, ATL-CONF-2010-025.
[5] T. Cornelissen, M. Elsing, I. Gavrilenko, W. Liebig, A. Salzburger, Single Track Performance of the Inner Detector New Track Reconstruction (NEWT) , ATL-INDET-PUB-2008-002.
[6] T. Sjostrand, S. Mrenna, and P. Skands, PYTHIA 6.4 physics and manual, JHEP 05 (2006) 026.
[7] The ATLAS Collaboration, Characterization of Interaction-Point Beam Parameters Using the pp Event-Vertex Distribution Reconstructed in the ATLAS Detector at the LHC, ATL-CONF-2010-027.
[8] R. Fr¨uhwirth, W. Waltenberger, P. Vanlaer, Adaptive vertex fitting, J. Phys. G34 (2007).