ATLAS-CONF-2010-011 07/07/2010
ATLAS NOTE
ATLAS-CONF-2010-011
March 11, 2010
Tracking Results and Comparison to Monte Carlo simulation at √
s = 900 GeV
The ATLAS Collaboration
Abstract
This document summarises the basic track reconstruction performance using the√ s= 900 GeV data. It focusses on results obtained with the baseline track reconstruction se- quence of the ATLAS Inner Detector. A comparison of track properties such as hits on track and impact parameter distributions between data and simulation is made. The simulation is found to reproduce the track properties in data well.
1 Introduction
This document summarises the track reconstruction performance for√
s=900 GeV data in the ATLAS Inner Detector [1]. It concentrates on the primary track reconstruction sequence: the so-called inside-out tracking sequence of the ATLAS track reconstruction NEWT [2], which tracks particles from silicon space points close to the interaction point out. A detailed comparison of basic track reconstruction quantities between MC simulated events and data is presented. The note discusses the number of hits and holes of the reconstructed tracks. In addition, it studies the track parameterisation with respect to the reconstructed vertex. These studies provide a framework for the comparison of the simulation with the data.
1.1 Run, Event and Track selection
Event Selection All data taken during the stable LHC running periods between December 6 and 15 2009, when the tracking detectors were in full operational mode and the magnetic field of the solenoid was on, were used for this analysis. A total of 455,593 events were collected by requiring a hit on either side of the minimum bias trigger scintillators. To reduce the contribution from beam backgrounds, only events in which a primary vertex was reconstructed from at least three tracks were used. In total, approximately 300k events, which contain almost two million tracks are used. A looser event and track selection that used in [4] is used to study tracking performance. In particular, no requirement is placed on the number of hits in the individual silicon sub-detectors.
Track Reconstruction and Selection The Inner Detector is comprised of three independent subsys- tems: a silicon pixel detector (Pixel), a silicon microstrip detector (SCT) and a gaseous transition radia- tion tracker (TRT). The entire volume is immersed in a 2 T solenoidal field [5] and covers a pseudora- pidity region of up to|η|=2.5, which allows tracks to be reconstructed in a large region of phase space.
The pixel detector contains three barrel and three endcap layers; the SCT has four layers, with each layer containing two strip sensors at a stereo angle, in the barrel and nine disks in the endcaps. There are 73 layers of longitudinal straws in the TRT barrel and 160 planes of radial straws in the TRT endcaps.
Track reconstruction begins with silicon clusters deduced from raw hits. Next, three-dimensional spacepoints are formed from these clusters. Pixel clusters translate directly into spacepoints, however SCT clusters from either side of a module are associated to form a single SCT spacepoint. In track reconstruction, a hit refers to a measurement that has been associated to a track. A hole is an expected measurement given the track trajectory that has not been assigned to the track. Holes can result from material interactions, silicon inefficiency or problems within the pattern recognition. Inactive modules are excluded from the definition of holes.
Several different pattern recognition algorithms are used to find tracks in the Inner Detector.
The tracks typically used in physics analyses are found using the inside-out pattern recognition al- gorithm, which starts with the silicon space points close to the interaction point and extends outwards to the TRT. Track seeds are created from three space points and use defined roads to search for hits to associate to the track. The next step, ambiguity processing, refines the tracks using a more sophisticated track fitter and removes overlapping tracks. Lastly these silicon tracks are used to define roads in which a TRT extension can be attached.
The inside-out sequence is followed by an outside-in (also referred to as back-tracking) sequence that runs on the remaining hits after those hits already used in a track have been removed. The back- tracking algorithm is seeded in the TRT and the track is extrapolated into the silicon. A second inside-out sequence with less stringent pattern recognition requirement is executed after the back-tracking. It aims to recuperate tracks with pT>150 MeVand is therefore referred to as lowpTtracking.
Cut Value Minimum pT 500 MeV
Maximum z 250 mm
Maximumη 2.7
Maximumd0 10 mm NPixelandSCTHits >6
NPixel Hits No Cut
NShared Hits <4 NPixel Holes <3
NSCT Holes <3
NDouble Holes <2
Table 1: The values of the tracking cuts of the inside-out pattern sequence.
The quality requirement for tracks used in the following comparisons are mainly determined by the internal cuts of the inside-out pattern recognition. The cut values used are listed in Tab. 1 and were carefully optimised before data-taking [3].
The cuts place a loose requirement on the track direction such that it approximately originates from the primary vertex. In addition requirements on the number of hits and holes are used to reject fakes.
A shared hit is a hit associated to two tracks. A double hole is a hole found on both sides of an SCT module. Impact parameter cuts with respect to the reconstructed vertex of
• d0<1.5 mm
• z0·sinθ<1.5 mm
were used to select a sample that contains mostly primary particles1. A more thorough study of the tracking detector performance in the Inner Detector including study on fake rates can be found int [1], [3].
2 Comparison of MC Simulation and Data
2.1 Monte Carlo Samples
The study uses a sample of one million non-diffractive Monte Carlo events simulated using PYTHIA [6]
with the MC09 tune [7] and ATLAS full simulation based on GEANT4 [8]. The samples were processed to reproduce detector and beam conditions present during data taking. This included
• reweighting of the events to reproduce the longitudinal beamspot position observed during data taking
• inclusion of inactive silicon modules in the digitisation step, see Fig. 3
The simulation samples were simulated and reconstructed with the same detector description. Effects arising from module misalignment or missing material that could be present in data are not included in the simulation samples. The detector geometry used in this production was produced in February 2010.
1Particles with a lifetime longer than 3×10⁻¹¹s or the decay products of particles with a lifetime shorter than 3×10⁻¹¹s are termed primaries.
2.2 Module and Hit Assignment Efficiencies
The number of assigned hits per track is particularly sensitive to details of how well the simulation de- scribes the data. It convolutes module efficiencies, the description of disabled modules, the position of the beam spot, but also the quality of the alignment and material description. Figure 1 shows the total number of Pixel and SCT hits per track for all inside-out tracks, while Fig. 2 illustrates the complemen- tary distribution, the number of holes per track. The number of holes is an even more sensitive measure of the simulation quality. These are crucial ingredients to the pattern recognition and used to resolve ambiguities and favour high quality tracks over incomplete tracks2. The description of the total number of holes is the same between data and simulation to the 10% level for the SCT and to the 20% level for the pixel detector.
Number of Pixel Hits
0 2 4 6 8 10
Number of Tracks
0 200 400 600 800 1000 1200
103
×
ATLAS Preliminary = 900 GeV s = 900 GeV s
Loose Track Selection Data
Minimum Bias MC
Number of SCT Hits
0 5 10 15 20
Number of Tracks
0 200 400 600 800 1000
103
×
ATLAS Preliminary = 900 GeV s = 900 GeV s
Loose Track Selection Data
Minimum Bias MC
Figure 1: Number of Pixel and SCT hits on track for all inside-out tracks.
Number of Pixel Holes
-0.5 0 0.5 1 1.5 2 2.5 3 3.5
Number of Tracks
103
104
105
106
ATLAS Preliminary = 900 GeV s
Loose Track Selection Data
Minimum Bias MC
Number of SCT Holes
-0.5 0 0.5 1 1.5 2 2.5 3 3.5
Number of Tracks
103
104
105
106
ATLAS Preliminary = 900 GeV s
Loose Track Selection Data
Minimum Bias MC
Figure 2: Number of Pixel and SCT holes on track for all inside-out tracks.
The degree of agreement between data and simulation in the total number of hits per track is excellent.
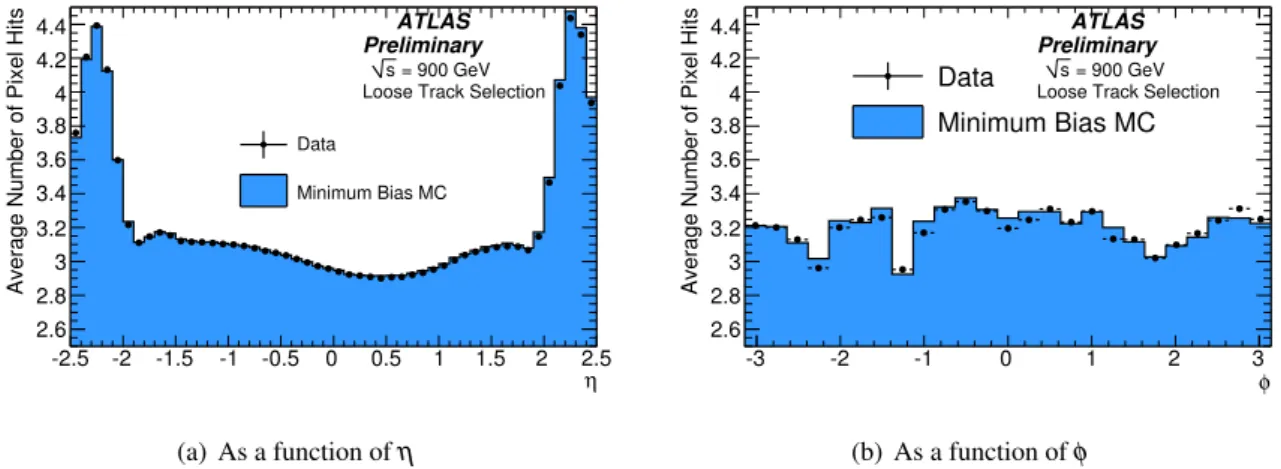
Figure 3 and Fig. 4 shows the number of pixel and SCT hits per track as a function of pseudorapidity, η, and azimuthal angle,φ, at the primary vertex. The structure of the disks in the SCT end cap are reproduced by the simulation. The level of agreement also indicates that inactive modules are accounted
2Inactive modules or channels such as edge areas on the silicon sensors are excluded from the hole definition.
for correctly in the reconstruction of the data and simulation. The remaining discrepancies are thought to be because the transverse position of the beam spot is different in simulation and data.
η -2.5 -2 -1.5 -1 -0.5 0 0.5 1 1.5 2 2.5
Average Number of Pixel Hits
2.6 2.8 3 3.2 3.4 3.6 3.8 4 4.2 4.4
Data
Minimum Bias MC ATLAS Preliminary
= 900 GeV s
Loose Track Selection
(a) As a function ofη
φ
-3 -2 -1 0 1 2 3
Average Number of Pixel Hits
2.6 2.8 3 3.2 3.4 3.6 3.8 4 4.2 4.4
Data
Minimum Bias MC
ATLAS Preliminary
= 900 GeV s
Loose Track Selection
(b) As a function ofφ
Figure 3: Average number of pixel hits per selected track as a function of pseudorapdity and azimuthal angle of the track, respectively. The distributions are shown for both simulation and data. The structure is mainly influenced by the inactive pixel modules that have been also masked in the digitisation process of the simulation samples to reproduce the run conditions.
η -2.5 -2 -1.5 -1 -0.5 0 0.5 1 1.5 2 2.5
Average Number of SCT Hits
6.5 7 7.5 8 8.5 9 9.5 10 10.5
Data
Minimum Bias MC ATLAS Preliminary
= 900 GeV s
Loose Track Selection
(a) As a function ofη
φ
-3 -2 -1 0 1 2 3
Average Number of SCT Hits
8 8.2 8.4 8.6 8.8 9 9.2 9.4
Data
Minimum Bias MC ATLAS Preliminary
= 900 GeV s
Loose Track Selection
(b) As a function ofφ
Figure 4: Average number of SCT hits per selected track as a function of the pseudorapidity and az- imuthal angle of the track, respectively.
2.3 Track Parametrisation with Respect to the Reconstructed Vertex
A reconstructed track can be parameterised with respect to the reconstructed vertex3using the perigee representation (d0,z0,φ0,θ,q/p), whered0andz0denote the transverse and longitudinal impact param- eters, respectively.
3Multiple collisions during one bunch crossing at these low luminosities are extremely unlikely. Furthermore, the vertex reconstruction was configured to only allow for one reconstructed vertex and thus a successfully reconstructed vertex is assumed
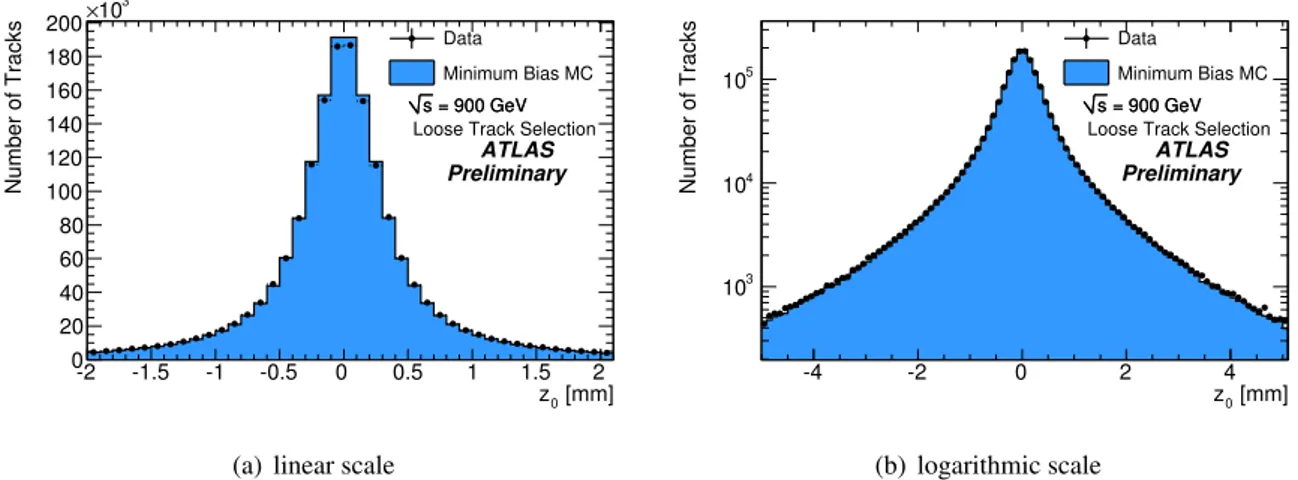
Accurate reconstruction of the impact parameter is essential for vertex reconstruction and heavy flavour tagging. In addition, the transverse impact parameter distribution is often used in track selection because it provides a powerful handle to separate primary from secondary particles such as particles produced through hadronic interaction with the detector material or decay products. Figure 5 shows the d0distribution in linear and logarithmic scale. Here, no requirement on the impact parameters was placed in addition to the requirements within the pattern reconstruction (see Table 1). There is good agreement between simulation and data, in particular in the tail of the distribution. Remaining differences in the core distribution are thought to be due to remaining module misalignment in the data.
[mm]
d0
-1 -0.8 -0.6 -0.4 -0.2 0 0.2 0.4 0.6 0.8 1
Number of Tracks
0 20 40 60 80 100 120 140 160 180 200 220
103
×
ATLAS Preliminary = 900 GeV s = 900 GeV s
Loose Track Selection Data
Minimum Bias MC
(a) linear scale
[mm]
d0
-5 -4 -3 -2 -1 0 1 2 3 4 5
Number of Tracks
102
103
104
105
ATLAS Preliminary = 900 GeV s = 900 GeV s
Loose Track Selection Data
Minimum Bias MC
(b) logarithmic scale
Figure 5: Transverse impact parameter distributionsd0 in Monte Carlo and data. The impact parameter is expressed with respect to the reconstructed vertex.
The longitudinal impact parameterz0is shown in Fig. 6. Similar to the transverse impact parameter, there is excellent agreement between data and simulation in the tails of the distribution, but discrepancies in the core. The longitudinal impact parameter is a less powerful variable to separate tracks from primary and secondary particles, but will become a very important measure to distinguish between tracks from different pile-up vertices during future high luminosity conditions.
[mm]
z0
-2 -1.5 -1 -0.5 0 0.5 1 1.5 2
Number of Tracks
0 20 40 60 80 100 120 140 160 180 200
103
×
ATLAS Preliminary = 900 GeV s = 900 GeV s
Loose Track Selection Data
Minimum Bias MC
(a) linear scale
[mm]
z0
-4 -2 0 2 4
Number of Tracks
103
104
105
ATLAS Preliminary = 900 GeV s = 900 GeV s
Loose Track Selection Data
Minimum Bias MC
(b) logarithmic scale
Figure 6: Longitudinal impact parameter distributionsz0in Monte Carlo and data. The impact parameter is expressed with respect to the reconstructed vertex.
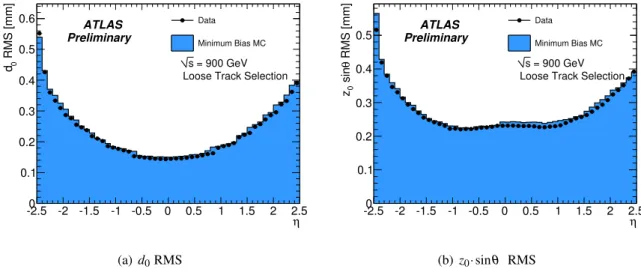
The impact parameter resolution depends on the pseudorapidity of the particle. This is due to the strong η dependence of the amount of material inside the tracking detector and due to the enlarged extrapolation distance from the first measurement to the primary vertex. Figure 7 shows the width of the transverse and longitudinal impact parameter distributions as a function of the pseudorapidity η for data and simulation. The width was calculated from the entries within 3σ of the mean for each impact parameter. Good agreement between data and simulation can again be observed, except for
−2.5<η<−2.4, where the width is larger in simulation than in data. Further discussion can be found in [9].
η -2.5 -2 -1.5 -1 -0.5 0 0.5 1 1.5 2 2.5 RMS [mm]0 d
0 0.1 0.2 0.3 0.4 0.5 0.6
= 900 GeV s
Loose Track Selection Data
Minimum Bias MC
ATLAS Preliminary
(a) d0RMS
η -2.5 -2 -1.5 -1 -0.5 0 0.5 1 1.5 2 2.5 RMS [mm]θ sin0z
0 0.1 0.2 0.3 0.4 0.5
= 900 GeV s
Loose Track Selection Data
Minimum Bias MC
ATLAS Preliminary
(b)z0·sinθ RMS
Figure 7: The RMS of the impact parameter distributions vs.ηin Monte Carlo and data.
3 Conclusion
A comparison of the properties of tracks reconstructed using the inside-out algorithm sequence in data at
√s=900 GeV and Monte Carlo simulation has been presented. The average number of hits and holes on track agree well between data and simulation. In addition, the average number of hits as a function ofη andφ was shown to agree well. The distributions of the impact parameters were found to have a reasonable level of agreement between data and simulation, although discrepancies were observed in the core.
References
[1] The ATLAS Collaboration, G. Aad et al.,The ATLAS Experiment at the CERN Large Hadron Col- lider, JINST 3 (2008) S08003
[2] A. Salzburger (Editor) et al, Concepts, Design and Implementation of the ATLAS New Tracking (NEWT), ATLAS Note, ATL-SOFT-PUB-2007-002, 2007.
[3] T. Cornelissen et al, Single Track Performance of the Inner Detector New Track Reconstruction (NEWT), ATLAS Note, ATL-INDET-PUB-2008-002, 2008.
[4] The ATLAS Collaboration, Charged-particle multiplicities in pp interactions at sqrt(s)=900 GeV
[5] The ATLAS Collaboration, Expected Performance of the ATLAS Experiment, JINST 3 (2008) S08003.
[6] T. Sj¨ostrand, S. Mrenna and P. Skands,PYTHIA 6.4 - Physics and Manual, hep-ph/06013175.
[7] The ATLAS Collaboration,ATLAS Monte Carlo Tunes for MC09, ATL-PHYS-PUB-2010-002 [8] Agostinelli et al.,GEANT4: A Simulation toolkit, Nucl. Inst. & Meth.,A 506, 2003.
[9] The ATLAS Collaboration, Tracking studies for b-tagging with 900 GeV collision data, ATLAS- CONF-2010-003, 2010.