ATLAS-CONF-2018-033 10July2018
ATLAS CONF Note
ATLAS-CONF-2018-033
10th July 2018
Observation of electroweak W ± Z boson pair production in association with two jets in pp collisions at √
s = 13 TeV with the ATLAS detector
The ATLAS Collaboration
An observation of electroweakW±Zproduction in association with two jets in proton–proton collisions is presented. The data collected by the ATLAS detector at the Large Hadron Col- lider in 2015 and 2016 at a centre-of-mass energy of √
s = 13 TeV are used, corresponding to an integrated luminosity of 36.1 fb−1. Events containing three identified leptons, either electrons or muons, and two jets are selected. The electroweak production ofW±Z bosons in association with two jets is measured with an observed significance of 5.6 standard de- viations. A fiducial cross section for electroweak production including interference effects is measured to beσEW(W±Z j j → `0ν``j j) = 0.57 +−0.130.14(stat.) +−0.040.05(syst.) +−0.030.04(th.) fb.
Differential cross sections ofW±Z j j production for several kinematic observables are also measured.
c
2018 CERN for the benefit of the ATLAS Collaboration.
Reproduction of this article or parts of it is allowed as specified in the CC-BY-4.0 license.
1 Introduction
The scattering of vector bosons (VBS), V V → V V with V = W/Z/γ, is a key process to probe the SU(2)L×U(1)Ygauge symmetry of the electroweak (EW) theory that determines the self-couplings of the vector bosons. New phenomena beyond the Standard Model (SM) can alter the couplings of vector bosons, generating additional contributions to quartic gauge couplings (QGC) with respect to the SM predictions [1–3].
In proton-proton collisions VBS is initiated by an interaction of two vector bosons radiated from the initial state quarks, yielding a final state with two bosons and two jets,V V j j, in a purely electroweak process [4].
VBS diagrams are not separately gauge invariant and cannot be studied separately from other processes leading to the sameV V j j final state [5]. Two categories of processes give rise toV V j j final states. The first category, which includes VBS contributions, involves exclusively weak interactions at Born level of orderα6EWwhen considering the boson decays, whereαEWis the electroweak force coupling constant. It is referred to as electroweak production. The second category involves both the strong and electroweak interactions at Born level of order α2sα4EW, where αs is the strong interaction coupling constant. It is referred to as QCD production. According to the SM a small interference occurs between production of electroweak and QCD quark scattering.
Different searches for diboson electroweak production have been performed by the ATLAS and CMS Collaborations at the LHC. So far electroweakV V j j production has only been observed in the same- signW±W±j j channel by the CMS and ATLAS experiments using data collected at a centre-of-mass energy of √
s = 13 TeV [6, 7]. Evidences of electroweakV V j j production have also been obtained in theW±W±j j[8,9] andZγj j[10] channels by the ATLAS and CMS Collaborations, respectively, using smaller data sets recorded at √
s =8 TeV. Limits on electroweak production cross sections of two gauge bosons have been reported for theW±Z j j [11], Z Z j j [12], Zγj j [13] andWγj j [14] channels by the ATLAS and CMS Collaborations.
This note reports on an observation and measurement of electroweakW±Z j j production, exploiting the fully leptonic final states where bothZ andW bosons decay to electrons or muons. Data ofppcollisions collected by the ATLAS detector in 2015 and 2016 at a centre-of-mass energy of √
s = 13 TeV and corresponding to an integrated luminosity of 36.1 fb−1are used.
2 The ATLAS detector
The ATLAS detector [15] is a multi-purpose detector with a cylindrical geometry1and nearly 4πcoverage in solid angle. The collision point is surrounded by inner tracking detectors (collectively referred to as the inner detector), located within a superconducting solenoid providing a 2 T axial magnetic field, followed by a calorimeter system and a muon spectrometer.
The inner detector (ID) provides precise measurements of charged-particle tracks in the pseudorapidity range|η| <2.5. It consists of three subdetectors arranged in a coaxial geometry around the beam axis: a
1ATLAS uses a right-handed coordinate system with its origin at the nominal interaction point (IP) in the centre of the detector and thez-axis along the beam direction. Thex-axis points from the IP to the centre of the LHC ring, and the y-axis points upward. Cylindrical coordinates (r, φ) are used in the transverse (x,y) plane,φbeing the azimuthal angle around the beam direction. The pseudorapidity is defined in terms of the polar angleθasη=−ln[tan(θ/2)].
silicon pixel detector, a silicon microstrip detector and a transition radiation tracker. The newly installed innermost layer of pixels sensors [16,17] was operational for the first time during the 2015 data taking.
The electromagnetic calorimeter covers the region|η| <3.2 and is based on a high-granularity, lead/liquid- argon (LAr) sampling technology. The hadronic calorimeter uses a steel/scintillator-tile detector in the region|η| < 1.7 and a copper/LAr detector in the region 1.5 < |η| < 3.2. The most forward region of the detector, 3.1 < |η| < 4.9, is equipped with a forward calorimeter, measuring electromagnetic and hadronic energies in copper/LAr and tungsten/LAr modules.
The muon spectrometer (MS) comprises separate trigger and high-precision tracking chambers to measure the deflection of muons in a magnetic field generated by three large superconducting toroids arranged with an eightfold azimuthal coil symmetry around the calorimeters. The high-precision chambers cover a range of|η| < 2.7. The muon trigger system covers the range |η| < 2.4 with resistive-plate chambers in the barrel and thin-gap chambers in the endcap regions.
A two-level trigger system is used to select events in real time. It consists of a hardware-based first-level trigger and a software-based high-level trigger. The latter employs algorithms similar to those used offline to identify electrons, muons, photons and jets.
3 Phase space for cross-section measurements
TheW±Z j j electroweak cross section is measured in a fiducial phase space that is defined based on the kinematics of the final-state leptons, electrons or muons, associated with theW± and Z boson decays.
Leptons produced in the decay of a hadron, a tau, or their descendants are not considered in the definition of the fiducial phase space. At particle level, the kinematics of the charged lepton after quantum elec- trodynamics (QED) final-state radiation (FSR) are “dressed” by including contributions from photons with an angular distance∆R ≡ p
(∆η)2+(∆φ)2 < 0.1 from the lepton. Dressed charged leptons, and final-state neutrinos that do not originate from hadron or tau decays, are matched to theW±andZboson decay products using a Monte Carlo (MC) generator-independent algorithmic approach, called the “res- onant shape” algorithm, and based on the value of an estimator expressing the product of the nominal line shapes of theWandZ resonances as detailed in Ref. [11].
The fiducial phase space of the measurement matches the one used in the previous publications [11, 18] and is defined at particle level by the following requirements: the transverse momentum pT of the charged leptons from the Z boson decay is above 15 GeV, the pT of the charged lepton from the W± decay is above 20 GeV, the absolute value of the pseudorapidity of the charged leptons from theW±and Z bosons is below 2.5, the invariant mass of the two leptons from the Z boson decay differs at most by 10 GeV from the world average value of theZ boson massmPDGZ [19]. TheWtransverse mass, defined as mWT = q
2·pνT·p`T·[1−cos∆φ(`, ν)], where∆φ(`, ν) is the angle between the lepton and the neutrino in the transverse plane, is required to be above 30 GeV. The angular distance∆R between each of the charged leptons from theW±andZ decays is required to be larger than 0.3, and the∆Rbetween the two leptons from theZ decay to be larger than 0.2. Requiring that the transverse momentum of the leading lepton be above 27 GeVreduces the acceptance of the fiducial phase space by only 0.02%. This criteria is therefore not added to the definition of the fiducial phase space, while it is present in the selection at the detector level.
In addition to the above requirements defining an inclusive phase space, at least two jets with apTgreater than 40 GeV and an absolute value of the pseudorapidity ηj below 4.5 are required. These particle- level jets are reconstructed from stable particles with a lifetime of τ > 30 ps in the simulation after parton showering, hadronisation, and decay of particles withτ <30 ps. Muons, electrons, neutrinos and photons associated withW and Z decays are excluded. The particle-level jets are reconstructed using the anti-kt [20] algorithm with a radius parameter R= 0.4. The angular distance between all selected leptons and jets,∆R(j,`), is required to be greater than 0.3. If the∆R(j,`) requirement is not satisfied, the jet is discarded. The invariant mass,mj j, of the two highestpT jets laying in opposite hemispheres, ηj1·ηj2 <0, is required to be above 500 GeV to enhance the sensitivity to VBS processes. These two jets are referred to as tagging jets. Finally, processes with ab-quark in the initial state, such ast Z j, are not considered as signal. Thet Z jprocess results from at-channel exchange of aWboson between aband a u-quark giving a final state with at-quark, aZ boson and a light quark jet, but does not exhibit diagrams with gauge boson couplings.
4 Signal and background simulation
Monte Carlo (MC) simulation is used to model signal and background processes. All generated MC events are passed through the ATLAS detector simulation [21], based on GEANT4 [22], and processed us- ing the same reconstruction software used for the data. The event samples include the simulation of addi- tional proton–proton interactions (pile-up) generated with Pythia8.186 [23] using theMSTW2008LO[24]
parton distribution functions (PDF) and the A2 [25] set of tuned parameters.
Scale factors are applied to simulated events to correct for the small differences between data and MC simulation in the trigger, reconstruction, identification, isolation and impact parameter efficiencies of electrons and muons [26,27]. Furthermore, the electron energy and muon momentum in simulated events are smeared to account for small differences in resolution between data and MC [27,28].
The Sherpa2.2.2 MC event generator [29–36] is used to modelW±Zevents with up to one parton at NLO and two to three partons at LO. It includes the modelling of hard scattering, parton shower, hadronisation and underlying event. An MC event sample, referred to asW Z j j-EW, includes diagrams with order 6 (0) inαEW (αs) in the MC matrix element. In that sample, which includes VBS diagrams, two additional jets j originating from electroweak vertices from matrix-element partons are included in the final state.
Diagrams with ab-quark in either initial or final state, i.e. a matrix-elementb-quark, are not considered.
This sample provides a LO prediction for theW Z j j-EW signal process. A second MC event sample, referred to as W Z j j-QCD, includes diagrams with order up to 4 in αEW. This W Z j j-QCD sample includes matrix-elementb-quarks. Both Sherpasamples are generated using theNNPDF3.0[37] PDF set.
Interferences between the two process are estimated at LO using the MadGraph5_aMC@NLO 2.2 [38]
MC event generator with theNNPDF3.0PDF set, including only diagrams with order two in αs at the matrix-element-square level. They are calculated to be positive and of the order of 10% of theW Z j j-EW cross section in the fiducial phase space and are treated as an uncertainty in the measurement, as discussed in Section8.
Theqq¯ → Z Z(∗) processes are generated with Sherpa2.2.2, which includes up to one jet in the matrix element calculation and uses theNNPDF3.0PDF set. The Sherpa2.1.1 MC event generator is used to model thegg→Z Z(∗)andV V Vprocesses at LO using theCT10[39] PDF set. The associated production of top pairs with a weak gauge boson is simulated at LO with MadGraph5_aMC@NLO 2.2 interfaced with Pythia8.186 with theCTEQ6L1[40] PDF set. The total predictions of these MC samples are rescaled
to match NLO predictions from Refs. [41,42]. The associated production of a single top and a Zboson is simulated with MadGraph5_aMC@NLO 2.2 interfaced with Pythia8.186 using theNNPDF3.0PDF set.
5 Event selection
Only data recorded with stable beam conditions and with all relevant detector subsystems operational are considered.
Candidate events are selected using single-leptons triggers [43] that require at least one electron or muon.
The transverse momentum threshold of the leptons in 2015 is 24 GeV for electrons and 20 GeV for muons satisfying a loose isolation requirement based only on ID track information. Due to the higher instantaneous luminosity in 2016 the trigger threshold is increased to 26 GeV for both electrons and muons and tighter isolation requirements are applied. Possible inefficiencies for leptons with large transverse momenta are reduced by including additional electron and muon triggers that do not include any isolation requirements with transverse momentum thresholds ofpT = 60 GeV and 50 GeV, respectively. Finally, a single-electron trigger requiring pT > 120 GeV with less restrictive electron identification criteria is used to increase the selection efficiency for high-pT electrons. The combined efficiency of these triggers is close to 100%.
Events are required to have a primary vertex reconstructed from at least two charged particle tracks and compatible with the luminous region. If several such vertices are present in the event, the one with the highest sum of thep2T of the associated tracks is selected as the primary vertex of theW±Z production.
All final states with three charged leptons (electrons e or muons µ) and neutrinos from W±Z leptonic decays are considered.
Muon candidates are identified by tracks reconstructed in the muon spectrometer and matched to tracks reconstructed in the inner detector. Muons are required to pass a “medium” identification selection, which is based on requirements on the number of hits in the ID and the MS [27]. The efficiency of this selection averaged overpTandηis larger than 98%. The muon momentum is calculated by combining the MS measurement, corrected for the energy deposited in the calorimeters, and the ID measurement. The transverse momentum of the muon must be above 15 GeV and its pseudorapidity must satisfy|η| <2.5.
Electron candidates are reconstructed from energy clusters in the electromagnetic calorimeter matched to inner detector tracks. Electrons are identified using a discriminant that is the value of a likelihood function constructed with information from the shape of the electromagnetic showers in the calorimeter, track properties and track-to-cluster matching quantities of the candidate [26]. Electrons must satisfy a “medium” likelihood requirement, which provides an overall identification efficiency of 90%. The electron momentum is computed from the cluster energy and the direction of the track. ThepT of the electron must be greater than 15 GeV and the pseudorapidity of the cluster must be in the ranges|η| <1.37 or 1.52< |η| <2.47.
Electron and muon candidates are required to originate from the primary vertex. Thus, the significance of the track’s transverse impact parameter calculated with respect to the beam line, |d0/σd0|, must be smaller than three for muons and less than five for electrons, and the longitudinal impact parameter,z0 (the difference between the value ofzof the point on the track at whichd0is defined and the longitudinal position of the primary vertex), is required to satisfy|z0·sin(θ)| <0.5 mm.
Electrons and muons are required to be isolated from other particles using both calorimeter-cluster and ID-track information. The isolation requirement for electrons is tuned for an efficiency of at least 90%
forpT > 25 GeV and at least 99% forpT >60 GeV [26], while fixed thresholds on the isolation variables are used for muons, providing an efficiency above 90% for pT > 15 GeV muons and at least 99% for pT >60 GeV [27].
Jets are reconstructed from clusters of energy deposition in the calorimeter [44] using the anti-kt al- gorithm [20] with a radius parameter R = 0.4. Events with jets arising from detector noise or other non-collision sources are discarded [45]. All jets must have pT > 25 GeV and be reconstructed in the pseudorapidity range|η| < 4.5. A multivariate combination of track-based variables is used to suppress jets originating from pile-up in the ID acceptance [46]. The energy of jets is calibrated and corrected for detector effects using a combination of simulated events andin situ methods in 13 TeV data, similar to the procedure described in Ref. [47]. Jets in the ID acceptance withpT > 25 GeV containing ab-hadron are identified using a multivariate algorithm [48, 49] that uses the impact parameter and reconstructed secondary vertex information of the tracks contained in the jets. Jets initiated byb-quarks are selected by setting the algorithm’s output threshold such that a 77%b-jet selection efficiency is achieved in simulated tt¯events. The flavour tagging efficiencies are corrected based on data-driven calibration analyses.
The transverse momentum of the neutrino is estimated from the missing transverse momentum in the event, ETmiss, calculated as the negative vector sum of the transverse momentum of all identified hard physics objects (electrons, muons, jets), as well as an additional soft term. A track-based measurement of the soft term [50], which accounts for low-pT tracks not assigned to a hard object, is used in the analysis.
To avoid cases where the detector response to a single physical object is reconstructed as two separate final-state objects, several steps are followed to remove such overlaps, following Ref. [51].
Events are required to contain exactly three lepton candidates satisfying the selection criteria described above. To ensure that the trigger efficiency is well determined, at least one of the candidate leptons is required to have pT > 25 GeV and pT > 27 GeV for 2015 and 2016 data, respectively, and to be geometrically matched to a lepton that was selected by the trigger.
To suppress background processes with at least four prompt leptons, events with a fourth lepton candidate satisfying looser selection criteria are rejected. For this looser selection, thepT of the leptons is lowered topT > 5 GeV and “loose” identification requirements are used for both the electrons and muons. A less stringent requirement is applied for electron isolation and is based only on ID track information.
Candidate events are required to have at least one pair of leptons of the same flavour and of opposite charge, with an invariant mass that is consistent with the nominalZ boson mass [19] to within 10 GeV.
This pair is considered to be theZ boson candidate. If more than one pair can be formed, the pair whose invariant mass is closest to the nominalZ boson mass is taken as theZboson candidate.
The remaining third lepton is assigned to theW boson decay. The transverse mass of theW candidate, computed usingETmissand thepT of the associated lepton, is required to be greater than 30 GeV.
Backgrounds originating from misidentified leptons are suppressed by requiring the lepton associated with theW boson to satisfy more stringent selection criteria. Thus, the transverse momentum of these leptons is required to be greater than 20 GeV. Furthermore, leptons associated with theW boson decay are required to pass the “tight” identification requirements, which has an efficiency between 90% and 98% for muons and overall efficiency of 85% for electrons. Finally, these muons must also pass a tighter isolation requirement, tuned for an efficiency of at least 90% (99%) for pT > 25 (60) GeV.
In order to select VBS processes, events are further required to be associated with at least two tagging jets.
The leading tagging jet is selected as the highestpTjet in the event withpT >40 GeV. The second tagging jet is selected as the one of highestpTamong the remaining jets and is required to have a pseudo-rapidity of opposite sign compared to the first tagging jet and apT >40 GeV.
The final VBS signal region (SR) is defined by requiring that the invariant mass of the two tagging jets, mj j be above 500 GeV and that nob-tagged jet be present in the event.
6 Background estimation
The background sources are classified into two groups: events where at least one of the candidate leptons is not a prompt lepton (reducible background) and events where all candidates are prompt leptons or are produced in the decay of a tau (irreducible background). Candidates that are not prompt leptons are also called “misidentified” or “fake” leptons.
The dominant source of background originates from the QCD-induced production ofW±Z dibosons in association with two jets,W Z j j-QCD. The shapes of distributions of kinematic observables of this irre- ducible background are modelled by the SherpaMC simulation. The yield of this background is however constrained by data using a dedicated control region. This region, referred to asW±Z j j QCD-CR, is defined by selecting a sub-sample ofW±Z j jcandidate events withmj j <500 GeV and no reconstructed b-quarks.
The other main sources of irreducible background arise from Z Z,t¯t+V (whereV = Z orW) andt Z j production. These irreducible backgrounds are also modelled using MC simulations. Two additional dedicated control regions, referred to asZ Z-CR andb-CR, respectively, are used to constraint using data the yield of Z Z andt¯t+V background sources. The control region Z Z-CR enriched in Z Z events is defined by applying theW±Z j j event selection defined in Section5, with the exception that instead of vetoing a fourth lepton it is required at least four lepton candidates fulfilling the “loose” identification requirements. The control regionb-CR enriched int¯t+V events is defined by selectingW±Z j j event candidates having at least one reconstructedb-jet. Remaining sources of irreducible background originate fromV V V andt Z jevents. Their amounts are estimated using MC simulations.
The reducible backgrounds originate from Z + j, Zγ,t¯t,W t andW W production processes. The redu- cible backgrounds are estimated using a data-driven method based on the inversion of a global matrix containing the efficiencies and the misidentification probabilities for prompt and fake leptons [11, 52].
The method exploits the classification of the leptons as loose or tight candidates and the probability that a fake lepton is misidentified as a loose or tight lepton. Tight leptons are signal leptons as defined in Sec- tion5. Loose leptons are leptons that do not meet the isolation and identification criteria of signal leptons but satisfy only looser criteria. The misidentification probabilities for fake leptons are determined from data using dedicated control samples enriched in misidentified leptons from light- or heavy-flavour jets and from photon conversions. The lepton misidentification probabilities are applied to data samples of W±Z j j candidate events where at least one and up to three of the leptons are loose. Then, using a matrix inversion, the number of events with at least one misidentified lepton, which represents the amount of reducible background in theW±Z j jsample, is obtained. Another independent method to assess the redu- cible background has been considered. This method estimates the amount of reducible background using MC simulations scaled to data by process-dependent factors determined from the data/MC agreement in dedicated control regions. A good agreement with the matrix method estimation was obtained.
The number of observed events together with the expected background contributions are summarised in Table1 for the signal region and the three control regions. The expected signal purity in the W±Z j j signal region is about 13%, with a contribution of 74% of events arising fromW Z j j-QCD production.
SR QCD-CR b-CR Z Z-CR
Data 161 213 141 52
Total MC 199.2±1.4 289.4±1.9 159.2±1.8 44.7±6.4 W Z j j-EW (signal) 24.93±0.18 8.46±0.10 1.36±0.05 0.21±0.12 W Z j j-QCD 144.17±0.85 231.2±1.1 24.44±0.29 1.43±0.69 Misid. leptons 9.2±1.1 17.7±1.5 29.7±1.6 0.50±0.32 Z Z-QCD 8.10±0.19 14.98±0.34 1.96±0.08 35.0±5.9 t Z 6.46±0.18 6.56±0.19 36.19±0.45 0.18±0.09 tt¯+V 4.21±0.18 9.11±0.23 65.36±0.64 2.8±1.3
Z Z-EW 1.50±0.10 0.44±0.05 0.10±0.08 3.4±1.6 V V V 0.59±0.03 0.93±0.04 0.13±0.01 1.0±1.0
Table 1: Numbers of observed and expected events in theW±Z j jsignal region and in the three control regions, prior to the fit. The expected number ofW Z j j-EW events from Sherpaand the estimated number of background events from the other processes are detailed. The sum of the backgrounds containing misidentified leptons is labelled
“Misid. leptons”. Only statistical uncertainties are quoted.
7 Signal extraction procedure
Given the low purity inW Z j j-EW processes in the signal region, a multivariate discriminant is therefore used to separate the signal and the backgrounds. A boosted decision tree (BDT), as implemented in the TMVA package [53], is used to exploit the kinematic differences between theW Z j j-EW signal and the W Z j j-QCD and other backgrounds. The BDT is trained and optimised on simulated events to separate W Z j j-EW events from all other background processes.
A total of 15 variables are combined into one discriminant, the BDT score output value ranging onto the interval [−1,+1]. The variables can be classified into three categories. The variables related to the kinematic properties of the two tagging jets are the invariant mass of the two tagging jets, mj j, the transverse momenta of the two jets, the difference in pseudorapidity and azimuthal angle of the two jets,
∆ηj j and∆φj j, respectively, the rapidity of the leading jet and the jet multiplicity. Variables related to the kinematic properties of the vector bosons are the transverse momenta of theW and Z bosons, the pseudorapidity of the W boson, the absolute difference between the rapidities of the Z boson and the lepton from the decay of theW boson, |yZ − y`,W|, and the transverse mass of theW±Z system mW ZT . The pseudorapidity of theW boson is reconstructed using an estimation of the longitudinal momentum of the neutrino obtained using theW mass constraint as detailed in Ref. [54]. ThemW ZT observable is reconstructed following Ref. [11]. Variables that relate the kinematic properties of jets and leptons are the distance in the pseudorapidity-azimuth plane between theZ boson and the leading jet,∆R(j1,Z), the event balanceRhardpT , defined as the transverse component of the vector sum of theW Zbosons and tagging jets momenta, normalized to their scalarpTsum, and, finally the centrality of theW Zsystem with respect to the tagging jets, defined as ζlep. = min(∆η−,∆η+), with ∆η− = min(ηW` ,ηZ`
2,ηZ`
1) −min(ηj1,ηj2) and∆η+ = max(ηj1,ηj2) − max(ηW` ,η`Z
2,η`Z
1). A larger set of discriminant observables was studied and only variables improving the area under the signal-versus-background efficiency curve were retained.
The good modelling by MC simulations of the shape and correlations of all input variables to the BDT has been verified in the W±Z j j QCD-CR, as exemplified by the good description of the BDT score distribution of data in the QCD-CR observed in Figure1(a).
The distribution of the BDT score in theW±Z j j signal region is used to extract the significance of the W Z j j-EW signal and to measure its fiducial cross section via a maximum-likelihood fit. An extended likelihood is built from the product of four likelihoods corresponding to the BDT score distribution in the W±Z j jSR, themj jdistribution in theW±Z j jQCD-CR, the multiplicity of reconstructedb-quarks in the b-CR and themj j distribution in theZ Z-CR. The inclusion of the three CR in the fit allows to constrain the yields of theW Z j j-QCD,t¯t+VandZ Zbackgrounds with data. The shapes of these backgrounds are taken from MC predictions and can vary within the uncertainties affecting the measurement as reported in Section8. The normalisations of these backgrounds are introduced in the likelihood as parameters, labelledµW Z−QCD, µtt¯+V and µZ Z forW Z j j-QCD,t¯t+V andZ Zbackgrounds, respectively. They are treated as unconstrained nuisance parameters which are determined mainly by the data in the respective CR. The normalisation and shape of the other irreducible backgrounds are taken from MC simulations and are allowed to vary within their respective uncertainties. The distribution of the reducible background is estimated from data using the matrix method presented in Section6.
The determination of the fiducial cross section is carried out using the signal strength parameterµEW:
µEW= Ndatasignal
NMCsignal = σmeas.fid.,EW
σMCfid.,EW th. , (1)
where Ndatasignal is the signal yield in the data and NMCsignal is the number of signal events predicted by the SherpaMC simulation. The measured cross section σfid.,measEW is derived from the signal strength µEW by multiplying it by the Sherpa MC cross-section prediction σfid.,MC EW th. in the fiducial region. The W Z j j-QCD contribution which is subtracted from data in the fit procedure does not contain interfer- ences between theW Z j j-QCD andW Z j j-EW processes. The measured cross sectionσmeas.fid.,EWtherefore formally corresponds to the cross section of the electroweak production including interference effects.
8 Systematic uncertainties
Systematic uncertainties affecting the shape and normalisation of the BDT score distributions for the in- dividual backgrounds, as well as the acceptance of the signal and the shape of its template are considered.
For uncertainties where variations as a function of the BDT score distribution are consistent with being due to statistical fluctuations, only the normalisation difference is taken into account.
Systematic uncertainties due to the theoretical modelling in the event generator used to evaluate the W Z j j-QCD and W Z j j-EW templates are considered. Renormalisation and factorisation scale uncer- tainties are evaluated by varying both scales independently by factors of two and one-half, removing combinations where both variations differ by a factor of four. They are in the range from−20% to+30%
for theW Z j j-QCD background and±5% for theW Z j j-EW signal. The uncertainties due to the PDF and theαsvalue used in the PDF determination are evaluated using thePDF4LHCprescription [55]. They are of the order of 1% to 2%. Uncertainties in the choice of a parton shower model are estimated for theW Z j j- QCD background by using two MC samples with different parton shower models, Powheg+Pythia8 and Powheg+Herwig. The difference in the predicted shape of the BDT score distribution by the two models
is considered as an uncertainty. The resulting uncertainty ranges from 5% to 15% at low and high values of the BDT score, respectively. A global modelling uncertainty of theW Z j j-EW signal template which includes effects of the parton shower model is estimated by comparing predictions of the BDT score distribution in the signal region from Sherpaand MadGraphMC event generators. It affects the shape of the BDT score distribution by maximally 10% at larger values of the BDT score. TheW Z j j-QCD andW Z j j-EW MC samples being generated separately, the interference between electroweak and QCD induced processes is not included in the probability distribution functions of the fit but is considered as an uncertainty affecting only the shape of theW Z j j-EW MC template. The effect is determined using the MadGraphMC generator, resulting for the signal region in shape-only uncertainties ranging from 10%
to 5% at low and high values of the BDT score, respectively. The effect of interference on the shape of theW Z j j-EW MC template in the QCD-CR is negligible and is therefore not considered.
Systematic uncertainties affecting the reconstruction and energy calibration of jets, electrons and muons are propagated through the analysis. The dominant sources of uncertainties for this measurement are the jet energy scale calibration, including the modelling of pile-up. The uncertainties in the jet energy scale are obtained from √
s = 13 TeV simulations and in situmeasurements, similar to the ones described in Ref. [47]. They are derived by extrapolating measurements in Run-1 data to √
s = 13 TeV. The uncertainty on the jet energy resolution and the one associated with the suppression of jets originating from pile-up are also considered [56]. The uncertainties in the b-tagging efficiency and the mistag rate are taken into account. The effect of jet uncertainties on the number of expected events ranges from 10%
to 3% at low and high values of the BDT score, respectively.
The uncertainty in theETmissmeasurement is estimated by propagating the uncertainties in the transverse momenta of hard physics objects and by applying momentum scale and resolution uncertainties to the track-based soft term [57].
The uncertainties due to lepton reconstruction, identification, isolation requirements and trigger efficien- cies are estimated using tag-and-probe methods inZ →``events. Uncertainties in the lepton momentum scale and resolution are also assessed usingZ → ``events [27,58,59]. These uncertainties impact the number of expected events by around 1.5% for electrons and muons and are independent of the BDT score.
A 40% yield uncertainty is assigned on the reducible background estimate. It takes into account the limited number of events in the control regions as well as the mismatch in the background composition of the control region used to determine the lepton misidentification rate and the control regions used to estimate the yield in the signal region. The uncertainty due to other irreducible background sources is evaluated by propagating the uncertainty in their MC cross sections. These are 20% forV V V [60] and 15% fort Z j[11].
The uncertainty in the combined 2015+2016 integrated luminosity is 2.1%. It is derived, following a methodology similar to that detailed in Ref. [61], from a calibration of the luminosity scale using x-y beam-separation scans performed in August 2015 and May 2016.
The effect of systematic uncertainties on the final results is reported in Table2where the breakdown of the contributions to the uncertainties inµEWis presented. The individual sources of systematic uncertainty are combined into categories. As shown in the table, the systematic uncertainties for the jet reconstruction and calibration play a dominant role, followed by the uncertainties for the modelling of theW Z j j-EW signal and to a lower extent, for theW Z j j-QCD background. Systematic uncertainties regarding the modelling of the other backgrounds are also considered.
Source Uncertainty [%]
W Z j j-EW theory modelling 5.0
W Z j j-QCD theory modelling 2.3
W Z j j-EW andW Z j j-QCD interference 1.9
Jets 6.7
Pileup 2.2
Electrons 1.6
Muons 0.7
b-tagging 0.3
MC statistics 2.1
Misid. lepton background 1.0
Other backgrounds 0.1
Luminosity 2.1
Table 2: Summary of the relative uncertainties in the measured fiducial cross sectionσmeas.fid.,EW. The uncertainties are reported as percentages.
9 Cross-section measurements
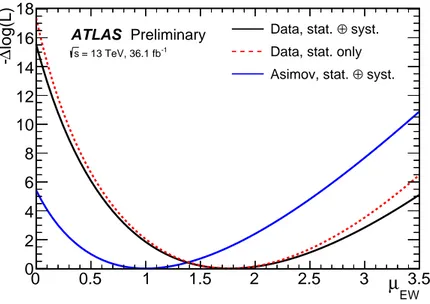
The signal strength µEW and its uncertainty are determined with a profile-likelihood-ratio test statist- ics [62]. Systematic uncertainties in the input templates are treated as nuisance parameters with an as- sumed Gaussian distribution. The BDT score distribution in the QCD control region and in the signal region, with background normalisations, signal normalisation and nuisance parameters adjusted by the profile-likelihood fit are shown in Figure1. The signal strength is measured to be:
µEW=1.77±0.41(stat.)±0.17(syst.)=1.77±0.45 (2) and the background-only hypothesis is excluded in data with a significance of 5.6 standard deviations, for 3.3 standard deviations expected. The normalisation parameters of theW Z j j-QCD,t¯t+V and Z Z backgrounds controlled by data in the dedicated control regions are measured to be µW Z−QCD = 0.60± 0.25, µtt¯+V =1.18±0.19 and µZ Z =1.34±0.29.
The observedW Z j j-EW production integrated fiducial cross section derived from this signal strength is
σfid.,mea s.EW = 0.57+−0.140.15fb
= 0.57+−0.130.14(stat.)+−0.040.05(syst.) +−0.030.04(th.) fb. (3) It corresponds to the cross section of electroweak W±Z j j production, including interference effects betweenW Z j j-QCD and W Z j j-EW processes, in the fiducial phase space defined in Section3 using dressed-level leptons.
The SM LO prediction from Sherpafor electroweak production without interference effects is
σfid.,SherpaEW th. =0.321±0.002 (stat.)±0.005 (PDF)+−0.0230.027(scale) fb. (4) A larger cross section ofσMadGraphfid.,EW th. = 0.366±0.004 (stat.) fb is predicted at LO by MadGraph. These predictions are at LO only and include neither effects of interferences nor effects of NLO electroweak corrections as discussed in Ref. [63] forW±W±j j. Such calculation of higher order electroweak effects does not exist yet for theW±Z j j final state.
− −
Events / 0.2
20 40 60 80 100
120 DataW±Z-EW
Z-QCD W±
ZZ Misid. leptons tt+V tZj and VVV Tot. unc.
ATLASPreliminary
= 13 TeV, 36.1 fb-1
s
BDT Score
−1 −0.5 0 0.5 1
Data / MC 1
2
(a)
− −
Events / 0.2
5 10 15 20 25 30 35 40 45
Data
±Z-EW W
Z-QCD W±
ZZ Misid. leptons tt+V tZj and VVV Tot. unc.
ATLASPreliminary
= 13 TeV, 36.1 fb-1
s
BDT Score
−1 −0.5 0 0.5 1
Data / MC 1
2
(b)
Figure 1: Post-fit BDT score distributions in the QCD control region (a) and in the signal region (b). Signal and backgrounds are normalised to the expected number of events after the fit. The uncertainty band around the MC expectation includes the systematic uncertainties as obtained by the fit.
Events in the SR are also used to differentially measure theW±Z j j production cross section in the VBS fiducial phase space defined in Section3. The differential detector-level distributions are corrected for detector resolution using an iterative Bayesian unfolding method [64], as implemented in the RooUnfold toolkit [65]. Three iterations were consistently used for the unfolding of each variable. The width of the bins in each distribution was chosen according to the experimental resolution and to the statistical significance of the expected number of events in each bin. The fraction of signal MC events reconstructed in the same bin as generated is always greater than 40% and around 70% on average.
SimulatedW±Z j jevents are used to obtain for each distribution a response matrix that accounts for bin- to-bin migration effects between the reconstructed-level and particle-level distributions. The SherpaMC samples forW Z j j-QCD andW Z j j-EW production are used and summed together to model W±Z j j production. In order to provide a modelling closer to data and to minimise unfolding uncertainties, their predicted cross sections are rescaled by the respective signal strengths measured in data from the maximum-likelihood fit.
Uncertainties on the unfolding due to imperfect description of the data by the MC are evaluated using a data-driven method [66], where the MC differential distribution is corrected to match the data distri- bution and the resulting weighted MC distribution at reconstruction level is unfolded with the response
matrix used in the actual data unfolding. The new unfolded distribution is compared to the weighted MC distribution at generator level and the difference is taken as the systematic uncertainty. The uncertainties obtained are ranging from 0.1% to 25% depending on the resolution in the unfolded observables and on the level of its description by the SherpaMC.
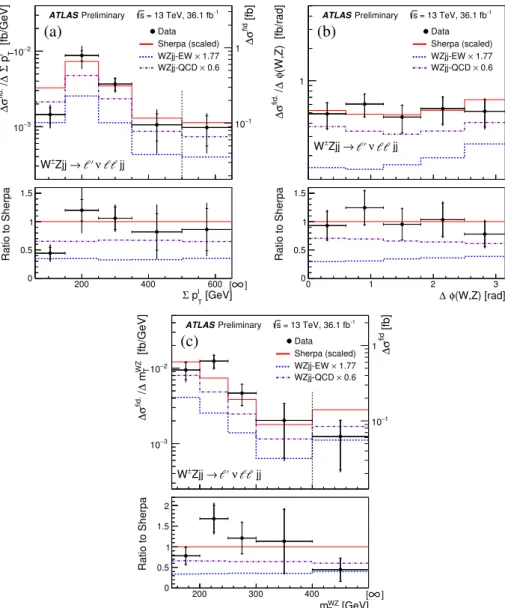
Measurements are performed for two variables sensitive to anomalies in the quartic gauge coupling in W±Z j j events [11], namely the scalar sum of the transverse momenta of the three charged leptons as- sociated to theW andZ bosonsP
p`T, the difference in azimuthal angle∆φ(W,Z) between theW andZ bosons directions and the transverse mass of theW±Z systemmW ZT , defined following Ref. [11]. These are presented in Figure2.
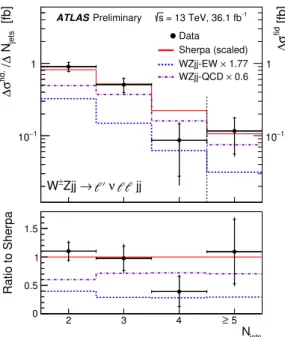
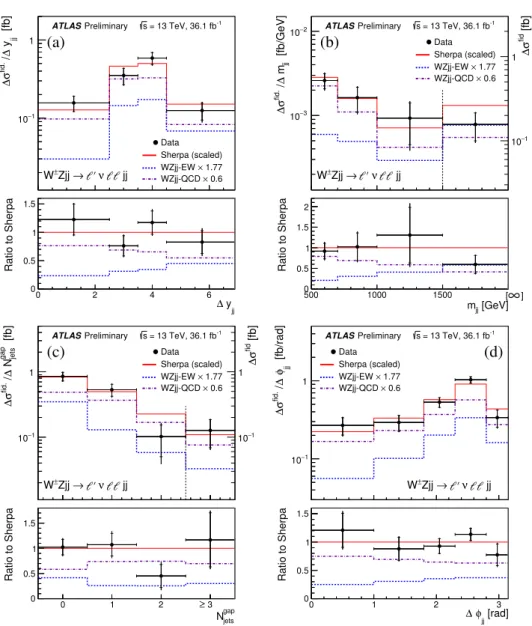
Measurements are also performed as a function of variables related to kinematics of jets. The exclusive multiplicity of jets, Njets, is shown in Figure 3. The absolute difference in rapidity between the two tagging jets∆yj j, the invariant mass of the tagging jetsmj j, the exclusive multiplicity Njetsgap of jets with pT >25 GeV in the gap between the two tagging jets, and the azimuthal difference between the two tagging jets∆φj j are shown in Figure4.
Total uncertainties on the measurements are dominated by statistical uncertainties. The measured distri- bution are compared to the prediction from Sherpa, after having rescaled the separateW Z j j-QCD and W Z j j-EW components by the global µW Z−QCD and µEW parameters, respectively, obtained from the profile-likelihood fit to data. Interference effects between theW Z j j-QCD andW Z j j-EW processes are incorporated via the µEW parameter as only a change of the global normalisation of the Sherpa elec- troweak prediction.
After the rescaling of theW Z j j-QCD andW Z j j-EW components, a good description of the measured cross sections within uncertainties by Sherpais observed.
[fb/GeV]l T pΣ∆ /fid.σ∆
3
10− 2
10−
Data Sherpa (scaled)
1.77 WZjj-EW ×
0.6 WZjj-QCD × ATLASPreliminary s = 13 TeV, 36.1 fb-1
jj ν Zjj →
W± ℓ′ ℓℓ
[fb]fidσ∆
1
10−
1
[GeV]
l
pT
Σ
200 400 600
Ratio to Sherpa
0 0.5 1 1.5
∞
[ ]
(a)
(W,Z) [fb/rad]φ∆ /fid.σ∆ 1
Data Sherpa (scaled)
1.77 WZjj-EW ×
0.6
× WZjj-QCD ATLASPreliminary s = 13 TeV, 36.1 fb-1
jj ν Zjj →
W± ℓ′ ℓℓ
(W,Z) [rad]
φ
∆
0 1 2 3
Ratio to Sherpa
0 0.5 1 1.5
(b)
[fb/GeV]WZ T m∆ /fid.σ∆
3
10− 2
10−
Data Sherpa (scaled)
1.77 WZjj-EW ×
0.6 WZjj-QCD × ATLASPreliminary s = 13 TeV, 36.1 fb-1
jj ν Zjj →
W± ℓ′ ℓℓ
[fb]fidσ∆
1
10−
1
[GeV]
WZ
mT
200 300 400 500
Ratio to Sherpa
0 0.5 1 1.5 2
∞
[ ]
(c)
Figure 2: The measuredW±Z j j differential cross section in the VBS fiducial phase space as a function of PpT` (a),∆φ(W,Z) (b) andmW ZT (c). The inner and outer error bars on the data points represent the statistical and total uncertainties, respectively. The measurements are compared to the sum of the rescaledW Z j j-QCD andW Z j j- EW predictions from Sherpa(red line). TheW Z j j-EW andW Z j j-QCD sub-contributions are also represented by dashed blue and dashed-dotted violet lines, respectively. In (a) and (c), the righty-axis refers to the last cross- section point, separated from the others by a vertical dashed line, as this last bin is integrated up to the maximum value reached in the phase space.
[fb]jets N∆ /fid. σ∆
1
10−
1
Data Sherpa (scaled)
1.77 WZjj-EW ×
0.6 WZjj-QCD × ATLASPreliminary s = 13 TeV, 36.1 fb-1
jj ν Zjj →
W± ℓ′ ℓℓ
[fb]fid σ∆
1
10−
1
Njets
2 3 4 5
Ratio to Sherpa
0 0.5 1 1.5
≥
Figure 3: The measuredW±Z j j differential cross section in the VBS fiducial phase space as a function of the exclusive jet multiplicity of jets withpT >40 GeV. The inner and outer error bars on the data points represent the statistical and total uncertainties, respectively. The measurements are compared to the sum of the scaledW Z j j- QCD andW Z j j-EW predictions from Sherpa(red line). TheW Z j j-EW andW Z j j-QCD sub-contributions are also represented by dashed blue and dashed-dotted violet lines, respectively. The righty-axis refers to the last cross- section point, separated from the others by a vertical dashed line, as this last bin is integrated up to the maximum value reached in the phase space.
[fb] jj y∆ /fid. σ∆
1
10−
1
Data Sherpa (scaled)
1.77 WZjj-EW ×
0.6 WZjj-QCD × ATLASPreliminary s = 13 TeV, 36.1 fb-1
jj ν Zjj →
W± ℓ′ ℓℓ
yjj
∆
0 2 4 6
Ratio to Sherpa
0 0.5 1 1.5
(a)
[fb/GeV]jj m∆ /fid.σ∆ 3−
10
2
10−
Data Sherpa (scaled)
1.77 WZjj-EW ×
0.6 WZjj-QCD × ATLASPreliminary s = 13 TeV, 36.1 fb-1
jj ν Zjj →
W± ℓ′ ℓℓ
[fb]fidσ∆
1
10−
1
[GeV]
mjj
500 1000 1500 2000
Ratio to Sherpa
0 0.5 1 1.5 2
∞
[ ]
(b)
[fb]gap jets N∆ /fid.σ∆
1
10−
1
Data Sherpa (scaled)
1.77 WZjj-EW ×
0.6 WZjj-QCD × ATLASPreliminary s = 13 TeV, 36.1 fb-1
jj ν Zjj →
W± ℓ′ ℓℓ
[fb]fidσ∆
1
10−
1
gap
Njets
0 1 2 3
Ratio to Sherpa
0 0.5 1 1.5
≥
(c) fid. [fb/rad]φ∆ /σ∆ jj
1
10−
1 Data Sherpa (scaled)
1.77 WZjj-EW ×
0.6
× WZjj-QCD
ATLASPreliminary s = 13 TeV, 36.1 fb-1
jj ν Zjj →
W± ℓ′ ℓℓ
[rad]
φjj
∆
0 1 2 3
Ratio to Sherpa
0 0.5 1 1.5
(d)
Figure 4: The measuredW±Z j j differential cross section in the VBS fiducial phase space as a function of the absolute difference in rapidity between the two tagging jets∆yj j (a), as a function of the invariant mass of the tagging jetsmj j(b), as a function of as a function ofNjetsgap the exclusive jet multiplicity of jets withpT >25 GeV in the gap between the two tagging jets (c), and as a function of the azimuthal difference between the two tagging jets∆φj j (d). The inner and outer error bars on the data points represent the statistical and total uncertainties, respectively. The measurements are compared to the sum of the rescaledW Z j j-QCD andW Z j j-EW predictions from Sherpa(red line). TheW Z j j-EW andW Z j j-QCD sub-contributions are also represented by dashed blue and dashed-dotted violet lines, respectively. In (b), the righty-axis refers to the last cross-section point, separated from the others by a vertical dashed line, as this last bin is integrated up to the maximum value reached in the phase space.
10 Conclusion
An observation of electroweak production of a dibosonW±Zsystem in association with two jets,W Z j j- EW and measurements of its production cross section using √
s = 13 TeVppcollisions at the LHC are presented. The data were collected with the ATLAS detector and correspond to an integrated luminosity of 36.1 fb−1. The measurements use leptonic decay modes of the gauge bosons to electrons or muons and are extrapolated in a fiducial phase space approximating the detector acceptance and increasing the sensitivity toW Z j j-EW production modes.
The electroweak production ofW±Z bosons in association with two jets is measured with observed and expected significances of 5.6 and 3.3 standard deviations, respectively. The measured fiducial cross section for electroweak production including interference effects isσEW(W±Z j j → `0ν``j j) = 0.57
+0.14
−0.13(stat.) +−0.040.05(syst.) +−0.030.04(th.) fb. It is found to be larger than the LO SM prediction of 0.32± 0.03 fb as calculated with the SherpaMC event generator which includes neither interference effects nor NLO electroweak corrections. Differential cross section ofW±Z j jproduction, including both strong and electroweak processes, for several kinematic observables are also measured in the same fiducial phase space.
Appendix
A Diagrams for W
±Z j j and t Z j production
Z q
q′′
q′ q′′′
W±
Z q
q′′
q′ q′′′
W±
Z q
q′′
q q′′′
W±
H0
Z q
q′′
q′ q′′′
W±
Figure 5: Diagrams of the vector boson scattering process in hadronic collisions with aW±Z j jfinal state.
b t
u Z/γ∗
d
W W
b
Figure 6: Example diagram oft Z jproduction at LO in QCD.
B Negative log-likelihood ratio profile
0 0.5 1 1.5 2 2.5 3 3.5
µ
EW0 2 4 6 8 10 12 14 16 18
log(L)∆-
syst.
⊕ Data, stat.
Data, stat. only syst.
⊕ Asimov, stat.
ATLAS Preliminary
= 13 TeV, 36.1 fb-1
s
Figure 7: The profile of the negative log-likelihood ratioL(µEW) of the signal strengthµEW. The observed result is represented by the solid-black curve, while the dashed-red curve shows the result with only the statistical uncertainty included. The solid-blue curve represents the expected profile obtained from Asimov data.
References
[1] O. J. P. Eboli, M. C. Gonzalez-Garcia and S. M. Lietti,Bosonic quartic couplings at CERN LHC, Phys. Rev. D69(2004) 095005, arXiv:hep-ph/0310141 [hep-ph].
[2] O. Eboli, M. Gonzalez-Garcia and J. Mizukoshi,pp→ j je±µ±ννand j je±µ±ννat O(α(em)6) and O(α(em)4α(s)2)for the study of the quartic electroweak gauge boson vertex at CERN LHC, Phys. Rev. D74(2006) 073005, arXiv:hep-ph/0606118 [hep-ph].
[3] C. Degrande et al.,Effective Field Theory: A Modern Approach to Anomalous Couplings, Annals Phys.335(2013) 21, arXiv:1205.4231 [hep-ph].
[4] R. N. Cahn, S. D. Ellis, R. Kleiss and W. J. Stirling,
Transverse Momentum Signatures for Heavy Higgs Bosons,Phys. Rev. D35(1987) 1626.
[5] E. Accomando, A. Ballestrero, A. Belhouari and E. Maina,
Isolating Vector Boson Scattering at the LHC: Gauge cancellations and the Equivalent Vector Boson Approximation vs complete calculations,Phys. Rev. D74(2006) 073010,
arXiv:hep-ph/0608019 [hep-ph].
[6] CMS Collaboration,Observation of electroweak production of same-sign W boson pairs in the two jet and two same-sign lepton final state in proton-proton collisions at √
s=13 TeV, Phys. Rev. Lett.120(2018) 081801, arXiv:1709.05822 [hep-ex].
[7] Observation of electroweak production of a same-sign W boson pair in association with two jets in pp collisions at √
s =13TeV with the ATLAS detector, tech. rep. ATLAS-CONF-2018-030, CERN, 2018,url:https://cds.cern.ch/record/2629411.
[8] ATLAS Collaboration,Evidence for Electroweak Production of W±W±j j in pp Collisions at
√s =8TeV with the ATLAS Detector,Phys. Rev. Lett.113(2014) 141803, arXiv:1405.6241 [hep-ex].
[9] ATLAS Collaboration,Measurements of electroweak W j j production and constraints on anomalous gauge couplings with the ATLAS detector,Eur. Phys. J. C77(2017) 474, arXiv:1703.04362 [hep-ex].
[10] CMS Collaboration,
Measurement of the cross section for electroweak production of Zγin association with two jets and constraints on anomalous quartic gauge couplings in proton-proton collisions at √
s =8TeV, Phys. Lett. B770(2017) 380, arXiv:1702.03025 [hep-ex].
[11] ATLAS Collaboration,Measurements of W±Z production cross sections in pp collisions at
√s =8TeV with the ATLAS detector and limits on anomalous gauge boson self-couplings, Phys. Rev. D93(2016) 092004, arXiv:1603.02151 [hep-ex].
[12] CMS Collaboration,
Measurement of vector boson scattering and constraints on anomalous quartic couplings from events with four leptons and two jets in proton–proton collisions at √
s=13TeV, Phys. Lett. B774(2017) 682, arXiv:1708.02812 [hep-ex].
[13] ATLAS Collaboration,Studies of Zγ production in association with a high-mass dijet system in pp collisions at √
s=8TeV with the ATLAS detector, (2017), arXiv:1705.01966 [hep-ex].
[14] CMS Collaboration,Measurement of electroweak-induced production of Wγwith two jets in pp collisions at √
s=8TeV and constraints on anomalous quartic gauge couplings, JHEP1706(2017) 106, arXiv:1612.09256 [hep-ex].
[15] ATLAS Collaboration,The ATLAS Experiment at the CERN Large Hadron Collider, JINST3(2008) S08003.
[16] ATLAS Collaboration,ATLAS Insertable B-Layer Technical Design Report, CERN-LHCC-2010-013. ATLAS-TDR-19, CERN, 2010,
url:http://cds.cern.ch/record/1291633.
[17] ATLAS Collaboration,ATLAS Insertable B-Layer Technical Design Report Addendum, CERN-LHCC-2012-009. ATLAS-TDR-19-ADD-1,
Addendum to CERN-LHCC-2010-013, ATLAS-TDR-019: CERN, 2012, url:http://cds.cern.ch/record/1451888.
[18] ATLAS Collaboration,Measurement of the W±Z boson pair-production cross section in pp collisions at √
s=13TeV with the ATLAS Detector,Phys. Lett. B762(2016) 1, arXiv:1606.04017 [hep-ex].
[19] K. A. Olive et al.,Review of Particle Physics,Chin. Phys. C38(2014) 090001.
[20] M. Cacciari, G. P. Salam and G. Soyez,The Anti-k(t) jet clustering algorithm, JHEP0804(2008) 063, arXiv:0802.1189 [hep-ph].
[21] ATLAS Collaboration,The ATLAS Simulation Infrastructure,Eur. Phys. J. C70(2010) 823, arXiv:1005.4568 [physics.ins-det].
[22] S. Agostinelli et al.,GEANT4: A simulation toolkit,Nucl. Instrum. Meth. A506(2003) 250.
[23] T. Sjöstrand, S. Mrenna and P. Z. Skands,A Brief Introduction to PYTHIA 8.1, Comput. Phys. Commun.178(2008) 852, arXiv:0710.3820 [hep-ph].
[24] A. D. Martin, W. J. Stirling, R. S. Thorne and G. Watt,Parton distributions for the LHC, Eur. Phys. J. C63(2009) 189, arXiv:0901.0002 [hep-ph].
[25] ATLAS Collaboration,Summary of ATLAS Pythia 8 tunes, ATL-PHYS-PUB-2012-003, CERN, 2012,url:http://cds.cern.ch/record/1474107.
[26] ATLAS Collaboration,Electron efficiency measurements with the ATLAS detector using the 2015 LHC proton-proton collision data, tech. rep. ATLAS-CONF-2016-024, CERN, 2016,
url:http://cds.cern.ch/record/2157687.
[27] ATLAS Collaboration,Muon reconstruction performance of the ATLAS detector in proton-proton collision data at √
s=13 TeV,Eur. Phys. J. C76(2016) 292, arXiv:1603.05598 [hep-ex].
[28] ATLAS Collaboration,Electron and photon energy calibration with the ATLAS detector using data collected in 2015 at √
s=13 TeV, tech. rep. ATL-PHYS-PUB-2016-015, CERN, 2016, url:https://cds.cern.ch/record/2203514.
[29] T. Gleisberg et al.,Event generation with SHERPA 1.1,JHEP0902(2009) 007, arXiv:0811.4622 [hep-ph].
[30] T. Gleisberg and S. Höche,Comix, a new matrix element generator,JHEP0812(2008) 039, arXiv:0808.3674 [hep-ph].
[31] S. Schumann and F. Krauss,
A Parton shower algorithm based on Catani-Seymour dipole factorisation, JHEP0803(2008) 038, arXiv:0709.1027 [hep-ph].
[32] S. Catani, F. Krauss, R. Kuhn and B. R. Webber,QCD matrix elements+parton showers, JHEP11(2001) 063, arXiv:hep-ph/0109231 [hep-ph].
[33] S. Höche, F. Krauss, S. Schumann and F. Siegert,QCD matrix elements and truncated showers, JHEP0905(2009) 053, arXiv:0903.1219 [hep-ph].
[34] S. Hoeche, F. Krauss, M. Schonherr and F. Siegert,
QCD matrix elements+parton showers: The NLO case,JHEP04(2013) 027, arXiv:1207.5030 [hep-ph].
[35] J.-C. Winter, F. Krauss and G. Soff,A Modified cluster hadronization model, Eur. Phys. J. C36(2004) 381, arXiv:hep-ph/0311085 [hep-ph].
[36] M. Schönherr and F. Krauss,Soft Photon Radiation in Particle Decays in SHERPA, JHEP0812(2008) 018, arXiv:0810.5071 [hep-ph].
[37] R. D. Ball et al.,Parton distributions for the LHC Run II,JHEP1504(2015) 040, arXiv:1410.8849 [hep-ph].
[38] J. Alwall et al.,The automated computation of tree-level and next-to-leading order differential cross sections, and their matching to parton shower simulations,JHEP1407(2014) 079, arXiv:1405.0301 [hep-ph].
[39] H.-L. Lai et al.,New parton distributions for collider physics,Phys. Rev. D82(2010) 074024, arXiv:1007.2241 [hep-ph].