DOI 10.1140/epjc/s10052-010-1512-2
Regular Article - Experimental Physics
Measurement of inclusive jet and dijet cross sections
in proton-proton collisions at 7 TeV centre-of-mass energy with the ATLAS detector
The ATLAS Collaboration
CERN, 1211 Geneva 23, SwitzerlandReceived: 29 September 2010 / Revised: 29 October 2010
© CERN for the benefit of the ATLAS collaboration 2011. This article is published with open access at Springerlink.com
Abstract Jet cross sections have been measured for the first time in proton-proton collisions at a centre-of-mass energy of 7 TeV using the ATLAS detector. The measurement uses an integrated luminosity of 17 nb
−1recorded at the Large Hadron Collider. The anti-k
talgorithm is used to identify jets, with two jet resolution parameters, R = 0.4 and 0.6.
The dominant uncertainty comes from the jet energy scale, which is determined to within 7% for central jets above 60 GeV transverse momentum. Inclusive single-jet differ- ential cross sections are presented as functions of jet trans- verse momentum and rapidity. Dijet cross sections are pre- sented as functions of dijet mass and the angular variable χ . The results are compared to expectations based on next-to- leading-order QCD, which agree with the data, providing a validation of the theory in a new kinematic regime.
1 Introduction
At the Large Hadron Collider (LHC), jet production is the dominant high transverse-momentum (p
T) process and as such gives the first glimpse of physics at the TeV scale.
Jet cross sections and properties are key observables in high-energy particle physics. They have been measured at e
+e
−, ep, p p, and ¯ pp colliders, as well as in γp and γ γ collisions. They have provided precise measurements of the strong coupling constant, have been used to obtain informa- tion about the structure of the proton and photon, and have become important tools for understanding the strong inter- action and searching for physics beyond the Standard Model (see, for example, [1–19]). Searches for new physics using jets in 7 TeV collisions were recently published [20, 21]. In this paper, we present the first measurements of inclusive single-jet and dijet cross sections using the ATLAS detec- tor. The measurements are performed using a data set taken
e-mail:atlas.secretariat@cern.ch
early in LHC running, from 30 March to 5 June 2010, corre- sponding to an integrated luminosity of 17 nb
−1. The mea- surement involves a determination of the trigger and recon- struction efficiencies of ATLAS for jets, as well as a first determination of the calorimeter response to jet energy.
The paper is organised as follows. The detector is de- scribed in the next section, followed by the definition of the cross sections to be measured (Sect. 3), a discussion of the simulations used in the measurement (Sect. 4) and the theo- retical predictions to which the data are compared (Sect. 5).
The evaluation of the trigger efficiency is given in Sect. 6.
The following two sections (Sects. 7 and 8) describe the evaluation of the main uncertainty in the measurement, com- ing from the jet energy scale. The event selection and data correction are then described (Sects. 9 and 10), followed by the results and conclusions.
2 The ATLAS detector
The ATLAS detector covers almost the entire solid angle around the collision point with layers of tracking detectors, calorimeters, and muon chambers. For the measurements presented in this paper, the inner detector, the calorimeters, and the trigger are of particular importance. These compo- nents, and the rest of the detector, are described in detail elsewhere [22].
The inner detector has full coverage in φ and covers the pseudorapidity
1range | η | < 2.5. It consists of a silicon pixel
1Pseudorapidity is defined asη= −ln(tan(θ/2)). The ATLAS refer- ence system is a Cartesian right-handed coordinate system, with the nominal collision point at the origin. The anti-clockwise beam direc- tion defines the positivez-axis, while the positivex-axis is defined as pointing from the collision point to the centre of the LHC ring and the positivey-axis points upwards. The azimuthal angleφis measured around the beam axis, and the polar angleθis measured with respect to thez-axis.
detector, a silicon microstrip detector, and a transition radi- ation tracker, all immersed in a 2 T magnetic field. These tracking detectors are used to reconstruct tracks and vertices, including the primary vertex.
High granularity liquid-argon (LAr) electromagnetic sampling calorimeters, with excellent energy and posi- tion resolution, cover the pseudorapidity range | η | < 3.2 (the barrel covers | η | < 1.475 and the two end-caps cover 1.375 < | η | < 3.2). The hadronic calorimetry in the range
| η | < 1.7 is provided by a scintillating-tile calorimeter, which is separated into a large barrel (|η| < 1.0) and two smaller extended barrel cylinders, one on either side of the central barrel (0.8 < | η | < 1.7). In the end-caps (| η | > 1.5), LAr hadronic calorimeters match the outer
| η | limits of the end-cap electromagnetic calorimeters. The LAr forward calorimeters provide both electromagnetic and hadronic energy measurements, and extend the coverage to
| η | < 4.9.
The trigger system uses three consecutive trigger levels to select signal and reject background events. The Level-1 (L1) trigger is based on custom-built hardware to process the incoming data with a fixed latency of 2.5 µs. This is the only trigger level used in this analysis. In order to commission the trigger software, the higher level triggers also recorded decisions on events, but these decisions were not applied to reject any data. The events in this analysis were accepted either by the system of minimum-bias trigger scintillators (MBTS) or by the calorimeter trigger.
The MBTS detector [23] consists of 32 scintillator coun- ters that are each 2 cm thick, which are organised into two disks with one on each side of the ATLAS detector. The scintillators are installed on the inner face of the end-cap calorimeter cryostats at z = ±356 cm such that the disk sur- face is perpendicular to the beam direction. This leads to a coverage of 2.09 < | η | < 3.84. The MBTS multiplicity is calculated for each side independently, and allows events containing jets to be triggered with high efficiency and neg- ligible bias.
The L1 calorimeter trigger uses coarse detector infor- mation to identify the position of interesting physics ob- jects above a given energy threshold. The ATLAS jet trig- ger is based on the selection of jets according to their trans- verse energy, E
T. The L1 jet reconstruction uses so-called jet elements, which are formed from the electromagnetic and hadronic calorimeters with a granularity of φ × η = 0.2 × 0.2 for | η | < 3.2. The jet finding is based on a sliding window algorithm with steps of one jet element, and the jet E
Tis computed in a window of configurable size around the jet.
Recorded events are fully reconstructed offline, using object-oriented analysis software running on a distributed computing grid.
3 Cross section definition
Jets are identified using the anti-k
tjet algorithm [24] im- plemented in the F
ASTJ
ET[25, 26] package. This algorithm constructs, for each input object (e.g. a parton, particle or energy cluster) i, the quantities d
ijand d
iBas follows:
d
ij= min
k
t i−2, k
tj−2(R)
2ijR
2, (1)
d
iB= k
−t i2, (2)
where
(R)
2ij= (y
i− y
j)
2+ (φ
i− φ
j)
2, (3) k
t iis the transverse momentum of object i with respect to the beam direction, φ
iis its azimuthal angle, and y
iis its ra- pidity, defined as y =
12ln[(E +p
z)/(E −p
z)], where E de- notes the energy and p
zis the component of the momentum along the z-axis. A list containing all the d
ijand d
iBvalues is compiled. If the smallest entry is a d
ij, objects i and j are combined (their four-vectors are added) and the list is up- dated. If the smallest entry is a d
iB, this object is considered a complete “jet” and is removed from the list. As defined above, d
ijis a distance measure between two objects, and d
iBis a similar distance between the object and the beam.
Thus the variable R is a resolution parameter which sets the relative distance at which jets are resolved from each other as compared to the beam. In this analysis, two different val- ues for the R parameter are chosen: R = 0.4 and R = 0.6;
using two values allows comparison to QCD calculations subject to rather different soft (non-perturbative) QCD cor- rections. The anti-k
talgorithm is well-motivated since it can be implemented in next-to-leading-order (NLO) perturba- tive QCD (pQCD) calculations, is infrared-safe to all orders, and produces geometrically well-defined (“cone-like”) jets.
The jet cross section measurements are corrected for all experimental effects, and so refer to the ideal “truth” final- state of a proton-proton collision (see, for example [27]), where jets are built from stable particles, i.e. those with a proper lifetime longer than 10 ps. This definition includes muons and neutrinos from decaying hadrons.
Inclusive single-jet double-differential cross sections are measured as a function of jet p
Tand y for all jets in the kinematic region p
T> 60 GeV, | y | < 2.8. This ensures that jets lie well within the high efficiency plateau region for the triggers used, as described in Sect. 6, and that the jets are in a region where the jet energy scale is well understood, as described in Sect. 7.
The dijet double-differential cross section is measured as
a function of the invariant mass of the dijet system, m
12,
binned in the maximum rapidity of the two leading (i.e.
highest p
T) jets, | y |
max= max( | y
1| , | y
2| ). It is also mea- sured as a function of the angular variable
χ = exp
| y
1− y
2|
≈ 1 + cos θ
∗1 − cos θ
∗(4)
binned in the dijet mass m
12. Here the subscripts 1, 2 la- bel the highest and second highest p
Tjet in the event within
| y | < 2.8, respectively, and θ
∗is the polar scattering angle of the outgoing jets in the dijet centre-of-mass frame. The approximation in the expression is exact for massless jets perfectly balanced in p
T. The leading jet is required to lie in the p
T, | y | kinematic region defined above. The sublead- ing jet is required to lie in the same rapidity region and to have p
T> 30 GeV, which ensures that both the jet recon- struction efficiency and purity
2are above 99% in all bins.
This cut is also important to limit misidentification of the subleading jet due to less precise jet energy resolution for p
T< 30 GeV (see Sect. 10). Allowing for some imbalance in the p
Tof the two jets improves the stability of the NLO calculation [28].
The dijet mass is plotted in the allowed rapidity region only above the minimum mass where it is no longer biased by the p
Tand rapidity cuts on the two leading jets. The min- imum unbiased mass depends on the | y |
maxbin, which de- termines the maximum opening angle in rapidity allowed.
The biased spectrum below this mass is not measured due to its particular sensitivity to the jet energy scale uncertainty through the jet p
Tcut.
The variable χ is plotted up to a maximum of 30, restrict- ing the angular separation in rapidity to | y
1− y
2| < ln(30).
In the rotated coordinate system (y
∗, y
boost), where y
∗= 0.5 · (y
1− y
2), and y
boost= 0.5 · (y
1+ y
2) is the boost of the dijet system with respect to the laboratory frame, this re- stricts the acceptance to | y
∗| < 0.5 ln(30). An orthogonal ac- ceptance cut | y
boost| < 1.1 is then made on the χ distribution in order to reject events in which both jets are boosted into the forward or backward direction. This reduces the sensitiv- ity to parton density function (PDF) uncertainties at low x , where x is the fraction of the momentum of the proton car- ried by the parton participating in the hard scattering, and in turn enhances sensitivity to differences that could arise from deviations from the matrix element predictions of pQCD.
The χ spectrum is plotted only in mass bins above the min- imum unbiased mass.
The kinematic constraints mean that the region of x probed by these measurements varies in the approximate range 5 × 10
−4< x < 0.4 for the inclusive jet measure- ments, and 1.4 ×10
−2< x < 0.3 for the dijet measurements.
2The efficiency and purity were determined using Monte Carlo with a requirement that truth and reconstructed jets match to within R=0.3.
4 Monte Carlo samples
Samples of simulated jet events in proton-proton collisions at √
s = 7 TeV were produced using several Monte Carlo (MC) generators. The P
YTHIA6.421 [29] event genera- tor is used for the baseline comparisons and corrections. It implements leading-order (LO) pQCD matrix elements for 2 → 2 processes, p
T-ordered parton showers calculated in a leading-logarithmic approximation, an underlying event
3simulation using multiple-parton interactions, and uses the Lund string model for hadronisation. For studies of sys- tematic uncertainties, jet samples were produced using the H
ERWIG6 [30] generator, which also employs LO pQCD matrix elements, but uses an angle-ordered parton shower model and a cluster hadronisation model. The underlying event for the H
ERWIG6 samples is generated using the J
IMMY[31] package using multiple-parton interactions. The H
ERWIG++ [32], A
LPGEN[33], and S
HERPA[34] pro- grammes were also used for various cross-checks. The sam- ples are QCD 2 → 2 scattering samples created using the MRST2007LO
∗[35, 36] modified leading-order PDFs. The H
ERWIG6 and P
YTHIA6 samples use tuned sets of param- eters denoted as MC09 [37], unless stated otherwise.
The generated samples are passed through a full sim- ulation [38] of the ATLAS detector and trigger based on G
EANT4 [39]. The Quark Gluon String model [40] was used for the fragmentation of the nucleus, and the Bertini cas- cade model [41] for the description of the interactions of the hadrons in the medium of the nucleus. The parameters used in G
EANT4 are described in more detail elsewhere [42].
Test-beam measurements for single pions have shown that these simulation settings best describe the response and res- olution in the barrel [43, 44] and end-cap [45, 46] calorime- ters.
Finally, the events are reconstructed and selected using the same analysis chain as for the data with the same trigger, event selection, and jet selection criteria.
5 Theoretical predictions
Several NLO pQCD calculations are available for jet pro- duction in proton-proton collisions. NLOJET++ 4.1.2 [47]
was used to calculate the QCD 2 → 2 scattering process at NLO for comparison with data. JETRAD [48] was used for cross-checks. The CTEQ 6.6 [49] NLO parton densities were used for the central value and uncertainties, and the MSTW 2008 [35], NNPDF 2.0 [50] and HERAPDF 1.0 [51]
parton density sets were used as cross-checks. The default
3The term underlying event is used to mean particles produced in the same proton-proton collision, but not originating from the primary hard partonic scatter or its products.
renormalisation and factorisation scales (μ
Rand μ
Frespec- tively) were defined to be equal to the p
Tof the leading jet in the event. To estimate the potential impact of higher order terms not included in the calculation, μ
Rwas varied from half to twice the default scale. To estimate the impact of the choice of the scale at which the PDF evolution is separated from the matrix element, μ
Fwas similarly varied. These two scales were varied independently apart from a constraint that the ratio of the two scales be between 1/2 and 2, applied to avoid introducing large logarithms of the ratio of the scales.
In addition, the effect of the uncertainty in the strong cou- pling constant, α
s(M
Z), was estimated by calculating the cross section using α
s(M
Z) values within the uncertainty range, and using PDFs fitted using these values. To effi- ciently calculate all these uncertainties, the A
PPLGRID[52]
program was used.
The NLO calculations predict partonic cross sections, which are unmeasurable. For comparison with data at the particle level, soft (non-perturbative) corrections must be applied. This was done using leading-logarithmic parton shower Monte Carlo programs, by evaluating the ratio of the cross section before and after hadronisation and underlying event simulation and dividing the NLO theory distributions by this factor. The P
YTHIA6 and H
ERWIG6 models de- scribed above were used, as well as a variety of alternative tunes of P
YTHIA6 [53, 54] as a cross-check. The central value used is that from the P
YTHIA6 MC09 sample, and the uncertainty is estimated as the maximum spread of the other models investigated. To calculate the particle and parton- level theory distributions, the R
IVET[55] package was used.
The soft QCD corrections depend significantly on the value of R (0.4 or 0.6), since wider jets are affected more by the underlying event, whereas narrower jets are more likely to lose particles due to hadronisation. The size of these effects, and their dependence on jet size, increases with decreas- ing p
T. The corrections are within 5% of unity over most of the kinematic region, but for p
T= 30 GeV they drop to
− 10% for jets with R = 0.4, and rise to about 15% for the lowest p
Tjets with R = 0.6.
6 Trigger efficiency
The MBTS_1 trigger, which requires one MBTS counter over threshold, was operational in the early data-taking pe- riod. It was used to trigger approximately 2% of the in- tegrated luminosity of the data sample analysed. It has negligible inefficiency (as measured in randomly triggered events [23]) for the events considered in this analysis, which all contain several charged tracks. As the instantaneous lu- minosity increased, this trigger had a large prescale factor applied. Consequently subsequent events—comprising ap- proximately 98% of the data sample studied—were trig- gered by the jet trigger.
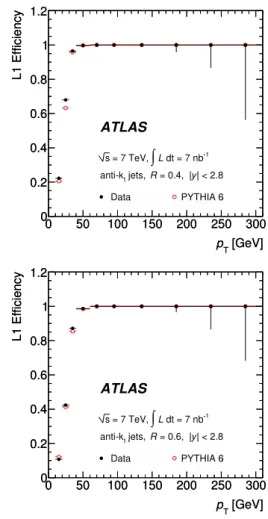
Fig. 1 Inclusive-jet L1 trigger efficiency as a function of reconstructed jet pT for jets identified using the anti-kt algorithm with (upper) R=0.4 and (lower)R=0.6
The lowest threshold L1 jet trigger, which is used in this analysis, employs a 0.4 × 0.4 window size in η − φ and re- quires a jet with p
T> 5 GeV at the electromagnetic scale (see Sect. 7). The inclusive jet trigger efficiency was mea- sured with respect to the MBTS_1 trigger, which provides an unbiased reference as described above. Its efficiency is shown as a function of the final reconstructed p
Tfor single jets (R = 0.4 and 0.6) in Fig. 1. The efficiency is compared to that predicted from MC simulation, demonstrating that the modelling of the trigger efficiency curve is good. The trigger efficiency for jets with p
T> 60 GeV and | y | < 2.8 is above 99%. All events considered here contain at least one jet in this region.
7 Jet energy scale calibration
The input objects to the jet algorithm in the data and in
the detector-level simulation are topological energy clus-
ters in the calorimeter. These clusters are seeded by calor-
imeter cells with energy | E
cell| > 4σ above the noise, where
σ is the RMS of the noise. All directly neighbouring cells are added, then neighbours of neighbours are iteratively added for all cells with signals above a secondary thresh- old | E
cell| > 2σ . Finally the energy in all further immediate neighbours is added. Clusters are split or merged based on the position of local minima and maxima. The cell energies are summed to give the cluster energy, and the clusters are treated as massless. The baseline calibration for these clus- ters corrects their energy to the electromagnetic (EM) scale.
The EM scale is established using test-beam measurements for electrons and muons in the electromagnetic and hadronic calorimeters [56, 57]. It provides a good estimate of the en- ergy deposited in the calorimeter by photons and electrons, but does not correct for detector effects on the calorimeter measurement, including:
– calorimeter non-compensation (the ATLAS calorimeters’
response to hadrons is lower than their response to elec- trons of the same energy),
– energy losses in inactive regions of the detector (“dead material”),
– particles for which the shower is not totally contained in the calorimeter.
In addition, the baseline calibration does not correct for:
– particles that are clustered into the truth jet but for which the corresponding cluster is not in the reconstructed jet, – inefficiencies in energy clustering and jet reconstruction.
After a jet is identified, its energy is calibrated to account for these effects, as follows.
The jet energy calibration is carried out in 45 bins of η as a function of p
Tand is based upon MC simulation. The simulation has been validated using test-beam and collision data. Jets with pseudorapidity up to 1.2 are considered cen- tral, while jets with 1.2 < | η | < 2.8 belong to the end-cap region.
4The jet energy scale (JES) is obtained using reconstructed calorimeter jets matched to MC particle jets (truth jets, but excluding muons and neutrinos) within a cone of R = 0.3.
Each jet is required to be isolated, such that there are no other jets with p
T> 7 GeV within a cone of 2.5 × R around the jet axis. The distribution of the response of the calorimeter jets matched with MC particle-level jets, in bins of particle-level jet p
Tand η, is used to determine the av- erage jet energy response as the mean value of a Gaussian fit.
The correction is obtained by evaluating the transfer function between the energy of the particle-level and EM scale jets, inverting it, and refitting the resulting distribu- tion in bins of reconstructed p
Tto obtain a correction which
4The end-cap region includes the transition in the ATLAS detector be- tween the barrel and the end-cap, which needs special treatment be- cause of its geometry and material composition.
Fig. 2 Average jet energy scale correction, evaluated using PYTHIA6, for jets in the central barrel (circles) and end-cap (triangles) regions, shown in EM scalepTbins andηregions
can be applied in such bins. The JES correction is shown in Fig. 2 as a function of the jet p
Tat the EM scale, for anti-k
tjets with R = 0.6, for two of the rapidity bins. The size of the overall correction to the p
Tof the jets is below 75%, and for central jets with p
T> 60 GeV it is below 50%.
8 Uncertainty on the jet energy scale
The JES systematic uncertainty is derived combining infor- mation from test-beam data, LHC collision data and MC simulations.
The pseudorapidity bins used for the estimate of the jet energy scale uncertainty divide the detector in five |η| re- gions with boundaries at 0.0, 0.3, 0.8, 1.2, 2.1 and 2.8. This binning closely matches the binning in y used in the final cross section measurement, which follows the calorimeter geometry.
5Only jets with a particle-level jet p
T> 20 GeV, and a measured p
T> 10 GeV after calibration, are considered. No isolation requirement is imposed in the evaluation of the un- certainty in the JES.
8.1 Experimental conditions and calibration method Several sources of uncertainty related to the detector and ex- perimental conditions have been considered:
• Material and Geometry The effect of additional dead material on the jet energy scale has been evaluated with a dedicated geometry model in the simulation, which in- cludes the presence of additional material in front of the barrel calorimeters. Test-beam measurements [58] and
5For massless objects, rapidity and pseudorapidity are identical.
comparisons of 900 GeV data to simulations [59] have been used to conservatively estimate the largest possible change in the amount of material. The contribution to the JES uncertainty from this source is around 2% of the jet energy.
• Noise Thresholds The uncertainty on the JES due to pos- sible discrepancies between data and the description of the calorimeter electronic noise in the Monte Carlo was evaluated using MC simulation samples reconstructed with signal-to-noise thresholds for topological cluster seeds and cell neighbours modified to be 10% higher and 10% lower than their nominal values. The stability observed in the noise in special monitoring runs where calorimeter signals were studied in the absence of gen- uine signals, and the comparison of the noise distribution between data and MC simulation, indicate that this 10%
variation provides a conservative estimate of the uncer- tainty on the noise description. The maximum contribu- tion to the JES from this source occurs at low jet p
Tval- ues, where it is around 3% of the jet energy.
• Beamspot The jet reconstruction for the JES calibra- tion uses (x, y, z) = (0, 0, 0) as a reference to calcu- late the direction and p
Tof the input jet constituents.
If the beamspot is shifted with respect to this position, and if this shift is not correctly modelled, the jet p
Tcould be biased. The variation of the JES from differ- ences in the beamspot position between data and MC simulation is evaluated using a sample generated with a shifted beamspot of (x, y, z) = (1.5, 2.5, − 9) mm. This shift covers the shift in the current average coordinates observed from data collected by ATLAS from LHC colli- sions: (x, y, z) = ( −0.4, 0.62, −1.3) mm. The contribu- tion to the JES uncertainty is below 1% of the jet en- ergy.
• EM scale For the LAr calorimeters, the EM scale has been measured in test-beam studies, translating into a 3% uncertainty in the scale for in situ operation of the calorimeter [56, 58, 60].
For the tile calorimeter, the EM scale uncertainty of 4% is obtained by comparing test-beam muons, cosmic- ray muons and simulation [57].
These uncertainties are scaled according to the average fraction of jet energy deposited, respectively, in the elec- tromagnetic and hadronic calorimeter as a function of p
T, and combined to form the uncertainty on the EM scale.
• Closure test of the JES calibration Any deviation from unity (non-closure) in p
Tand energy response with re- spect to the particle jet after the application of the JES corrections to the nominal MC sample implies that the kinematics of the calibrated calorimeter jet are not re- stored to that of the corresponding particle jets. This can be caused by, for example, the fact that the JES calibra- tion is derived using isolated jets, while the systematic uncertainty is estimated for inclusive jets.
The systematic uncertainty due to the non-closure of the calibration procedure in any given bin is taken as the largest deviation of the response from unity seen either in energy or p
Tin that bin. The contribution to the uncer- tainty from this source is below 2% of the jet energy.
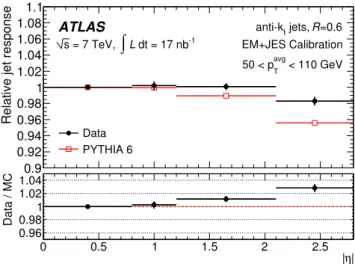
• JES uncertainty from dijet balance studies The JES uncertainty for the higher rapidity regions of the barrel and for the end-cap region is determined using the JES uncertainty for the central barrel region (0.3 < | η | < 0.8) as a baseline, and adding a contribution from the cali- bration of the jets with respect to it. This contribution is evaluated by measuring the relative p
Tbalance of for- ward jets in dijet events against reference central jets. The η intercalibration uncertainty is determined for jets where the average p
T(p
Tavg) of the two leading jets is between 50 GeV and 110 GeV and the resulting uncertainty is ap- plied to all p
T. Since the main sources of uncertainty have been shown to decrease for higher p
Tand energy values than those considered in the jet η-intercalibration study, this leads to a conservative estimate of the uncertainty in the end-cap region for most of the jets considered.
The ratio of the calorimeter response between the ref- erence jet (lying in the region 0 < | η | < 0.8) and the probe jet, as a function of the probe jet η, is shown in Fig. 3 for both data and simulation. Two contributions to the un- certainty are derived—that due to the difference between data and simulation, and that due to the deviation from unity in the data. The combined contribution to the JES uncertainty from these sources is below 3% of the jet en- ergy.
Fig. 3 JetpTresponse (pTjet,probe/pjet,reference
T ) after the EM scale plus JES (EM+JES) calibration against jets in the central reference region (0<|η|<0.8), obtained by exploiting thepTbalance as a function of ηin data and simulation. The lower plot indicates the ratio of the data to the simulation result
8.2 Hadronic shower model
The contributions to the JES uncertainty from the hadronic shower model are evaluated using two MC samples, one in which the Bertini nucleon cascade is not used, and one in which the Fritiof model [61] is used instead of the Quark Gluon String fragmentation model.
ATLAS test-beam data for single pions with energies ranging from 2 to 180 GeV have been compared to simula- tions using these two sets of parameters. The measured mean single pion response was shown to lie between these two de- scriptions over the whole p
Trange of particles in jets. These models lead to variations of within ±4% in the calorimeter response to hadrons. This is confirmed by studies in colli- sion data at both 900 GeV and 7 TeV, where the ratio of the energy measured in the calorimeter to the momentum mea- sured in the inner detector is evaluated for single isolated hadrons and compared to the MC simulation.
8.3 Event generator models
The contributions to the JES uncertainty from the fragmen- tation and underlying event models and parameters of the MC event generator are obtained using samples generated with A
LPGEN+ H
ERWIG+ J
IMMY(which has a dif- ferent matrix element, parton shower, hadronisation model and underlying event compared to the nominal sample), the P
YTHIA6 MC09 tune modified to use Perugia0 fragmenta- tion (which has a different underlying-event model with re- spect to the nominal sample [53]) and the P
YTHIA6 MC09 tune modified to use parameters tuned to LEP data using the P
ROFESSOR[54] software.
The observed deviations of the response from unity are smaller than 4%.
8.4 Pile-up
In data-taking periods with higher instantaneous luminos- ity, the effect of pile-up (multiple proton-proton interactions in the same bunch crossing) was small, but not negligible.
The size of the effect was estimated by studying the de- pendence of the average energy density deposited in the calorimeters as a function of the number of reconstructed vertices per event. No correction is applied for this effect, but it is accounted for in the JES uncertainty. For jets with 20 < p
T< 50 GeV, the pile-up fractional systematic uncer- tainty is about 1% in the barrel and 1–2% in the end-caps.
For p
T> 50 GeV, the pile-up uncertainty is only significant for |η| > 2.1, and is smaller than 1%.
8.5 Effect of decorrelated JES uncertainty on dijet observables
Dijet observables, which in a single event can span the en- tire range in rapidity, with one jet in the central region and
one in the end-cap region, are sensitive to decorrelations in the JES uncertainty as well as to its value at any given bin in rapidity. Based on results from dijet balance, a 3% positive shift in the jet energy scale was taken at | y | = 2.8 compared to that at |y | = 0, varying linearly in between and assumed to be symmetric in rapidity. This shift is interpreted as a 3% relative JES uncertainty and is added in quadrature to the other (absolute) sources of uncertainty for the dijet cross sections.
8.6 Combination of JES uncertainties
Given that the JES uncertainty is applied to all components of the jet four-momentum, the largest deviation from unity in each bin derived from energy or p
Tresponse is considered as the contribution to the final JES systematic uncertainty for each specific systematic effect.
All individual uncertainties are added in quadrature ex- cept that from the closure test, which is conservatively treated as fully correlated and added linearly.
Figure 4 shows the final fractional JES systematic un- certainty as a function of jet p
Tfor an example central η region. Figure 5 shows the forward region, where the con- tribution from intercalibration with the central region is also included. Both the total systematic uncertainty and the indi- vidual contributions are shown, with statistical errors from the fitting procedure if applicable. The pile-up uncertainty (see Sect. 8.4) and the dijet-specific relative uncertainty (see Sect. 8.5) are not included in these plots.
The maximum JES uncertainty in the central region amounts to approximately 9% for jets with 30 GeV < p
T<
60 GeV, and 7% for p
T> 60 GeV. The uncertainty is in- creased to up to 10% and 8% respectively for 30 GeV <
p
T< 60 GeV and p
T> 60 GeV in the end-cap region, where the central uncertainty is taken as a baseline and the uncertainty due to the intercalibration is added.
The dominant contributions to the uncertainty come from the hadronic shower model, the EM scale uncertainty, the detector material description, and the noise description.
The same study has been repeated for anti-k
tjets with resolution parameter R = 0.4, and the estimate of the JES uncertainty is comparable to anti-k
tjets with R = 0.6, albeit slightly smaller because of the reduced effect of the dead material variation and the change in the noise contribution due to the smaller jet radius. The JES uncertainty for anti-k
tjets with R = 0.4 is between ≈8% (9%) at low jet p
Tand
≈6% (7%) for jets with p
T> 60 GeV in the central (end- cap) region.
The overall JES uncertainty is consistent with the results
of detailed comparisons between collision data and simula-
tion.
Fig. 4 Fractional jet energy scale systematic uncertainty as a function ofpTfor jets in the pseudorapidity region 0.3<|η|<0.8 in the barrel calorimeter. The total systematic uncertainty is shown as well as the individual sources, with statistical errors if applicable
Fig. 5 Fractional jet energy scale systematic uncertainty as a function ofpTfor jets in the pseudorapidity region 2.1<|η|<2.8. The JES uncertainty for the end-cap is extrapolated from the barrel uncertainty using dijet balance, with the contributions from the deviation from unity in the data (ηrelative intercalibration) and the deviation between data and simulation (ηintercalibration Data/MC) shown separately.
The other individual sources are also shown, with statistical errors if applicable
9 Event selection
The jet algorithm is run on energy clusters assuming that the event vertex is at the origin. The jet momenta are then corrected for the beamspot position. After calibration, all events are required to have at least one jet within the kine- matic region p
T> 60 GeV, |y| < 2.8. Additional quality cri- teria are also applied to ensure that jets are not produced by noisy calorimeter cells or poorly-calibrated detector regions.
Events are required to have at least one vertex with at least five reconstructed tracks connected, within 10 cm in z of the beamspot. Simulated events are reweighted so that the z ver- tex distribution agrees with the data. Of the events passing the kinematic selection, 2.6% have more than one vertex.
The overall efficiency of these selection cuts, evaluated in simulation using triggered events with truth jets in the kine- matic region of the measurement, is above 99%, and has a
small dependence on the kinematic variables. Background contributions from non-pp-collision sources were evaluated using unpaired and empty bunches and found to be negligi- ble.
After this selection, 56 535 (77 716) events remain, for R = 0.4 (0.6), with at least one jet passing the inclusive jet selection. Of these, 45 621 (65 739) events also pass the dijet selection.
10 Data correction
The correction for trigger and detector efficiencies and res-
olutions, other than the energy scale correction already ap-
plied, is performed in a single step using a bin-by-bin un-
folding method evaluated using the MC samples. For each
measured distribution, the corresponding MC cross section
using truth jets (including muons and neutrinos) is evaluated in the relevant bins, along with the equivalent distributions after the detector simulation and analysis cuts. The ratio of the true to the simulated distributions provides a correction factor which is then applied to the data. P
YTHIA6 is used for the central correction. The uncertainty is estimated from the spread of the correction for the different generators, and also from artificially changing the shape of the simulated distributions by reweighting the MC samples within reason- able limits to account for possible biases caused by the input distribution.
This procedure is justified by the good modelling of the trigger efficiencies (Fig. 1) and the fact that the p
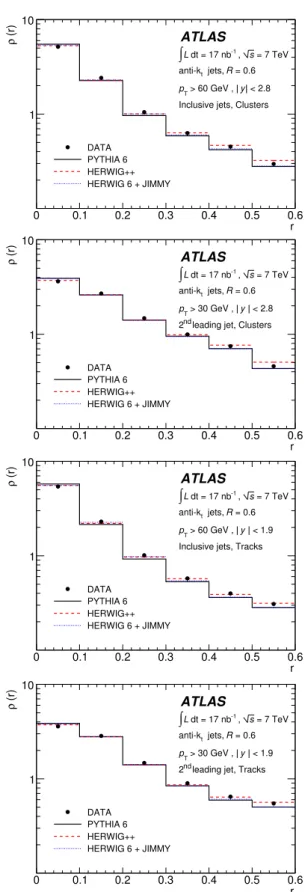
Tand y distributions of the jets are reasonably well described by the simulation [62]. It is also important that the energy flow around the jet core is well understood, both as a valida- tion of the QCD description contained in the event gener- ators and as a cross check of the calibration studies previ- ously discussed, most of which are sensitive to the distribu- tion of energy amongst particles, and within different angu- lar regions, within the jet. The energy and momentum flow within jets can be expressed in terms of the differential jet shape, defined as the fraction, ρ(r) = p
rT/p
RT, where p
TRis the transverse momentum within a radius R of the jet cen- tre, and p
Tris the transverse momentum contained within a ring of thickness r = 0.1 at a radius r =
(y)
2+ (φ)
2around the jet centre, divided by r. The jet shapes evalu- ated (without any correction for detector effects) using en- ergy clusters and tracks are shown separately in Fig. 6 for anti-k
tjets with R = 0.6. The jets simulated by P
YTHIA6 are slightly narrower than the jets in the data, while the H
ERWIG6 + J
IMMYand H
ERWIG++ simulations provide a somewhat better description. Overall the distribution of en- ergy within the jets is reasonably well simulated. A similar level of agreement has been demonstrated for R = 0.4 jets.
This gives further confidence in the calibrations and correc- tions applied.
The resolutions in y , p
T, dijet mass m
12, and dijet χ for anti-k
tjets with R = 0.6 within | y | < 2.8, as obtained using P
YTHIA6, are shown in Fig. 7. The present JES calibra- tion procedure applies an average correction to restore the jet response and does not attempt to optimise the jet energy resolution, which can be improved with more sophisticated calibration techniques. From dijet balance and E/p stud- ies of single hadrons, the p
Tresolution has been verified to within a fractional uncertainty of ≈14%, though at a lower p
Tthan most of the jets considered here. The effect of vary- ing the nominal p
Tresolution by up to 15% of its nominal value is included in the systematic uncertainty on the un- folding correction factors. The uncertainties due to the jet energy scale are also propagated to the final cross section through this unfolding procedure, by applying variations to
Fig. 6 The uncorrected jet shape measured using energy clusters (first two plots) and tracks (third and fourth plots) for anti-kt jets with R=0.6, compared to simulation, as a function of the radial distance to the jet axis,r. The first and third figures show the jet shapes for all jets withpT>60 GeV, and the second and fourth show the shape for the second highestpTjet in dijet events
Fig. 7 The upper two plots show the absolute (fractional) resolution and bias in jety(pT) as a function of truepT. The bottom two plots show the fractional resolution and bias in dijet massm12and angular variableχas a function of truth m12computed from the two leading truth jets. These are shown for all jets identified using the anti-ktalgorithm with R=0.6 in events passing the final kinematic selection, as predicted by PYTHIA6. The error bar indicates the resolution and the central value indicates the bias
Fig. 8 Correction factors for the inclusive jetpTspectrum in the rapidity bins 0.3<|y|<0.8 (left) and 2.1<|y|<2.8 (right), along with systematic uncertainties due to
uncertainties in the jetpT
spectrum shape, jet energy resolution, and jet angular resolution. The band on the correction factor indicates the total systematic uncertainty on the correction
simulated samples. A fit is used to reduce statistical fluc- tuations in the systematic uncertainties from the jet energy scale for the dijet mass spectrum.
The overall correction factor for the p
Tspectrum is be- low 20% throughout the kinematic region, and below 10%
for central jets with p
T> 60 GeV. As an example, the cor- rection factors for the p
Tspectrum with R = 0.6 are shown along with their systematic uncertainties in Fig. 8 for two
rapidity regions. For the dijet mass spectrum, the correction factors are generally within 15% while for χ they are less than 5%.
The integrated luminosities are calculated during runs
6by measuring interaction rates using several ATLAS devices
6An ATLAS run is a period of continuous data-taking during an LHC proton fill.
at small angles to the beam direction, with the absolute cal- ibration obtained from van der Meer scans. The uncertainty in the luminosity is estimated to be 11% [63].
The final systematic uncertainty in the cross section mea- surements is dominated by the jet energy scale uncertainty.
11 Results and discussion
The cross sections from the parton-shower MC generators considered here are not reliable, since these calculations are performed at leading-order. However, many important kine- matic terms are included in these calculations, and, unlike the NLO pQCD calculations, the predictions are made at the particle level. A comparison of the shapes of the distri- butions is therefore valuable. The expectations for the cor- rected p
Tand χ distributions from two different P
YTHIA6 parameter tunes, as well as for H
ERWIG6 + J
IMMYpro- grams are compared to the data in Figs. 9–12. The normal- isation of the simulation is to the inclusive jet cross section separately for each R value, and requires the factors shown in the legend.
7In general the simulations agree with the shapes of the data distributions.
The differential inclusive jet cross section in 7 TeV proton-proton collisions is shown in Figs. 13 and 14, as a function of jet p
T, for anti-k
tjets with R = 0.4 and R = 0.6 respectively. The cross section extends from p
T= 60 GeV up to around p
T= 600 GeV, and falls by more than four or- ders of magnitude over this range. The data are compared to NLO pQCD calculations corrected for non-perturbative effects. For both R = 0.4 and R = 0.6, data and theory are consistent.
Figures 15 and 16 show the double-differential cross sec- tion as a function of jet p
Tin several different regions of rapidity. Tables 1–3 and 4–6 detail the same data. A selec- tion of the same cross sections expressed as a function of rapidity in different p
Tranges is shown in Figs. 17 and 18.
In Figs. 19 and 20 the ratio of the measurement to the theo- retical prediction is shown for the double-differential distri- bution in jet p
Tfor R = 0.4 and R = 0.6 respectively. The data are again compared to NLO pQCD predictions to which soft corrections have been applied, where the predictions are also given in the tables. In all regions, the theory is consis- tent with the data.
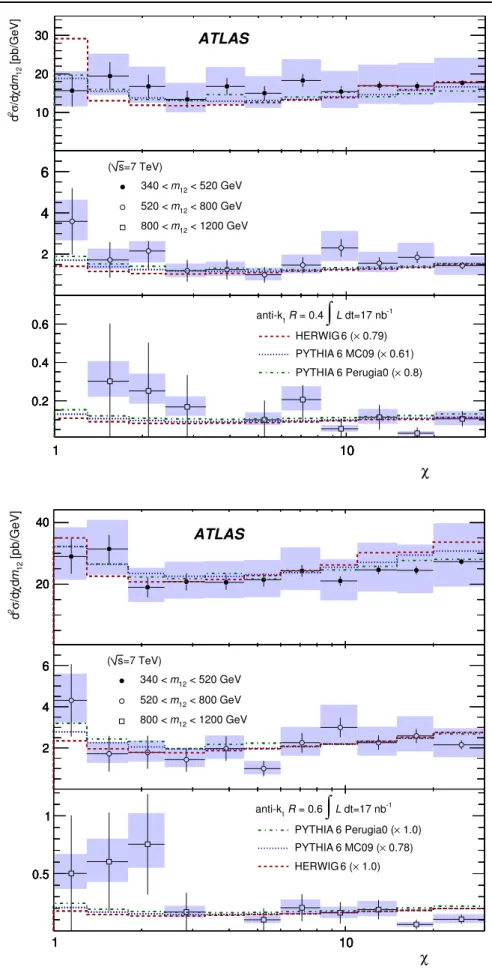
In Figs. 21 and 23, the double-differential dijet cross sec- tion is shown as a function of the dijet mass, for different bins in | y |
max. The cross section falls rapidly with mass, and extends up to masses of nearly 2 TeV. Figures 22 and 24 show the cross section as a function of the dijet angular vari- able χ for different ranges of the dijet mass m
12. The data
7If theR=0.4 andR=0.6 measurements are fitted simultaneously, the factors are 0.91, 0.92 and 0.69 for HERWIG+JIMMY, PYTHIA6 Perugia0 tune and PYTHIA6 MC09 respectively.
are compared to NLO pQCD calculations corrected for non- perturbative effects. The theory is consistent with the data.
The dijet mass measurements and the theory predictions are also given in Tables 7–11 and 12–16 for R = 0.4 and R = 0.6 respectively. Those for χ are given in Tables 17–19 and 20–22.
In Figs. 25 and 26 the ratio of the measurement to the theoretical prediction is shown for the double-differential di- jet cross sections for R = 0.4 and R = 0.6 respectively. The data are again compared to NLO pQCD predictions to which soft corrections have been applied, also included in the ta- bles. In all regions, the theory is consistent with the data.
12 Conclusion
Inclusive and dijet cross sections have been measured for the first time in proton-proton collisions with the ATLAS detec- tor, at a centre-of-mass energy of 7 TeV, using an integrated luminosity of 17 nb
−1.
The cross sections have been measured with the anti-k
talgorithm using two different R parameters, with different sensitivity to soft QCD corrections. This is the first cross section measurement in hadron-hadron collisions using this jet algorithm.
The cross sections extend into previously unmeasured kinematic regimes. For inclusive jets, the double-differential cross section has been measured for jets with | y | < 2.8 and p
T> 60 GeV. The p
Tdistribution extends up to 600 GeV.
For dijet events, containing a jet with p
T> 30 GeV in the same rapidity region, the cross section has been measured as a function of the dijet mass and of the angular variable χ.
The dijet mass distribution extends up to nearly 2 TeV.
The dominant systematic uncertainty in these measure- ments comes from the jet energy response of the calorimeter.
This scale uncertainty has been determined to be below 10%
over the whole kinematic range of these measurements, and to be below 7% for central jets with p
T> 60 GeV, leading to a systematic uncertainty in the cross sections of around 40%.
The measurements use only 17 nb
−1of integrated lumi- nosity, but the statistical errors are not the dominant con- tribution to the uncertainty below around 300 GeV in trans- verse momentum. Data already recorded by ATLAS will ex- tend the reach of subsequent measurements and their preci- sion at high transverse momenta.
Leading-logarithmic parton-shower MC generators pro- vide a reasonable description of the energy flow around the jets, and of the shapes of the measured distributions.
The differential cross sections have been compared to
NLO pQCD calculations corrected for non-perturbative ef-
fects. The inclusive jet measurements are sensitive to the
combination of the QCD matrix element and parton den-
sities within the proton, evolved from determinations made
using measurements from previous experiments at lower en-
ergy scales. The dijet measurements have been made in a region where the sensitivity to the parton distributions is re- duced, and thus primarily test the structure of the QCD ma- trix element. The comparison is made for two different R parameters, showing that the level of agreement is robust under different soft corrections, as well as under the evolu- tion of the perturbative cross section with R. For both in- clusive and dijet measurements, the theory agrees well with the data, validating this perturbative QCD approach in a new kinematic regime.
Acknowledgements We deeply thank everybody at CERN involved in operating the LHC in such a superb way during this initial high- energy data-taking period. We acknowledge equally warmly all the technical and administrative staff in the collaborating institutions with- out whom ATLAS could not be operated so efficiently.
We acknowledge the support of ANPCyT, Argentina; Yerevan Physics Institute, Armenia; ARC and DEST, Australia; Bundesminis- terium für Wissenschaft und Forschung, Austria; National Academy of Sciences of Azerbaijan; State Committee on Science & Technologies of the Republic of Belarus; CNPq and FINEP, Brazil; NSERC, NRC, and CFI, Canada; CERN; CONICYT, Chile; NSFC, China; COL-
CIENCIAS, Colombia; Ministry of Education, Youth and Sports of the Czech Republic, Ministry of Industry and Trade of the Czech Republic, and Committee for Collaboration of the Czech Republic with CERN;
DNRF, DNSRC and the Lundbeck Foundation, Denmark; European Commission, through the ARTEMIS Research Training Network;
IN2P3-CNRS and CEA-DSM/IRFU, France; Georgian Academy of Sciences; BMBF, DFG, HGF and MPG, Germany; Ministry of Edu- cation and Religion, through the EPEAEK program PYTHAGORAS II and GSRT, Greece; ISF, MINERVA, GIF, DIP, and Benoziyo Cen- ter, Israel; INFN, Italy; MEXT, Japan; CNRST, Morocco; FOM and NWO, Netherlands; The Research Council of Norway; Ministry of Science and Higher Education, Poland; GRICES and FCT, Portugal;
Ministry of Education and Research, Romania; Ministry of Education and Science of the Russian Federation and State Atomic Energy Cor- poration ROSATOM; JINR; Ministry of Science, Serbia; Department of International Science and Technology Cooperation, Ministry of Ed- ucation of the Slovak Republic; Slovenian Research Agency, Ministry of Higher Education, Science and Technology, Slovenia; Ministerio de Educación y Ciencia, Spain; The Swedish Research Council, The Knut and Alice Wallenberg Foundation, Sweden; State Secretariat for Edu- cation and Science, Swiss National Science Foundation, and Cantons of Bern & Geneva, Switzerland; National Science Council, Taiwan;
TAEK, Turkey; The STFC, the Royal Society and The Leverhulme Trust, United Kingdom; DOE and NSF, United States of America.
Fig. 9 Inclusive jet double-differential cross section as a function of pT, for different bins of rapidity|y|. The results are shown for jets iden- tified using the anti-ktalgorithm withR=0.4. The data are compared to leading-logarithmic parton-shower MC simulations, normalised to the measured cross section by the factors shown in the legend, fixed to give the best normalisation to the inclusive jet measurements. The
bands indicate the total systematic uncertainty on the data. The error bars indicate the statistical uncertainty, which is calculated as 1/√
N, whereNis the number of entries in a given bin. The insets along the right-hand side show the ratio of the data to the various MC simula- tions
Fig. 10 Inclusive jet double-differential cross section as a function of pT, for different bins of rapidity|y|. The results are shown for jets iden- tified using the anti-ktalgorithm withR=0.6. The data are compared to leading-logarithmic parton-shower MC simulations, normalised to the measured cross section by the factors shown in the legend, fixed to give the best normalisation to the inclusive jet measurements. The
bands indicate the total systematic uncertainty on the data. The error bars indicate the statistical uncertainty, which is calculated as 1/√
N, whereNis the number of entries in a given bin. The insets along the right-hand side show the ratio of the data to the various MC simula- tions
Fig. 11 Dijet
double-differential cross section as a function of angular variable χin different regions of dijet massm12, for jets identified using the anti-ktalgorithm with R=0.4. The data are compared to leading-logarithmic parton-shower MC simulations, normalised to the measured cross section by the factors shown in the legend, fixed to give the best normalisation to the inclusive jet measurements.
The bands indicate the total systematic uncertainty on the data. The error bars indicate the statistical uncertainty, which is calculated as 1/√
N, whereNis the number of entries in a given bin
Fig. 12 Dijet
double-differential cross section as a function of angular variable χin different regions of dijet massm12, for jets identified using the anti-ktalgorithm with R=0.6. The data are compared to leading-logarithmic parton-shower MC simulations, normalised to the measured cross section by the factors shown in the legend, fixed to give the best normalisation to the inclusive jet measurements.
The bands indicate the total systematic uncertainty on the data. The error bars indicate the statistical uncertainty, which is calculated as 1/√
N, whereNis the number of entries in a given bin
Fig. 13 Inclusive jet differential cross section as a function of jetpTintegrated over the full region|y|<2.8 for jets identified using the anti-kt
algorithm withR=0.4. The data are compared to NLO pQCD calculations to which soft QCD corrections have been applied. The error bars indicate the statistical uncertainty on the measurement, and the shaded bands indicate the quadratic sum of the systematic uncertainties, dominated by the jet energy scale uncertainty. The statistical uncertainty is calculated as 1/√
N, whereNis the number of entries in a given bin. There is an additional overall uncertainty of 11% due to the luminosity measurement that is not shown.
The theory uncertainty shown is the quadratic sum of
uncertainties from the choice of renormalisation and
factorisation scales, parton distribution functions,αs(MZ), and the modelling of soft QCD effects, as described in the text
Fig. 14 Inclusive jet differential cross section as a function of jetpTintegrated over the full region|y|<2.8 for jets identified using the anti-kt
algorithm withR=0.6. The data are compared to NLO pQCD calculations to which soft QCD corrections have been applied. The uncertainties on the data and theory are shown as described in Fig.13
Fig. 15 Inclusive jet
double-differential cross section as a function of jetpTin different regions of|y|for jets identified using the anti-kt
algorithm withR=0.4. The data are compared to NLO pQCD calculations to which soft QCD corrections have been applied. The uncertainties on the data and theory are shown as described in Fig.13
Fig. 16 Inclusive jet
double-differential cross section as a function of jetpTin different regions of|y|for jets identified using the anti-kt
algorithm withR=0.6. The data are compared to NLO pQCD calculations to which soft QCD corrections have been applied. The uncertainties on the data and theory are shown as described in Fig.13
Fig. 17 Inclusive jet
double-differential cross section as a function of jet|y|in different regions ofpTfor jets identified using the anti-kt
algorithm withR=0.4. The data are compared to NLO pQCD calculations to which soft QCD corrections have been applied. The uncertainties on the data and theory are shown as described in Fig.13
Fig. 18 Inclusive jet
double-differential cross section as a function of jet|y|in different regions ofpTfor jets identified using the anti-kt algorithm withR=0.6. The data are compared to NLO pQCD calculations to which soft QCD corrections have been applied. The uncertainties on the data and theory are shown as described in Fig.13
Fig. 19 Inclusive jet
double-differential cross section as a function of jetpTin different regions of|y|for jets identified using the anti-kt
algorithm withR=0.4. The ratio of the data to the theoretical prediction is shown, indicating the total systematic uncertainty on the measurement.
The uncertainties on the data and theory are shown as described in Fig.13
Fig. 20 Inclusive jet
double-differential cross section as a function of jetpTin different regions of|y|for jets identified using the anti-kt
algorithm withR=0.6. The ratio of the data to the theoretical prediction is shown, indicating the total systematic uncertainty on the measurement.
The uncertainties on the data and theory are shown as described in Fig.13
Fig. 21 Dijet double-differential cross section as a function of dijet mass, binned in the maximum rapidity of the two leading jets,|y|max. The results are shown for jets identified using the anti-kt algorithm withR=0.4. The data are compared to NLO pQCD calculations to which soft QCD corrections have been applied. The uncertainties on the data and theory are shown as described in Fig.13
Fig. 22 Dijet double-differential cross section as a function of angular variableχin different bins of dijet massm12, for jets identified using the anti-kt algorithm withR=0.4. The data are compared to NLO pQCD calculations to which soft QCD corrections have been applied.
The uncertainties on the data and theory are shown as described in Fig.13
Fig. 23 Dijet double-differential cross section as a function of dijet mass, binned in the maximum rapidity of the two leading jets,|y|max. The results are shown for jets identified using the anti-kt algorithm withR=0.6. The data are compared to NLO pQCD calculations to which soft QCD corrections have been applied. The uncertainties on the data and theory are shown as described in Fig.13
Fig. 24 Dijet double-differential cross section as a function of angular variableχ in different bins of dijet massm12, for jets identified using the anti-kt algorithm withR=0.6. The data are compared to NLO pQCD calculations to which soft QCD corrections have been applied.
The uncertainties on the data and theory are shown as described in Fig.13
Fig. 25 Dijet double-differential cross sections as a function of dijet massm12andχas shown in Fig.21and Fig.22respectively, expressed as a ratio to the theoretical prediction. These are shown for jets identi- fied using the anti-ktalgorithm withR=0.4. The uncertainties on the
data and theory are displayed as described in Fig.13. For each of the two lowest|y|maxbins of the dijet mass spectrum, a data point with large statistical uncertainty at high mass lies outside the plotted range of the ratio (see Tables7–11)
Fig. 26 Dijet double-differential cross sections as a function of dijet massm12andχas shown in Fig.23and Fig.24respectively, expressed as a ratio to the theoretical prediction. These are shown for jets identi- fied using the anti-ktalgorithm withR=0.6. The uncertainties on the
data and theory are displayed as described in Fig.13. For the lowest
|y|maxbin of the dijet mass spectrum, two data points with large statis- tical uncertainty at high mass lie outside the plotted range of the ratio (see Tables12–16)