EUROPEAN ORGANISATION FOR NUCLEAR RESEARCH (CERN)
CERN-PH-EP-2013-029
Submitted to: Physics Letters B
Measurement with the ATLAS detector of multi-particle azimuthal correlations in
p+
Pb collisions at√
s
NN= 5.02 TeV
The ATLAS Collaboration
Abstract
In order to study further the long-range correlations (“ridge”) observed recently inp+Pb collisions at√
sNN = 5.02 TeV, the second-order azimuthal anisotropy parameter of charged particles, v2, has been measured with the cumulant method using the ATLAS detector at the LHC. In a data sample corresponding to an integrated luminosity of approximately 1 µb−1, the parameter v2 has been ob- tained using two- and four-particle cumulants over the pseudorapidity range |η| < 2.5. The results are presented as a function of transverse momentum and the event activity, defined in terms of the transverse energy summed over3.1 < η < 4.9 in the direction of the Pb beam. They show features characteristic of collective anisotropic flow, similar to that observed in Pb+Pb collisions. A comparison is made to results obtained using two-particle correlation methods, and to predictions from hydrody- namic models of p+Pb collisions. Despite the small transverse spatial extent of the p+Pb collision system, the large magnitude of v2 and its similarity to hydrodynamic predictions provide additional evidence for the importance of final-state effects inp+Pb reactions.
arXiv:1303.2084v2 [hep-ex] 16 May 2013
Measurement with the ATLAS detector of multi-particle azimuthal correlations in p+Pb collisions at √
sNN = 5.02 TeV
The ATLAS Collaboration
Abstract
In order to study further the long-range correlations (“ridge”) observed recently in p+Pb collisions at
√sNN = 5.02 TeV, the second-order azimuthal anisotropy parameter of charged particles, v2, has been measured with the cumulant method using the ATLAS detector at the LHC. In a data sample corresponding to an integrated luminosity of approximately 1µb−1, the parameter v2 has been obtained using two- and four-particle cumulants over the pseudorapidity range |η| < 2.5. The results are presented as a function of transverse momentum and the event activity, defined in terms of the transverse energy summed over 3.1 < η <4.9 in the direction of the Pb beam. They show features characteristic of collective anisotropic flow, similar to that observed in Pb+Pb collisions. A comparison is made to results obtained using two- particle correlation methods, and to predictions from hydrodynamic models ofp+Pb collisions. Despite the small transverse spatial extent of the p+Pb collision system, the large magnitude of v2 and its similarity to hydrodynamic predictions provide additional evidence for the importance of final-state effects in p+Pb reactions.
1. Introduction
1
Recent observations of ridge-like structures in
2
the two-particle correlation functions measured in
3
proton-lead (p+Pb) collisions at 5.02 TeV [1–3]
4
have led to differing theoretical explanations. These
5
structures have been attributed either to mecha-
6
nisms that emphasize initial-state effects, such as
7
the saturation of parton distributions in the Pb-
8
nucleus [4–7], or to final-state effects, such as jet–
9
medium interactions [8], interactions induced by
10
multiple partons [9–12], and collective anisotropic
11
flow [13–18].
12
The collective flow of particles produced in nu-
13
clear collisions, which manifests itself as a sig-
14
nificant anisotropy in the plane perpendicular to
15
the beam direction, has been extensively studied
16
in heavy-ion experiments at the LHC [19–24] and
17
RHIC (for a review see Refs. [25, 26]). In p+Pb
18
collisions the small size of the produced system
19
compared to the mean free path of the interacting
20
constituents might have been expected to generate
21
weaker collective flow, if any, compared to heavy-
22
ion collisions.
23
However, two-particle correlation studies per-
24
formed recently on data from p+Pb collisions at
25 √
sNN = 5.02 TeV revealed the presence of a
26
“ridge”, a structure extended in the relative pseudo-
27
rapidity, ∆η, while narrow in the relative azimuthal
28
angle, ∆φ, on both the near-side (∆φ∼0) [1] and
29
away-side (∆φ ∼ π) [2, 3]. Furthermore, it was
30
shown in Refs. [2, 3] that, after subtracting the com-
31
ponent due to momentum conservation, the ∆φdis-
32
tribution in high-multiplicity interactions exhibits a
33
predominantly cos(2∆φ) shape, resembling the el-
34
liptic flow modulation of the ∆φ distributions in
35
Pb+Pb collisions.
36
The final-state anisotropy is usually character-
37
ized by the coefficients, vn, of a Fourier decompo-
38
sition of the event-by-event azimuthal angle distri-
39
bution of produced particles [25, 27]:
40
vn=hcosn(φ−Ψn)i, (1)
41
where φ is the azimuthal angle of the particle, Ψn
42
is the event-plane angle for then-th harmonic, and
43
the outer brackets denote an average over charged
44
particles in an event. In non-central heavy-ion col-
45
lisions, the large and dominating v2 coefficient is
46
associated mainly with the elliptic shape of the nu-
47
clear overlap, and Ψ2 defines the direction which
48
nominally points in the direction of the classical
49
impact parameter. In practice, initial-state fluctu-
50
ations can blur the relationship between Ψ2 and
51
the impact parameter direction in nucleus-nucleus
52
collisions. In contrast, Ψ2 in proton-nucleus would
53
be unrelated to the impact parameter and deter-
54
mined by the initial-state fluctuations. In nucleus-
55
nucleus collisions, the v2 coefficient in central col-
56
lisions and the othervn coefficients in all collisions
57
are related to various geometric configurations aris-
58
ing from fluctuations of the nucleon positions in the
59
overlap region [28].
60
In this Letter, a direct measurement of the
61
second-order anisotropy parameter,v2, is presented
62
for p+Pb collisions at √
sNN = 5.02 TeV. The cu-
63
mulant method [29–32] is applied to derivev2using
64
two- and four-particle cumulants. The cumulant
65
method has been developed to characterize true
66
multi-particle correlations related to the collective
67
expansion of the system, while suppressing correla-
68
tions from resonance decays, Bose–Einstein corre-
69
lations and jet production. Emphasis is placed on
70
the estimate of v2, v2{4}, obtained from the four-
71
particle cumulants which are expected to be free
72
from the effects of short-range two-particle correla-
73
tions, e.g. from resonance decays, unlike the two-
74
particle cumulants, used to estimatev2{2}.
75
The measurements of multi-particle cumulants
76
presented in this Letter should provide further con-
77
straints on the origin of long-range correlations ob-
78
served inp+Pb collisions.
79
2. Event and track selections
80
The p+Pb data sample was collected during a
81
short run in September 2012, when the LHC deliv-
82
eredp+Pb collisions at the nucleon–nucleon centre-
83
of-mass energy√
sNN = 5.02 TeV with the centre-
84
of-mass frame shifted by−0.47 in rapidity relative
85
to the nominal ATLAS coordinate frame1.
86
The measurements were performed using the
87
ATLAS detector [33]. The inner detector (ID)
88
was used for measuring trajectories and momenta
89
1ATLAS uses a right-handed coordinate system with its origin at the nominal interaction point (IP) in the centre of the detector and thez-axis along the beam pipe. Thex-axis points from the IP to the centre of the LHC ring, and the y-axis points upward. Cylindrical coordinates (r, φ) are used in the transverse plane,φbeing the azimuthal angle around the beam pipe. For the p+Pb collisions, the incident Pb beam travelled in the +z direction. The pseudorapidity is defined in laboratory coordinates in terms of the polar angle θas η=−ln tan(θ/2). Transverse momentum and energy are defined aspT=psinθandET=Esinθ, respectively.
of charged particles for |η| < 2.5 with the sil-
90
icon pixel detector and silicon microstrip detec-
91
tors (SCT), and a transition radiation tracker, all
92
placed in a 2 T axial magnetic field. For event trig-
93
gering, two sets of Minimum Bias Trigger Scintil-
94
lators (MBTS), located symmetrically in front of
95
the endcap calorimeters, at z = ±3.6 m and cov-
96
ering the pseudorapidity range 2.1 < |η| < 3.9,
97
were used. The trigger used to select minimum-
98
bias p+Pb collisions requires a signal in at least
99
two MBTS counters. This trigger is fully effi-
100
cient for events with more than four reconstructed
101
tracks with pT >0.1 GeV. The forward calorime-
102
ters (FCal), consisting of two symmetric systems
103
with tungsten and copper absorbers and liquid ar-
104
gon as the active material, cover 3.1<|η|<4.9 and
105
are used to characterize the overall event activity.
106
The event selection follows the same require-
107
ments as used in the recent two-particle correlation
108
analysis [3]. Events are required to have a recon-
109
structed vertex with itszposition within±150 mm
110
of the nominal interaction point. Beam–gas and
111
photonuclear interactions are suppressed by requir-
112
ing at least one hit in a MBTS counter on each side
113
of the interaction point and at most a 10 ns dif-
114
ference between times measured on the two sides
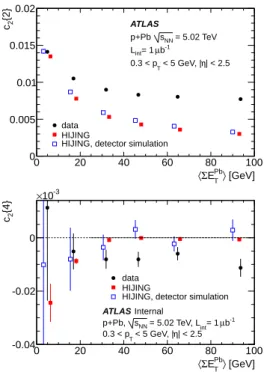
115
to eliminate through-going particles. To elimi-
116
nate multiplep+Pb collisions (about 2% of collision
117
events have more than one reconstructed vertex),
118
the events with two reconstructed vertices that are
119
separated in z by more than 15 mm are rejected.
120
In addition, for the cumulant analysis presented
121
here, it is required that the number of reconstructed
122
tracks per event, passing the track selections as de-
123
scribed below, is greater than three. With all the
124
above selections, the analysed sample consists of
125
about 1.9×10⁶ events.
126
Charged particle tracks are reconstructed in the
127
ID using the standard algorithm optimized forp+p
128
minimum-bias measurements [34]. Tracks are re-
129
quired to have at least six hits in the SCT detector
130
and at least one hit in the pixel detector. A hit in
131
the first pixel layer is also required when the track
132
crosses an active pixel module in that layer. Addi-
133
tional requirements are imposed on the transverse
134
(d0) and longitudinal (z0sinθ) impact parameters
135
measured with respect to the primary vertex. These
136
are: |d0|and|z0sinθ|must be smaller than 1.5 mm
137
and must satisfy|d0/σd0|<3 and|z0sinθ/σz|<3,
138
where σd0 and σz are uncertainties on the trans-
139
verse and longitudinal impact parameters, respec-
140
tively, as obtained from the covariance matrix of
141
[GeV]
T
EPb
Σ
0 50 100 150 200
Number of events
1 10 102
103
104
105 ATLAS
= 5.02 TeV sNN
p+Pb b-1
µ
int= 1 L
ch
Nrec
0 50 100 150 200 250 300
Number of events
1 10 102
103
104
105 ATLAS p+Pb sNN = 5.02 TeV b-1
µ
int= 1 L
|<2.5 η < 5 GeV, | 0.3 < pT
Fig. 1: Upper plot: the ΣEPbT distribution with the six ac- tivity intervals indicated. Lower plot: the distribution of Nchrec for each activity interval. The leftmost distribution corresponds to the interval with the lowest ΣETPb, etc.
the track fit. The analysis is restricted to charged
142
particles with 0.3< pT<5.0 GeV and|η|<2.5.
143
The tracking efficiency is evaluated using
144
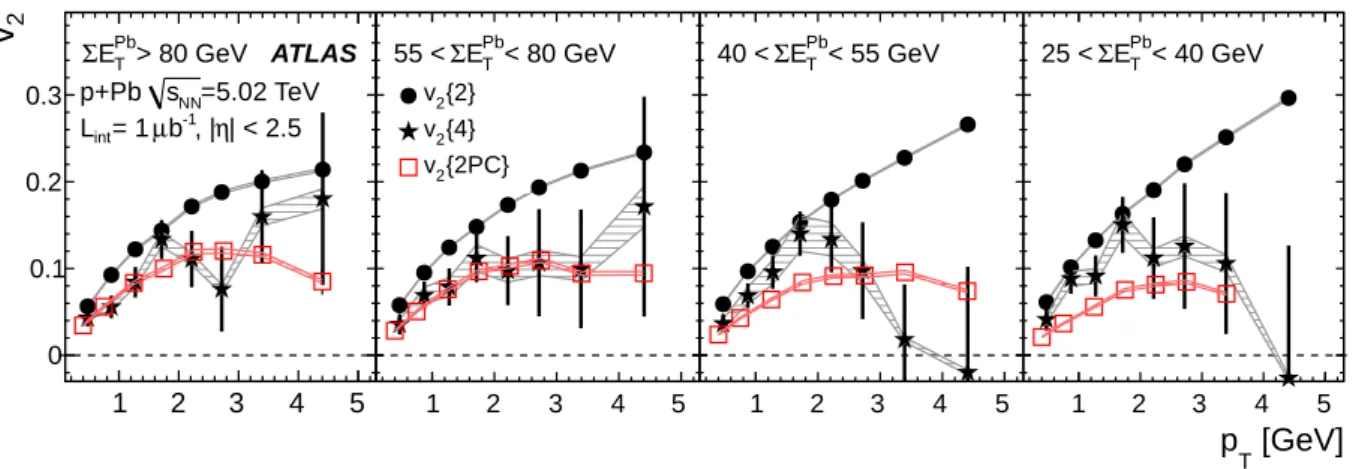
HIJING-generated [35]p+Pb events that are fully
145
simulated in the detector using GEANT4 [36, 37],
146
and processed through the same reconstruction
147
software as the data. The efficiency for charged
148
hadrons is found to depend only weakly on the
149
event multiplicity and on pT for transverse mo-
150
menta above 0.5 GeV. An efficiency of about 82%
151
is observed at mid-rapidity, |η| <1, decreasing to
152
about 68% at|η|>2. For low-pT tracks, between
153
0.3 GeV and 0.5 GeV, the efficiency ranges from
154
74% atη= 0 to about 50% for|η|>2. The number
155
of reconstructed charged particle tracks, not cor-
156
rected for tracking efficiency, is denoted byNchrec.
157
The analysis is performed in different intervals
158
of ΣETPb, the sum of transverse energy measured
159
in the FCal with 3.1 < η <4.9 in the direction of
160
the Pb beam with no correction for the difference in
161
ΣETPb hΣEPbT i range in hNchreci
range fraction (RMS)
[GeV] [GeV] of events [%]
>80 93.7 0–1.9 134 (31) 55–80 64.8 1.9–9.1 102 (26) 40–55 46.7 9.1–20.0 80 (23) 25–40 31.9 20.0–39.3 60 (20) 10–25 16.9 39.3–70.4 37 (17)
<10 4.9 70.4–100 16 (11)
Table 1: Characterization of activity intervals as selected by ΣEPbT . In the last column, the mean and RMS of the number of reconstructed charged particles with|η|<2.5 and 0.3< pT<5 GeV,Nchrec, is given for each activity interval.
response to electrons and hadrons. The distribution
162
of ΣETPb for events passing all selection criteria is
163
shown in Fig. 1. These events are divided into six
164
ΣETPb intervals to study the variation of v2 with
165
overall event activity, as indicated in Fig. 1 and
166
shown in Table 1. Event “activity” is characterized
167
by ΣETPb: the most active events are those with
168
the largest ΣETPb. The distribution ofNchrec for each
169
activity interval is shown in the lower plot of Fig. 1.
170
3. Data analysis
171
The cumulant method involves the calculation of
172
2k-particle azimuthal correlations, corrn{2k}, and
173
cumulants, cn{2k}, wherek= 1,2 for the analysis
174
presented in this paper. The two- and four-particle
175
correlations are defined as corrn{2}=hein(φ1−φ2)i
176
and corrn{4}=hein(φ1+φ2−φ3−φ4)i, respectively,
177
where the angle brackets denote the average in
178
a single event over all pairs and all combina-
179
tions of four particles. After averaging over
180
events, the two-particle cumulant is obtained as
181
cn{2}=hcorrn{2}i, and the four-particle cumulant
182
cn{4}=hcorrn{4}i −2· hcorrn{2}i2. Thus the ef-
183
fect of two-particle correlations is explicitly re-
184
moved in the expression for cn{4}. Further details
185
are given in Refs. [29, 30, 32].
186
Direct calculation of multi-particle correlations
187
requires multiple passes over the particles in an
188
event, and requires extensive computing time in
189
high-multiplicity events. To mitigate this, it has
190
been proposed in Ref. [32] to express multi-particle
191
correlations in terms of the moments of the flow
192
vectorQn, defined asQn=P
ieinφi, where the in-
193
dexndenotes the flow harmonic and the sum runs
194
over all particles in an event. This analysis is re-
195
stricted to the second harmonic coefficient,n= 2.
196
The method based on the flow-vector moments en-
197
ables the calculation of multi-particle cumulants in
198
a single pass over the full set of particles in each
199
event.
200
The cumulant method involves two main steps
201
[29, 30]. In the first step, the so-called “refer-
202
ence” flow harmonic coefficients are calculated us-
203
ing multi-particle cumulants for particles selected
204
inclusively from a broad range inpT andη as:
205
vref2 {2}=p
c2{2}, (2)
vref2 {4}=p4
−c2{4}, (3)
where vref2 {2} (vref2 {4}) denotes the reference es-
206
timate of the second-order anisotropy parameter
207
obtained using two-particle, c2{2} (four-particle,
208
c2{4}) cumulants.
209
The flow-vector method is easiest to apply when
210
the detector acceptance is azimuthally uniform [32].
211
A correction for any azimuthal non-uniformity in
212
the reconstruction of charged particle tracks is ob-
213
tained from the data [25], based on an η–φ map
214
of all reconstructed tracks. For each small (δη =
215
0.1, δφ = 2π/64) bin (labelled i), a weight is cal-
216
culated as wi(η, φ) = hN(δη)i/Ni(δη, δφ), where
217
hN(δη)i is the event-averaged number of tracks
218
in the δη slice to which this bin belongs, while
219
Ni(δη, δφ) is the number of tracks in an event
220
within this bin. Using this weight forces the az-
221
imuthal angle distribution of reference particles to
222
be uniform in φ, but it does not change the η
223
distribution of reconstructed tracks. A weighted
224
Q-vector is evaluated as Qn = P
iwieinφi [32].
225
From Eqs. (2) and (3) it is clear that the cumu-
226
lant method can be used to estimatev2 only when
227
c2{4}is negative andc2{2} positive.
228
In the second step, the harmonic coefficients are
229
determined as functions ofpTandη, in bins in each
230
variable (10 bins of equal width are used inηand 22
231
bins of varied width inpT). These differential flow
232
harmonics are calculated for “particles of interest”
233
which fall into these small bins. First, the differen-
234
tial cumulants, d2{2} and d2{4}, are obtained by
235
correlating every particle of interest with one and
236
three reference particles respectively. The differen-
237
tial second harmonic,v2{2k}(pT, η), wherek= 1,2,
238
is then calculated with respect to the reference flow
239
as derived in Refs. [29, 30]:
240
v2{2}(pT, η) = d2{2}
pc2{2}, (4)
v2{4}(pT, η) = −d2{4}
3/4p
−c2{4}. (5) The differential v2 harmonic is then integrated
241
over wider phase-space bins, with each small bin
242
weighted by the appropriate charged particle mul-
243
tiplicity. This is obtained from the reconstructed
244
multiplicity by applying η- andpT-dependent effi-
245
ciency factors, determined from Monte Carlo (MC)
246
simulation as discussed in the previous section. Due
247
to the small number of events in the data sample,
248
the final results are integrated over the full accep-
249
tance in η.
[GeV]
T〉 EPb
Σ
〈
0 20 40 60 80 100
{2}2c
0 0.005 0.01 0.015 0.02
data HIJING
HIJING, detector simulation ATLAS
= 5.02 TeV sNN
p+Pb b-1
µ
int= 1 L
| < 2.5 η < 5 GeV, | 0.3 < pT
[GeV]
T〉 EPb
Σ
〈
0 20 40 60 80 100
{4}2c
-0.04 -0.02 0
10-3
×
data HIJING
HIJING, detector simulation ATLAS Internal
b-1
µ
int= 1 = 5.02 TeV, L sNN
p+Pb,
| < 2.5 η < 5 GeV, | 0.3 < pT
Fig. 2: The two-particle (upper plot) and four-particle (lower plot) cumulants calculated using the reference flow particles as a function of ΣETPbfor data (circles), the fully simulated HIJING events (open squares) and the large generator-level HIJING sample (filled squares). For clarity, the points for the fully simulated (generated) HIJING events are slightly shifted to the left (right).
250
Fig. 2 shows the two- and four-particle cumu-
251
lants, averaged over events in each event-activity
252
class defined in Table 1, as a function of ΣETPb. It
253
is observed that four-particle cumulants are neg-
254
ative only in a certain range of event activity.
255
This restricts subsequent analysis to events with
256
ΣETPb>25 GeV, for which the four-particle cumu-
257
lant in data is found to be less than zero by at least
258
two standard deviations (statistical errors only). It
259
was also checked that for these eventsc2{4} is un-
260
changed within errors for any high-multiplicity se-
261
lection. For example, definingN20 as the value of
262
Nchrec such that 20% of events have Nchrec < N20
263
(i.e. N20 is the 20th percentile), then selecting
264
Nchrec > N20 leaves c2{4} unchanged within errors.
265
And for ΣETPb > 25 GeV this holds for any per-
266
centile selection.
267
Fig. 2 also shows the cumulants calculated for
268
50 million HIJING-generated events, using the true
269
particle information only, as well as for one million
270
fully simulated and reconstructed HIJING events,
271
using the same methods as used for the data. The
272
ΣEPbT obtained from the HIJING sample is rescaled
273
to match that measured in the data. It should be
274
noted that the HIJING Monte Carlo model does
275
not contain any collective flow, and the only corre-
276
lations are those due to resonance decays, jet pro-
277
duction and momentum conservation. The values
278
of c2{2} for HIJING events are smaller than the
279
values obtained from the data, and there is no sig-
280
nificant difference between the HIJING results ob-
281
tained at the generator (“truth”) level and at the
282
reconstruction level. Forc2{4}, the HIJING events
283
at ΣEPbT ∼20 GeV show a negative value compa-
284
rable to the values seen in the data, indicating that
285
correlations from jets or momentum conservation
286
contribute significantly to v2{4} in events of low
287
multiplicity. For ΣETPb > 25 GeV the generator-
288
level HIJING sample’s values forc2{4}are also neg-
289
ative, but the magnitude is much smaller than in
290
the data or in HIJING events with smaller ΣETPb.
291
The size of the fully simulated HIJING event sam-
292
ple is too small to draw a definite conclusion about
293
the sign or magnitude ofc2{4}.
294
The systematic uncertainties onv2{2}andv2{4}
295
as a function ofpTand ΣETPbhave been evaluated
296
by varying several aspects of the analysis proce-
297
dure. Azimuthal-angle sine terms in the Fourier
298
expansion should be zero, but a non-zero contribu-
299
tion can arise due to detector biases. It was found
300
that the magnitude of the sine terms relative to
301
the cosine terms is negligible (below 1%) forv2{2}
302
measured as a function of pT, as well as for the
303
pT-integratedv2{2} and v2{4}. In the case of the
304
measurement of the pT-dependent v2{4}, the sys-
305
tematic uncertainty attributed to the residual sine
306
terms varies between 6% and 14% in the different
307
ΣEPbT intervals. Uncertainties related to the track-
308
ing are obtained from the differences between the
309
main results and those using tracking requirements
310
modified to be either more or less restrictive. They
311
are found to be negligible (below 0.2%) for v2{2}.
312
For the pT-dependent v2{4} they give a contribu-
313
tion of less than 6% to the systematic uncertainty,
314
and less than 1% for thepT-integratedv2{4}. In ad-
315
dition to varying the track quality requirements, an
316
uncertainty on the pTdependence of the efficiency
317
corrections is also taken into account, and found to
318
be below 1% for thev2{2}andv2{4}measurements.
319
The correction of the azimuthal-angle uniformity is
320
checked by comparing the results to those obtained
321
with all weights,wi, set equal to one. This change
322
leads to small relative differences, below 1%, for the
323
v2{2} measured as a function of pT, as well as for
324
the pT-integratedv2{2} and v2{4}. Up to 4% dif-
325
ferences are observed in the pT-dependent v2{4}.
326
All individual contributions to the systematic un-
327
certainty are added in quadrature and quoted as the
328
total systematic uncertainty. The total systematic
329
uncertainties are below 1% for the v2{2} measure-
330
ment. The v2{4}measurement precision is limited
331
by large statistical errors, whereas the systematic
332
uncertainties stay below 15% forv2{4}(pT) and be-
333
low 2% for thepT-integratedv2{4}.
334
4. Results
335
Fig. 3 shows the transverse momentum depen-
336
dence of v2{2} and v2{4} in four different classes
337
of the event activity, selected according to ΣETPb.
338
A significant second-order harmonic is observed.
339
v2{4} is systematically smaller than v2{2}, con-
340
sistent with the suppression of non-flow effects in
341
v2{4}. This difference is most pronounced at high
342
pT and in collisions with low ΣETPb where jet-like
343
correlations not diluted by the underlying event can
344
contribute significantly. Thus, v2{4} appears to
345
provide a more reliable estimate of the second-order
346
anisotropy parameter of collective flow. As a func-
347
tion of transverse momentum the second-order har-
348
monic,v2{4}, increases withpTup topT≈2 GeV.
349
Large statistical errors preclude a definite conclu-
350
sion about the pT dependence of v2{4} at higher
351
transverse momenta.
352
The shape and magnitude of thepT-dependence
353
of v2{4} is found to be similar to that observed
354
in p+Pb collisions using two-particle correlations
355
[2, 3]. The second-order harmonic, v2, can be ex-
356
tracted from two-particle azimuthal correlations us-
357
ing charged particle pairs with a large pseudorapid-
358
ity gap to suppress the short-range correlations on
359
the near-side (∆φ∼0) [3, 22]. However, the two-
360
particle correlation measured this way may still be
361
1 2 3 4 5
2v
0 0.1 0.2 0.3
> 80 GeV
T
EPb
Σ ATLAS
=5.02 TeV sNN
p+Pb
| < 2.5 η
-1, | µb
int= 1 L
1 2 3 4 5
0 0.1 0.2 0.3
< 80 GeV
T
EPb
Σ 55 <
2{2}
v
2{4}
v {2PC}
v2
1 2 3 4 5
0 0.1 0.2 0.3
< 55 GeV
T
EPb
Σ 40 <
[GeV]
pT
1 2 3 4 5
2v
0 0.1 0.2 0.3
< 40 GeV
T
EPb
Σ 25 <
Fig. 3: The second-order harmonic calculated with the two-particle (circles) and four-particle (stars) cumulants as a function of transverse momentum in four different activity intervals. Bars denote statistical errors; systematic uncertainties are shown as shaded bands. Thev2derived from the Fourier decomposition of two-particle correlations [3] is shown by squares.
affected by the dijet correlations on the away-side
362
(∆φ ∼ π), which can span a large range in ∆η.
363
In Ref. [3], the away-side non-flow correlation is
364
estimated using the yield measured in the lowest
365
ΣEPbT collisions and is then subtracted from the
366
higher ΣETPb collisions. The result of that study,
367
v2{2P C}, is shown in Fig. 3 for the four activ-
368
ity intervals with largest ΣETPb, and compared to
369
v2{4}. Good agreement is observed betweenv2{4}
370
andv2{2P C} for collisions with ΣETPb>55 GeV.
371
For ΣETPb < 55 GeV, the disagreement could be
372
due either to the subtraction procedure used to ob-
373
tainv2{2P C}or to non-flow effects in v2{4}, or to
374
a combination.
375
The dependence on the collision activity of the
376
second-order harmonic, integrated over 0.3< pT<
377
5 GeV, is shown in Fig. 4. The large magni-
378
tude of v2{2} compared to v2{4} suggests a sub-
379
stantial contamination from non-flow correlations.
380
The value ofv2{4}is approximately 0.06, with lit-
381
tle dependence on the overall event activity for
382
ΣEPbT >25 GeV. The extracted values of v2{4}
383
are also compared to thev2{2P C} values obtained
384
from two-particle correlations. Good agreement is
385
observed at large ΣETPb, while at lower ΣEPbT the
386
v2{2P C} is smaller thanv2{4}, which may be due
387
to different sensitivity of the two methods to non-
388
flow contributions that become more important in
389
low ΣEPbT collisions. Althoughv2{4}is constructed
390
to suppress local two-particle correlations, it may
391
still include true multi-particle correlations from
392
jets, which should account for a larger fraction of
393
the correlated particle production in the events with
394
[GeV]
T〉 EPb
Σ
〈
20 40 60 80 100 120
2v
0 0.05 0.1
2{2}
v
2{4}
v {2PC}
v2
hydro
2{2}
v ATLAS
b-1
µ
int= 1 = 5.02 TeV, L sNN
p+Pb,
< 5 GeV 0.3 < pT
| < 2.5 η
|
2{2}
v
2{4}
v {2PC}
v2
hydro
2{2}
v
Fig. 4: The second-order harmonic, v2, integrated overpT
andη, calculated with two- and four-particle cumulants (cir- cles and stars, respectively), as a function of ΣETPb. System- atic uncertainties are shown as shaded bands. Also shown is v2{2P C}(squares) and predictions from the hydrodynamic model [18] (triangles) for the same selection of charged par- ticles as in the data.
the lowest ΣETPb. If the HIJING results, shown in
395
Fig. 2, were used to correct the measured cumulants
396
for this non-flow contribution, the extracted v2{4}
397
would be decreased by at most 10% forv2{4}shown
398
in Fig. 4. However, this correction is not applied to
399
the final results.
400
It is notable that the trend of the pT depen-
401
dence of both v2{4} and v2{2P C} in p+Pb col-
402
lisions resembles that observed for v2 measured
403
with the event-plane method in Pb+Pb collisions
404