Measurement of Dijet Azimuthal Decorrelations in pp Collisions at √
s = 7 TeV
The ATLAS Collaboration
Azimuthal decorrelations between the two central jets with the largest transverse momenta are sensitive to the dynamics of events with multiple jets. We present a measurement of the normalized differential cross section based on the full dataset ( R
L dt = 36 pb
−1) acquired by the ATLAS detector during the 2010 √ s = 7 TeV proton-proton run of the LHC. The measured distributions include jets with transverse momenta up to 1.3 TeV, probing perturbative QCD in a high energy regime.
PACS numbers: 13.87.Ce,12.38.Qk
The production of events containing high transverse- momentum (p T ) jets is a key signature of quantum chro- modynamic (QCD) interactions between partons in pp collisions at large center-of-mass energies ( √
s). The Large Hadron Collider (LHC) opens a window into the dynamics of interactions with high-p T jets in a new en- ergy regime of √
s = 7 TeV. QCD predicts the decorre- lation in the azimuthal angle between the two most en- ergetic jets, ∆φ, as a function of the number of partons produced. Events with only two high-p T jets have small azimuthal decorrelations, ∆φ ∼ π, while ∆φ << π is evi- dence of events with several high-p T jets. QCD also de- scribes the evolution of the shape of the ∆φ distribution, which narrows with increasing leading jet p T . Distri- butions in ∆φ therefore test perturbative QCD (pQCD) calculations for multiple jet production without requir- ing the measurement of additional jets. Furthermore, a detailed understanding of events with large azimuthal decorrelations is important to searches for new physical phenomena with dijet signatures, such as supersymmet- ric extensions to the Standard Model [1].
In this Letter, we present a measurement of dijet az- imuthal decorrelations with jet p T up to 1.3 TeV as mea- sured by the ATLAS detector, beyond the reach of pre- vious colliders. The normalized differential cross sec- tion (1/σ)(dσ/d∆φ) is based upon an integrated lumi- nosity R
L dt = (36 ± 4) pb
−1 [2]. The ∆φ distribution is normalized by the inclusive dijet cross section, σ, inte- grated over the same phase space. This construction min- imizes experimental and theoretical uncertainties. Pre- vious measurements of ∆φ from the D0 [3] and CMS [4]
collaborations are extended here to higher jet p T values.
Jets are reconstructed using the anti-k t algorithm [5]
(implemented with FASTJET [6]) with radius R = 0.6, and the jet four-momenta are constructed from a sum over its constituents, treating each as an (E, ~ p) four- vector with zero mass. The anti-k t algorithm is well- motivated since it is infrared-safe to all orders, pro- duces geometrically well-defined cone-like jets, and is used for pQCD calculations (from partons), event gen- erators (from stable particles), and the detector (from energy clusters [7]). The azimuthal decorrelation, ∆φ, is defined as the absolute value of the difference in az- imuthal angle between the jet with the highest p T in each
event, p max T , and the jet with the second-highest p T in the event. There are nine analysis regions in p max T , where the lowest region is bounded by p max T > 110 GeV and the highest region requires p max T > 800 GeV [7]. Only jets with p T > 100 GeV and | y | < 2.8, where y is the jet ra- pidity [8], are considered. The two leading jets that define
∆φ are required to satisfy | y | < 0.8, restricting the mea- surement to a central y region where the momentum frac- tions (x) of the interacting partons are roughly equal and the experimental acceptance for multijet production is in- creased. In this region where 0.02 . x . 0.14, the parton distribution function (PDF) uncertainties are typically
± 3% (at fixed factorization scale) [9]. The cross sec- tions, measured over the range π/2 ≤ ∆φ ≤ π and nor- malized independently for each analysis region, are com- pared with expectations from a pQCD calculation [10]
that is next-to-leading order (NLO) in three-parton pro- duction. The perturbative prediction for the cross section is O (α 4
s), where α
sis the strong coupling constant.
The angular decorrelation is sensitive to multijet con- figurations such as those produced by event generators like SHERPA [11], which matches higher-order tree-level pQCD diagrams with a dipole parton-shower model [12].
Samples for 2 → 2 − 6 jet production are combined using an improved CKKW matching scheme [13]. The progres- sion of the parton shower is vetoed to avoid double count- ing of emissions. Event generators such as PYTHIA [14]
and HERWIG [15] use 2 → 2 leading order pQCD matrix elements matched with phenomenological parton-cascade models to simulate higher-order QCD effects. Such mod- els have been successful at reproducing other QCD pro- cesses measured by the ATLAS collaboration [7, 16].
The ATLAS detector [17, 18] consists of an inner
tracking system surrounded by a thin superconducting
solenoid providing a 2T magnetic field, electromagnetic
and hadronic calorimeters, and a muon spectrometer
based on large superconducting toroids. Jet measure-
ments depend most heavily on the calorimeters. The
electromagnetic calorimeter is a lead liquid-argon (LAr)
detector with an accordion geometry. Hadron calorime-
try is based on two different detector technologies, with
scintillator tiles or LAr as the active medium, and with
either steel, copper, or tungsten as the absorber mate-
rial. The pseudorapidity (η) [8] and φ segmentations of
[radians]
φ /2 ∆
π 2 π /3 5 π /6 π
Number of Events
1 10 10 2
10 3
10 4
10 5
jets R=0.6 anti-k
t|<2.8 y
>100 GeV | p
T|<0.8 y Leading two jets: |
>110 GeV
max
p
T=36 pb
-1dt
∫ L Data
2 jets
≥ 3 jets
≥ 4 jets
≥ 5 jets
≥ PYTHIA
ATLAS s =7 TeV
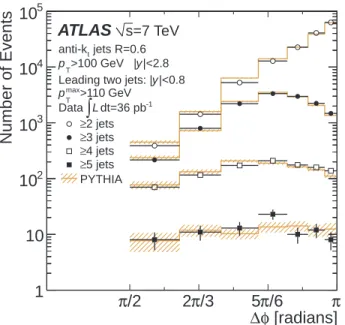
FIG. 1. The ∆φ distribution for ≥ 2, ≥ 3, ≥ 4, and ≥ 5 jets with p
T> 100 GeV. Overlaid on the calibrated but otherwise uncorrected data (points) are results from PYTHIA processed through the detector simulation (lines). All uncertainties are statistical only.
the calorimeters are sufficiently fine to ensure that an- gular resolution uncertainties are negligible compared to other sources of systematic uncertainty.
A hardware-based calorimeter jet trigger identified events of interest; the decision was further refined in software [17, 18]. Events with at least one jet that satis- fied a minimum transverse energy (E T ) requirement were recorded for further analysis. The events in each p max T range are selected by a single trigger with a given E T
threshold, and the lower end of the range is chosen above the jet p T at which that trigger is ≈ 100% efficient. Three sets of triggered events with different integrated luminos- ity are considered: 2.3 pb
−1 for 110 < p max T ≤ 160 GeV, 9.6 pb
−1 for 160 < p max T ≤ 260 GeV, and 36 pb
−1 for p max T > 260 GeV [2]. Events are also required to have a reconstructed primary vertex within 15 cm in z of the center of the detector; each vertex had ≥ 5 asso- ciated tracks. The inputs to the anti-k t jet algorithm are clusters of calorimeter cells seeded by cells with en- ergy that is significantly above the measured noise [7].
Jets reconstructed in the detector, whether in data or the GEANT4-based simulation [19, 20], are corrected for the effects of hadronic shower response and detector-material distributions using a p T - and η-dependent calibration [7]
based on the detector simulation and validated with ex- tensive test-beam [17] and collision data [21] studies. Jets likely to have arisen from detector noise or cosmic rays are rejected [22].
The resulting ∆φ distribution is shown in Fig. 1 for jets with p T > 100 GeV. There are 146788 events in
[radians]
φ /2 ∆
π 2 π /3 5 π /6 π ] -1 [radians φ∆ /d σ d σ 1/
10 -3
10 -2
10 -1
1 10 10 2
10 3
10 4
10 5
10 6
10 7
10 8
10 9
=36 pb
-1dt
∫ L Data
8
)
× 10 800 GeV (
max
>
p
T7
)
× 10 800 GeV (
≤
max
p
T<
600
6
)
× 10 600 GeV (
≤
max
p
T<
500
5
)
× 10 500 GeV (
≤
max
p
T<
400
4
)
× 10 400 GeV (
≤
max
p
T<
310
3
)
× 10 310 GeV (
≤
max
p
T<
260
2
)
× 10 260 GeV (
≤
max
p
T<
210
1
)
× 10 210 GeV (
≤
max
p
T<
160
0
)
× 10 160 GeV (
≤
max
p
T<
110
4
) α
sO(
NLO pQCD unc.
α
sPDF &
scale unc.
ATLAS s =7 TeV
|<0.8 y
>100 GeV | p
Tjets R=0.6 anti-k
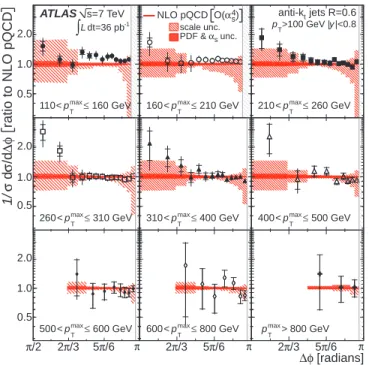
tFIG. 2. The differential cross section (1/σ)(dσ/d∆φ) binned in nine p
maxTregions. Overlaid on the data (points) are re- sults from the NLO pQCD calculation. The error bars on the data points indicate the statistical (inner error bar) and systematic uncertainties added in quadrature in this and sub- sequent figures. The theory uncertainties are indicated by the hatched regions. Different bins in p
maxTare scaled by multi- plicative factors of ten for display purposes. The region near the divergence at ∆φ → π is excluded from the calculation.
the data sample, 85 of which have at least five jets with p T > 100 GeV. Also shown is the PYTHIA sample with MRST 2007 LO
∗PDF [23] and ATLAS MC09 underly- ing event tune [24], processed through the full detector simulation and normalized to the number of events in the data sample. Two- and three-jet production primar- ily populates the region 2π/3 < ∆φ < π while smaller values of ∆φ require additional activity such as soft radi- ation or more jets in an event. Fig. 1 illustrates that the decorrelation increases when a third high-p T jet is also required. Events with additional high-p T jets widen the overall distribution.
The measured differential ∆φ distributions in data are corrected in a single step with a bin-by-bin unfolding method [7] to compensate for trigger and detector ineffi- ciencies and the effects of finite experimental resolutions.
These correction factors, evaluated using the PYTHIA
sample, lie within ± 9% of unity. The leading sources
of systematic uncertainty on the normalized cross sec-
160 GeV
≤
max
pT
<
110
ATLAS
s=7 TeV=36 pb-1
dt
∫
L310 GeV
≤
max
pT
<
260
π /2 2 π /3 5 π /6 π
600 GeV≤
max
pT
<
500
210 GeV
≤
max
pT
<
160
4) αs O(
NLO pQCD scale unc.
unc.
αs PDF &
400 GeV
≤
max
pT
<
310
π /3
2 5 π /6 π
800 GeV
≤
max
pT
<
600
260 GeV
≤
max
pT
<
210
jets R=0.6 anti-kt
|<0.8 y
>100 GeV | pT
500 GeV
≤
max
pT
<
400
[radians]
φ /3 ∆ π
2 5 π /6 π
800 GeV
max>
pT
ratio to NLO pQCD φ∆ /d σ d σ 1/
2.0 1.0 0.5
2.0 1.0 0.5
2.0 1.0 0.5
FIG. 3. Ratio of the differential cross section (1/σ)(dσ/d∆φ) measured in data with respect to expectations from NLO pQCD (points). The theory uncertainties are indicated by the hatched regions. The region near the divergence at ∆φ → π is excluded from the comparison.
tion are the jet energy scale calibration (2 − 17%) [7], the bin-by-bin unfolding method (1 − 19%), and the jet energy and position resolutions (0.5 − 5%). The ranges in parentheses represent the magnitude of the uncertain- ties near π and π/2, respectively, and correspond to the analysis region with the smallest statistical uncertainty (160 < p max T ≤ 210 GeV). Uncertainties due to multiple pp interactions in the same beam crossing (< 0.8% on the cross section for all analysis regions) are included in the evaluation of the jet energy scale uncertainties.
The normalized differential cross section is shown for each of the nine p max T analysis regions as a function of
∆φ in Fig. 2. As p max T increases, and the probability for the emission of a hard third jet is reduced, the frac- tion of events near π becomes larger. Overlaid on the data are the results from a NLO pQCD [ O (α 4
s)] calcu- lation, NLOJET++ [10] with fastNLO [25] and using the MSTW 2008 PDF [9]. The factorization and renor- malization scales are set to p max T and are varied inde- pendently up and down by a factor of two to determine the scale uncertainties. The scale uncertainties are larger between π/2 < ∆φ < 2π/3 where the pQCD calcula- tion is effectively leading order in four-parton produc- tion. The PDF uncertainties are treated as the enve- lope of the 68% CL uncertainties from MSTW 2008 [9], NNPDF 2.0 [26], and CTEQ 10 [27], and are combined with the uncertainties resulting from an α
svariation of
160 GeV
≤
max
pT
<
110
ATLAS
s=7 TeV=36 pb-1
dt
∫
L310 GeV
≤
max
pT
<
260
π /2 2 π /3 5 π /6 π
600 GeV≤
max
pT
<
500
210 GeV
≤
max
pT
<
160 PYTHIA HERWIG SHERPA stat. unc.
400 GeV
≤
max
pT
<
310
π /3
2 5 π /6 π
800 GeV
≤
max
pT
<
600
260 GeV
≤
max
pT
<
210
jets R=0.6 anti-kt
|<0.8 y
>100 GeV | pT
500 GeV
≤
max
pT
<
400
[radians]
φ /3 ∆ π
2 5 π /6 π
800 GeV
max>
pT
ra ti o t o S H E R P A φ∆ /d σ d σ 1/
2.0 1.0 0.5
2.0 1.0 0.5
2.0 1.0 0.5