ATLAS-CONF-2018-017 02June2018
ATLAS CONF Note
ATLAS-CONF-2018-017
1st June 2018
Search for a new heavy gauge boson resonance decaying into a lepton and missing transverse
momentum in 79.8 fb √ − 1 of p p collisions at s = 13 TeV with the ATLAS experiment
The ATLAS Collaboration
The results of a search for a new heavy, chargedW0boson decaying into an electron or muon and a neutrino using proton-proton collision data at a centre-of-mass energy of
√s=13 TeV are presented. The data were collected in 2015, 2016 and 2017 by the ATLAS experiment at the Large Hadron Collider and correspond to an integrated luminosity of 79.8 fb−1. As no excess of events above the Standard Model prediction is observed, the results are used to set upper limits on theW0boson cross-section times branching ratio to an electron or muon and a neutrino as a function of theW0mass. Assuming aW0boson with the same couplings as the Standard ModelW boson,W0masses below 5.6 TeV are excluded at the 95% confidence level.
© 2018 CERN for the benefit of the ATLAS Collaboration.
1 Introduction
Extensions to the Standard Model (SM) may include heavy gauge bosons that could be discovered at the Large Hadron Collider (LHC) [1]. For example, heavy gauge bosons are predicted in left-right symmetric models [2,3] or in the little Higgs model [4]. Conceptually, these particles are heavier versions of the SM W and Z bosons and are generically referred to asW0and Z0 bosons. The Sequential Standard Model (SSM) [5] posits aW0
SSMboson with couplings to fermions that are identical to those of the SMWboson.
This model represents a good benchmark as the results can be interpreted in the context of other models of new physics, and is useful for comparing the sensitivity of different experiments.
This note presents a search for aW0 boson conducted in theW0 → `ν channel. In the following, the termlepton(`) is used to refer to an electron or a muon. The analysis uses events with a high transverse momentum1 (pT) lepton and significant missing transverse momentum Emiss
T , that is used to infer the presence of the neutrino in the event as it escapes direct detection. It is based on 79.8 fb−1ofppcollision data collected with the ATLAS detector in 2015 (3.2 fb−1), 2016 (33.0 fb−1) and 2017 (43.6 fb−1) at a centre-of-mass energy of
√s=13 TeV. The results are interpreted in the context of the SSM. The signal discriminant is the transverse mass, which is defined asmT =√
2pTEmiss
T (1−cosφ`ν), whereφ`ν is the azimuthal angle between the directions of the leptonpTand theEmiss
T in the transverse plane.
The most stringent limits on the mass of aW0
SSMboson to date come from the searches in theW0→eνand W0→ µνchannels by the ATLAS and CMS collaborations using data taken at
√s =13 TeV in 2015 and 2016. The ATLAS analysis was based on data corresponding to an integrated luminosity of 36.1 fb−1and sets a 95% confidence level (CL) lower limit on theW0
SSMmass of 5.1 TeV [6]. A search in theW0→τν channel based on the same dataset excludes at 95% CLW0
SSM masses only up to 3.7 TeV [7]. The CMS Collaboration used 35.9 fb−1of data and excludesW0
SSMmasses below 5.2 TeV at 95% CL [8]. While the present analysis follows closely the same procedure as in Ref. [6], the sensitivity of the search presented here is improved due to the inclusion of the 2017 dataset.
2 ATLAS detector
The ATLAS experiment [9] at the LHC is a multipurpose particle detector with a forward-backward symmetric cylindrical geometry and a near 4πcoverage in solid angle. It consists of an inner detector (ID) for tracking surrounded by a thin superconducting solenoid providing a 2 T axial magnetic field, electromagnetic (EM) and hadronic calorimeters, and a muon spectrometer (MS). The ID covers the pseudorapidity range |η| < 2.5. It consists of a silicon pixel detector, including an additional inner layer located at a radius of 3.2 cm since 2015 [10], and silicon microstrip and transition radiation tracking detectors. Lead/liquid-argon (LAr) sampling calorimeters provide EM energy measurements with high granularity. A hadronic (steel/scintillator-tile) calorimeter covers the central pseudorapidity range (|η| < 1.7). The end-cap and forward regions are instrumented with LAr calorimeters for both the EM and hadronic energy measurements up to |η| = 4.9. The muon spectrometer surrounds the calorimeters and incorporates three large air-core toroidal superconducting magnets with eight coils each.
1ATLAS uses a right-handed coordinate system with its origin at the nominal interaction point (IP) in the centre of the detector and thez-axis along the beam pipe. The x-axis points from the IP to the centre of the LHC ring, and the y-axis points upward. Cylindrical coordinates(r, φ)are used in the transverse plane,φbeing the azimuthal angle around thez-axis. The pseudorapidity is defined in terms of the polar angleθasη=−ln tan(θ/2). Transverse momentum (pT) is defined relative to the beam axis and is calculated aspT=psin(θ)wherepis the momentum.
The field integral experienced by tracks in the toroidal field ranges between 2.0 and 6.0 T m for most pseudorapidities. The MS includes a system of precision tracking chambers, over |η| < 2.7, and fast detectors for triggering, over |η| < 2.4. A two-level trigger system is used to select events [11]. The first-level trigger is implemented in hardware and uses a subset of the detector information. This is followed by a software-based trigger system that reduces the accepted event rate to less than 1 kHz.
3 Analysis strategy and modelling of signal and background processes
A high massW0 signal would appear as an excess of events above the SM background at highmT. The SM background mainly arises from processes with at least one prompt final-state lepton, with the largest source being the charged-current Drell-Yan (DY)Wboson production, where theWboson decays into an electron or muon and a neutrino. The second largest source is top-quark pair (tt¯) and single-top-quark production, denoted in the following as “top-quark background”. Other non-negligible contributions are from the neutral-current DY (Z/γ∗) process, diboson production, as well as from events in which one final-state jet or photon satisfies the lepton selection criteria. This last component of the background, referred to in the following as the multijet background, receives contributions from multijet, heavy-flavour quark andγ+ jet production. The multijet background is determined using a data-driven method, while the other backgrounds are modelled by Monte Carlo (MC) simulations.
The backgrounds from W → `ν, Z/γ∗ → ``, W → τν, and Z/γ∗ → ττ were simulated using the Powheg-Box v2 [12] matrix-element calculation up to next-to-leading order (NLO) in perturbative quantum chromodynamics (pQCD), interfaced to the Pythia 8.186 [13] parton shower model and using the CT10 parton distribution function (PDF) set [14]. The final-state photon radiation (QED FSR) was modelled by the Photos [15] MC simulation. The samples are normalised as a function of the boson invariant mass to a next-to-next-to-leading order (NNLO) pQCD calculation using the numerical programme VRAP which is based on Ref. [16] and the CT14NNLO PDF set [17]. Compared to the NLO prediction using CT10, the NNLO prediction using CT14 gives a higher cross-section by about 5% at a boson invariant mass of 1 TeV and 10% at 5 TeV. In addition to the modelling of QED FSR, a fixed-order electroweak (EW) correction to NLO is calculated as a function of the boson mass with the Mcsanc [18,19] event generator at leading order (LO) in pQCD. This correction is added to the NNLO QCD cross-section prediction in the so-called additive approach (see Section6.2) because of a lack of calculations of mixed QCD and EW terms, and lowers the predicted cross-section by an increasing amount as function of the mass, reaching about 10% at 1 TeV and 20% at 5 TeV. TheW →`ν andZ/γ∗ →``
events were simulated as multiple samples covering different ranges of the boson invariant mass. This ensures that a large number of MC events is available across the entiremTregion probed in this analysis.
The background fromtt¯production was generated using Powheg-Box v2, with parton showering, hadro- nisation and underlying event modelled by Pythia 8.230 [20], using the NNPDF [21] PDF set and the A14 [22] tune2. Thet¯tcross-section is normalised toσtt¯= 832 pb as calculated with the Top++2.0 program at NNLO in pQCD, including soft-gluon resummation to next-to-next-to-leading logarithmic accuracy (see Ref. [23] and references therein). The top-quark mass is set to 172.5 GeV. The single-top-quark production in the EWt-channel was simulated using the same event generators and PDF sets as for the tt¯ process, while the W t channel was generated with Powheg-Box v1 interfaced with Pythia 6.428 using the CT10 PDF set. Diboson events were simulated with the Sherpa 2.2 [24] event generator using
2The termtunerefers to a specific setting of configurable parameters of the MC generator describing non-perturbative QCD effects. A tune variation can be used to assess the effect of the modelling of non-perturbative effects on an analysis.
the NNPDF3.0 NNLO PDF set [39]. As the simulated top-quark and diboson samples are statistically limited at largemT, the expected number of events from each of these backgrounds is extrapolated into the high-mT region. This is achieved by fitting the lower part of themTdistributions to functions of the form F(mT) =a mb+clogmT
T andF(mT)= d/(mT+e)gand using the fitted function to predict the background at highermT. Various fit ranges are used, which typically start between 300 and 500 GeV and extend up to 800 to 2000 GeV. The fits with the best χ2/d.o.f. are used for the extrapolation and the results of these fits are used in the high-mTtail.
The multijet background is estimated from data using the same data-drivenmatrix methodas used in the previous ATLAS analysis [6]. The first step of the matrix method is to calculate the fraction f of lepton candidates that pass the nominal lepton identification and isolation requirements (tight), with respect to a sample oflooselepton candidates in a background-enriched sample. These loosely selected candidates satisfy only a subset of the nominal criteria, which is stricter than the trigger requirements imposed.
Potential contamination of prompt leptons in the background-enriched sample is accounted for using MC simulation. In addition, the fractionr of real leptons in the sample of loosecandidates satisfying the nominal requirements is used. This fraction is computed from MC simulation. The number of jets and photons misidentified as leptons (Nmultijet
T ) in the total number of candidates passing the signal selection (NT) is
Nmultijet
T = f NF= f r− f
r(NL+NT)−NT
, (1)
whereNFis the number of fake leptons and NL corresponds to leptons that pass thelooserequirements but fail the nominal requirements. As this background estimate is statistically limited at large mT, the expected number of events is extrapolated into the high-mT region using a method similar to that for the diboson and top-quark backgrounds.
The SSM signalW0 →eνandW0→ µνsamples were generated at LO in QCD using the Pythia 8.183 event generator and the NNPDF2.3 LO PDF set [21]. As assumed in the SSM, the couplings to fermions are equal to those of the SMW boson. The W0 boson is assumed not to couple to the SM W and Z bosons and interference between theW0and the SMW boson production amplitudes is neglected. The decayW0 →τν, where theτsubsequently decays leptonically, is not treated as part of the signal as this contribution was quantified previously and found to give a negligible contribution to the sensitivity [25].
Mass-dependent correction factors are applied to normalise the samples to the same mass-dependent NNLO pQCD calculation as used for theWbackground. Compared to the LO prediction using NNPDF2.3 LO, the corrections increase the cross-section by about 40% around a boson invariant mass of 1–2 TeV, and by about 10% at 5 TeV. Further EW corrections beyond QED FSR are not considered for the signal.
The resulting cross-sections times branching ratio forW0
SSMmasses of 3, 4 and 5 TeV are 15.3, 2.25 and 0.51 fb, respectively. For theseW0 masses the branching ratio to each lepton generation from Pythia is 8.2%.
The MC samples were processed through a simulation of the detector geometry and response [26] using the Geant4 [27] framework. The software used for the reconstruction is the same for both simulated and real data. The effect of additionalppcollisions in the same or a nearby bunch crossing as the primary interaction (pile-up) is modelled by overlaying simulated inelasticppcollision events selected using very loose trigger requirements (minimum bias). All MC samples are reweighted so that the distribution of the number of collisions per bunch crossing matches the data. Correction factors to account for differences observed in the detector response between data and simulation are applied to the lepton trigger, reconstruction, identification [28,29] and isolation efficiencies as well as the lepton energy/momentum resolutions and scales [29,30].
4 Event reconstruction
The analysis makes use of electrons, muons, and missing transverse momentum, whose reconstruction and identification are explained in the following. The 2015 and 2016 datasets have for the present analysis been reprocessed using a new software release implementing several improvements in the reconstruction compared to that used for Ref. [6], including an improved treatment of relative misalignments between the ID and the MS in the muon reconstruction.
Electrons are reconstructed from ID tracks that are matched to energy clusters in the electromagnetic calorimeter obtained using a sliding-window algorithm in the range |η| < 2.47. Candidates in the transition region between different electromagnetic calorimeter components, 1.37 < |η| < 1.52, are rejected. Electrons must satisfy identification criteria based on measurements of shower shapes in the calorimeter and measurements of track properties from the ID combined in a likelihood discriminant.
Depending on the desired level of background rejection, loose, medium and tight working points are defined. They are also required to be isolated and fulfil the track and calorimeter-basedlooseisolation criteria which are optimised for an overall efficiency of 98%. Full details of the electron reconstruction, identification and selection working points can be found in Ref. [28].
Muon candidates are identified from MS tracks that match tracks in the ID, with|η| < 2.5 [29]. These muons are required to pass a track quality selection based on the number of hits in the ID. They are rejected if the charge-to-momentum uncertainty divided by the charge-to-momentum value (σ(q/p)/(q/p)) is large.
This will veto muons in regions in which the ID and the MS are not well aligned relative to one another.
To ensure optimal muon resolution at highpT, additional requirements are imposed on the quality of the MS track. The track is required to have at least three hits in each of the three separate layers of MS chambers. Furthermore, to avoidpT mismeasurements, muons are removed if they cross poorly aligned MS chambers. Muons are also required to satisfy the track-basedLooseTrackOnlyisolation working point [29], which has an efficiency of around 99%.
The ID tracks associated with electron and muon candidates are required to be consistent with originating from the primary interaction vertex, which is defined as the vertex whose constituent tracks have the highest sum ofp2
T. The transverse impact parameter with respect to the beam line,d0, divided by its estimated uncertainty must satisfy|d0|/σ(d0) < 5(3) for electrons (muons). For muons, the longitudinal impact parameter, which is the distance between thez-position of the point of closest approach of the muon track in the ID to the beamline and thez-coordinate of the primary vertex, must fulfil|∆z0| ×sinθ <0.5 mm.
The missing transverse momentum is reconstructed as the negative vectorial sum of the calibrated momenta of electrons, muons and jets, where the electrons and muons are required to satisfy the selection criteria described above [31]. The jets used in the calculation are reconstructed in the region |η| < 4.9 from topological clusters [32] in the calorimeter using the anti-ktalgorithm [33] with a radius parameter of 0.4.
They are calibrated using the method described in Ref. [34] and are required to have pT > 20 GeV for
|η| < 2.4 andpT > 30 GeV for|η| > 2.4. The computation ofEmiss
T also includes tracks associated with the primary vertex from activity not associated with electrons, muons or jets.
5 Event selection and background estimation
Events in the muon channel were recorded by a trigger requiring that at least one muon withpT >50 GeV is found. These muons must be reconstructed in both the MS and the ID. In the electron channel during
Events
1
10−
1 10 102
103
104
105
106
= 13 TeV, 79.8 fb-1
s
Data W Top quark Multijet
* Z/γ Diboson W’ (3 TeV)
W’ (4 TeV) W’ (5 TeV) Preliminary
ATLAS
selection eν W’ →
Data / Bkg 0.60.811.21.4
Transverse mass [GeV]
400 1000 2000 3000
(post-fit)Data / Bkg 0.60.811.21.4
(a)
Events
1
10−
1 10 102
103
104
105
106
= 13 TeV, 79.8 fb-1
s
Data W Top quark
* Z/γ Diboson Multijet W’ (3 TeV)
W’ (4 TeV) W’ (5 TeV) Preliminary
ATLAS
selection ν µ W’ →
Data / Bkg 0.60.811.21.4
Transverse mass [GeV]
400 1000 2000 3000
(post-fit)Data / Bkg 0.60.811.21.4
(b)
Figure 1: Transverse mass distributions for events satisfying all selection criteria in the (a) electron and (b) muon channels. The distributions in data are compared to the stacked sum of all expected backgrounds. As examples, expected signal distributions for three different SSMW0boson masses are shown on top of the SM prediction. The bin width is constant in log(mT). The middle panels show the ratios of the data to the expected background, with vertical bars representing both data and MC statistical uncertainties. The lower panels show the ratios of the data to the adjusted expected background (post-fit) that results from the statistical analysis. The bands in the ratio plots indicate the total systematic uncertainty from the sources discussed in Section6, including the integrated luminosity.
the 2015 (2016, 2017) data-taking period, events were recorded by a trigger requiring at least one electron with pT > 24 (60) GeV which satisfied themediumidentification criteria, or at least one electron with pT > 120 (140) GeV which satisfied the loose identification criteria. The identification criteria for electrons at trigger level are similar to those used in the offline reconstruction [28].
Events recorded by the trigger are further selected by requiring that they contain exactly one lepton. In the muon channel, the magnitude ofEmiss
T must exceed 55 GeV and the muon has to fulfil the tight requirements for high-pTmuons detailed in Section4and havepT >55 GeV. In the electron channel, the electron must satisfy thetightidentification criteria, and the electronpT and the magnitude ofEmiss
T must both exceed 65 GeV. Events in both channels are vetoed if they contain additional leptons satisfying loosened selection criteria, namely electrons withpT > 20 GeV satisfying themediumidentification criteria or muons with pT > 20 GeV passing the muon selection without the stringent requirements on the MS track quality.
In addition, the transverse mass is required to exceed 300 GeV in both channels. A higher value of the transverse mass than in the previous analysis [6] is required because the region below 300 GeV is affected byEmiss
T -related modeling effects that require further study. The acceptance times efficiency, defined as the fraction of simulated signal events that pass the event selection described above, is 50% (44%) for the muon channel and 78% (71%) for the electron channel for aW0mass of 2 TeV (4 TeV). The difference in acceptance times efficiency between the two channels results from lower muon trigger efficiency and, due to the very strict muon selection criteria applied, a lower muon identification efficiency.
The expected number of background events is calculated as the sum of the data-driven and simulated
Table 1: The numbers of expected events from the total SM background and SSMW0 signal and the numbers of observed events in data in the electron (top) and muon (bottom) channels in bins of mT. The uncertainties given are the combined statistical and systematic uncertainties. The systematic uncertainty includes all systematic uncertainties except the one from the integrated luminosity (2%).
Electron channel
mT[GeV] 300–400 400–600 600–1000 1000–2000 2000–3000 3000–7000 Total SM 54400±2200 20200±1000 4190±280 480±50 12.3±2.4 0.9±0.8 W0(2 TeV) 148±12 418±31 1290±90 7100±500 670±190 1.83±0.18 W0(3 TeV) 16.0±1.0 34.0±2.0 74±5 263±20 510±40 50±16 W0(4 TeV) 4.26±0.14 7.56±0.33 12.8±0.7 26.0±2.0 29.0±2.0 50±4 W0(5 TeV) 1.68±0.05 2.87±0.12 4.18±0.22 5.7±0.4 3.37±0.24 8.0±0.6
Data 54844 20519 4239 470 9 0
Muon channel
mT[GeV] 300–400 400–600 600–1000 1000–2000 2000–3000 3000–7000 Total SM 40500±1600 14800±700 3100±170 339±26 10.2±1.5 1.29±0.32 W0(2 TeV) 121±5 343±15 960±40 3900±180 870±70 30±16 W0(3 TeV) 11.98±0.34 26.01±1.00 58.2±2.9 185±15 221±19 91±21 W0(4 TeV) 3.12±0.06 5.50±0.15 9.1±0.4 18.4±1.7 19.7±2.5 25±6 W0(5 TeV) 1.226±0.022 2.02±0.05 2.84±0.10 3.80±0.27 2.22±0.34 3.8±1.1
Data 41445 15111 3129 368 12 2
background estimates described in Section3. Figure1 displays themT distribution in the electron and muon channels. The expected and observed number of events for some widermTranges are shown also in Table1. For all values ofmT, the background is dominated byW →`νproduction, which constitutes about 85% of the total background at mT > 1 TeV. As examples, Figure 1 also shows the expected signal distributions for three assumedW0
SSM boson masses on top of the SM prediction. The effect of the momentum resolution is clearly visible when comparing the shapes of the three reconstructedW0
SSM
signals in the electron and muon channels. The middle panels of Figure1show the ratio of the data to the SM predictions. The bottom panels of Figure1show the ratio of the data to the adjusted background that results from a common fit to the electron and muon channels within the statistical analysis described in Section7. This ratio agrees well with unity.
6 Systematic uncertainties
The systematic uncertainties arise from experimental and theoretical sources. They are summarised in Table2and described in the following subsections.
6.1 Uncertainties from the reconstruction of electrons, muons, andEmiss
T
Experimental systematic uncertainties arise from the trigger, reconstruction, identification and isolation efficiencies for leptons [28,29], and the calculation of theEmiss
T [31]. They include also the effects of the energy and momentum scale and resolution uncertainties [29,30,34].
Table 2: Systematic uncertainties in the expected number of events as estimated for the total background and for signal with aW0
SSMmass of 2 (4) TeV. The uncertainty is estimated with the binning shown in Figure1atmT=2 (4) TeV for the background and in a three-bin window aroundmT=2 (4) TeV for the signal. Uncertainties that are not applicable are denoted “n/a”, and “negl.” means that the uncertainty is not included in the statistical analysis.
Sources of uncertainties not included in the table are neglected in the statistical analysis.
Source Electron channel Muon channel
Background Signal Background Signal
Trigger negl. (negl.) negl. (negl.) 1% (1%) 2% (2%)
Lepton reconstruction
negl. (negl.) negl. (negl.) 7% (21%) 5% (29%) and identification
Lepton momentum
4% (3%) 4% (3%) 3% (12%) 7% (10%)
scale and resolution
Multijet background 7% (113%) n/a (n/a) 1% (1%) n/a (n/a)
Top extrapolation 2% (5%) n/a (n/a) 3% (3%) n/a (n/a)
Top normalization <0.5% (<0.5%) n/a (n/a) <0.5% (<0.5%) n/a (n/a)
Diboson extrapolation 2% (9%) n/a (n/a) 3% (10%) n/a (n/a)
PDF choice for DY 1% (14%) n/a (n/a) <0.5% (<0.5%) n/a (n/a)
PDF variation for DY 8% (12%) n/a (n/a) 7% (11%) n/a (n/a)
EW corrections for DY 4% (5%) n/a (n/a) 4% (6%) n/a (n/a)
Luminosity 2% (1%) 2% (2%) 2% (2%) 2% (2%)
Total 13% (115%) 4% (4%) 12% (29%) 9% (31%)
The electron and muon offline reconstruction, identification and isolation efficiencies, and their respective uncertainties, are assessed up topT ≈100 GeV using leptonic decays ofZboson candidates found in data.
The ratio of the efficiency measured in data to that of the MC simulation is then used to correct the MC prediction [28,29]. For higher-pT electrons, an additional uncertainty of 1.5% is estimated for thetight identification working point. This uncertainty is based on the differences observed in the electron shower shapes in the EM calorimeters between data and MC simulation around theZ →eemass peak, which are propagated to the high-ETelectron sample. For the isolation efficiencies, an uncertainty of 2% and 5% is estimated for 150< pT < 500 GeV and above 500 GeV, respectively, usingZ/γ∗candidates in data. For the identification of high-pTmuons, the uncertainty is determined conservatively from simulation studies and amounts to 6–7% per TeV. This value is larger with respect to the previous analysis [6]. This is due to an improved treatment of the systematics for muons withpT >200 GeV, which is determined from data to MC comparisons. Misalignment leads to mismodelling of theσ(q/p)/(q/p)value used to reject poorly measured muons and this effect is determined using simulations which assume a perfectly aligned muon detector. For the isolation criterion, the uncertainty associated with the extrapolation to high-pTmuons is estimated to be 1%. Systematic uncertainties related to the electron trigger are negligible. For the muon trigger the systematic uncertainty is estimated using the same methodology as in Ref. [35], which results in an overall uncertainty of about 2%.
The main systematic uncertainties inEmiss
T arise from the jet energy resolution uncertainties [34] and the contribution from tracks originating from the primary vertex and arising from activity not associated with electrons, muons or jets [31]. The uncertainties due to the jet energy and Emiss
T resolutions are small in themT region considered in the analysis, and are therefore neglected. Similarly, the jet energy scale
uncertainties are found to be negligible.
6.2 Theoretical uncertainties
Theoretical uncertainties are related to the production cross-sections estimated from MC simulation. The effects when propagated to the total background estimate are significant for W and Z/γ∗ production, and to some extent for top-quark production, but are negligible for diboson production. No theoretical uncertainties are considered for theW0boson signal in the statistical analysis.
Theoretical uncertainties in theWandZ/γ∗background prediction arise from the PDF uncertainties, the value of the strong coupling constantαs, and higher-order corrections.
The dominant effect comes from the PDF uncertainty, which is obtained from the 90% CL CT14NNLO PDF uncertainty set using VRAP to calculate the NNLO cross-section as a function of the boson mass.
Rather than using the original 28 CT14 uncertainty eigenvectors, a re-diagonalised set of seven PDF eigenvectors, as provided by the authors of the CT14 PDF using MP4LHC [36,37], is used. The cross- section variation associated with each of these eigenvectors has a characteristic mass dependence and the sum in quadrature of these eigenvector variations matches the original CT14NNLO uncertainty envelope well. This sum is shown as “PDF variation” in Table2. An additional uncertainty is derived to account for the choice of the nominal PDF set used. The central values of the CT14NNLO PDF set are compared to the MMHT2014 [38] and NNPDF3.0 [39] PDF sets. A comparison between these PDF sets shows that the central value for NNPDF3.0 falls outside the “PDF variation” uncertainty at large mT. Thus, an envelope of the “PDF variation” and the NNPDF3.0 central value is formed, where the former is subtracted in quadrature from this envelope, and the remaining part, which is non-zero only when the NNPDF3.0 central value is outside the “PDF variation” uncertainty, is quoted as “PDF choice”. The PDF uncertainties are the same at the generator level for the electron and muon channels, but result in different uncertainties at reconstruction level. The uncertainty is larger in the electron channel due to the better energy resolution: there is less migration of events with low generator-level invariant mass, where the PDF uncertainty is smaller, into the high-mTregion in this channel.
Uncertainties in the electroweak corrections are determined as the difference between the additive approach (1+δEW+ δQCD) and a factorised approach ((1+δEW) ×(1+δQCD)) for the EW corrections in the combination of higher-order EW (δEW) and QCD (δQCD) effects. Uncertainties due to higher-order QCD corrections on the Z/γ∗ process are estimated by varying the renormalisation and factorisation scales simultaneously up or down by a factor of two. The uncertainty due toαsis assessed by changing the value ofαsby as much as 0.003 from the nominal value αs(mZ) = 0.118 used by the CT14NNLO PDF set.
The uncertainties from the scales andαsare both found to be negligible.
Theoretical uncertainties are also considered for the top-quark and diboson backgrounds. An uncertainty in thet¯tcross-section of+20−29pb arises from the independent variation of the factorisation and renormalisation scales, while an uncertainty of±35 pb is associated with variations in the PDF and αs, following the PDF4LHC prescription (see Ref. [40] and references therein) with the MSTW2008 68% CL NNLO [41], CT10 NNLO [42] and NNPDF2.3 NNLO [21] PDF sets. For the diboson background, the theoretical normalisation uncertainty is conservatively taken to be 30%, and this has a negligible effect due to the small contribution of this background.
6.3 Background modelling uncertainties
The dominant systematic uncertainties in the multijet, top-quark and diboson backgrounds at highmTare due to the extrapolations. These uncertainties are evaluated by varying both the functional form of the fit functions and the fit range as detailed in Section3. The envelope of all variations is assigned for the uncertainty. This is a dominant source of background-related systematic uncertainty at largemTvalues in this analysis.
The multijet background uncertainty in the electron (muon) channel includes a 20% (100%) normalisation uncertainty. This uncertainty is dominated by the dependence of the factor f (see Section 3) on the selection requirements used for the background-enriched sample definition.
For themT region below 800–900 GeV, for which there are not many more MC events than data events, the MC statistical uncertainty is accounted for in the analysis.
The modelling of the pile-up especially affects the calculation ofEmiss
T . A pile-up modelling uncertainty is estimated by varying the distribution of pile-up events in the reweighting of the MC, as detailed in Section 3, to cover the uncertainty on the ratio between the predicted and measured inelastic cross- sections [43]. As for the otherEmiss
T -related uncertainties, the effect is found to be negligible in themT region considered in the analysis.
6.4 Luminosity
The uncertainty in the combined 2015-2017 integrated luminosity is 2.0%. It is derived, following a methodology similar to that detailed in Ref. [44], from calibrations of the luminosity scale using x-y beam-separation scans performed in August 2015, May 2016 and July 2017 (the results for 2017 are still preliminary).
7 Results
For the statistical analysis of the results presented in this section, the same methodology is applied as in the previous ATLASW0 search [6] and is described briefly here. The compatibility between the data and the predicted background is evaluated with a profile-likelihood ratio test quantifying the probability that the background fluctuates to give a signal-like excess equal to or larger than what is observed. The likelihood functions in the ratio are products of Poisson probabilities over all bins in the transverse mass distribution (as shown in Figure1) and log-normal constraints for the variations in signal and background yields associated with systematic uncertainties. In the denominator of the likelihood ratio, the likelihood function is maximised assuming the presence of a signal above the expected background, and in the numerator assuming the background-only hypothesis. To model the signal,W0
SSM templates binned in mT are used for a series of W0
SSM masses in the search range 350 GeV ≤ mW0 ≤ 6000 GeV. Figure1 displays a few examples of these templates. No significant excesses are observed in the data. The most significant excess in the electron channel is atmW0 =350 GeV with a local significance of 1.1σ. In the muon channel, the largest excess is atmW0 = 1.55 TeV, with a local significance of 2.2σ. This is the most significant excess observed overall, and its global significance, when the look-elsewhere effect [45] is taken into account, is 0.9σ. Combining the two channels, the most significant excess is atmW0=350 GeV with a local significance of 1.4σ.
Based on the above findings, upper limits on the cross-section for producing aW0
SSM boson times its branching ratio to only one lepton generation (σ× BR) are computed at the 95% CL as a function of the W0
SSM boson mass. The limits are calculated in a Bayesian analysis [46] with a uniform positive prior probability distribution forσ× BR. The observed upper limits are extracted by comparing data to the expected background and signal usingW0
SSM templates for the same range of signal masses as for the profile-likelihood ratio test. The expected limits are derived from pseudo-experiments obtained from the estimated background distributions. The median of the distribution of the limits from the pseudo- experiments is taken as the expected limit, and 1σ and 2σ bands are defined as the ranges containing respectively 68% and 95% of the limits obtained with the pseudo-experiments.
[TeV]
mW’
1 2 3 4 5 6
) [pb]νe→ BR(W’×W’) →(ppσ
4
10− 3
10− 2
10− 1
10−
1
Expected limit 1σ Expected ±
2σ Expected ± Observed limit W’SSM
Preliminary ATLAS
eν W’ → = 13 TeV, 79.8 fb-1
s
95% CL
(a)
[TeV]
mW’
1 2 3 4 5 6
) [pb]νµ→ BR(W’×W’) →(ppσ
4
10− 3
10− 2
10− 1
10−
1
Expected limit 1σ Expected ±
2σ Expected ± Observed limit W’SSM
Preliminary ATLAS
ν µ W’ → = 13 TeV, 79.8 fb-1
s
95% CL
(b)
[TeV]
mW’
1 2 3 4 5 6
) [pb]νl→ BR(W’×W’) →(ppσ
4
10− 3
10− 2
10− 1
10−
1
Expected limit 1σ Expected ±
2σ Expected ± Observed limit W’SSM
Preliminary ATLAS
lν W’ → = 13 TeV, 79.8 fb-1
s
95% CL
(c)
Figure 2: Observed (solid black line) and expected (dashed black line) upper limits on cross-section times branching ratio (σ×BR) as a function of the SSMW0boson mass in the (a) electron, (b) muon and (c) combined electron and muon channels. The 1σ(green) and 2σ(yellow) expected limit bands are also shown. The predictedσ×BRfor SSMW0production is shown as a red solid line. For illustration the uncertainties inσ×BRfrom the PDF,αsand the renormalisation and factorisation scales are also shown as red-dashed lines.
The 95% CL upper limits onσ×BRas a function of theW0
SSMmass are shown in Figure2separately for the electron and muon channels and for the combination of the two channels. The theoretical uncertainties and the uncertainty in the integrated luminosity are treated as correlated between the channels. The
expected upper limit onσ×BRis stronger in the electron channel. This results from the larger acceptance times efficiency and the better momentum resolution (see Section5). Figure2also shows the predicted σ×BRfor theW0
SSMboson as a function of its mass as well as the uncertainties from the PDF, αsand the factorisation and renormalisation scales derived using the same prescription as used for theWboson production. The observed (expected) lower mass limit for aW0
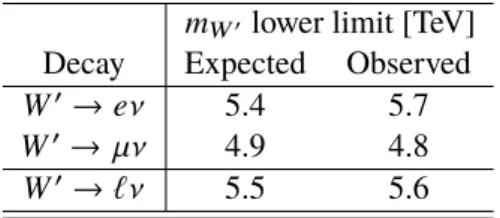
SSMboson, as summarised in Table3, is 5.6(5.5)TeV for the combination of the electron and muon channels. This corresponds to an improvement of approximately 0.5 TeV in mass reach compared to the previous ATLAS analysis [6], which did not include the 2017 data.
Table 3: Expected and observed 95% CL lower limit on theW0
SSMmass in the electron and muon channels and their combination.
mW0 lower limit [TeV]
Decay Expected Observed W0→eν 5.4 5.7 W0→µν 4.9 4.8 W0→`ν 5.5 5.6
8 Conclusion
The results of a search for a new heavy gauge boson decaying to final states with a high-pT electron or muon and large missing transverse momentum are reported. The analysis uses 79.8 fb−1of
√s =13 TeV pp collision data recorded by the ATLAS detector at the Large Hadron Collider in 2015, 2016 and 2017. Examining the transverse mass spectrum, no significant excess above the expected Standard Model background is observed. Exclusion limits at 95% CL are placed on the mass of benchmark Sequential Standard ModelW0bosons. Masses forW0
SSMbosons up to 5.6 TeV are excluded by the combination of the electron and muon channels. This exceeds the previous limit from ATLAS, derived from a similar analysis based on 36.1 fb−1of
√s=13 TeV data, by 0.5 TeV.
References
[1] L. Evans and P. Bryant,LHC Machine,JINST3(2008) S08001.
[2] R. N. Mohapatra, and J. C. Pati,
Left-right gauge symmetry and an "isoconjugate" model of CP violation, Phys. Rev. D11(1975) 566.
[3] G. Senjanovic, and R. N. Mohapatra,
Exact left-right symmetry and spontaneous violation of parity,Phys. Rev. D12(1975) 1502.
[4] N. Arkani-Hamed, A. G. Cohen, E. Katz, and A. E. Nelson,The Littlest Higgs, JHEP07(2002) 034, arXiv:hep-ph/0206021.
[5] G. Altarelli, B. Mele, and M. Ruiz-Altaba,Searching for new heavy vector bosons inpp¯colliders, Z. Phys. C45(1989) 109.
[6] ATLAS Collaboration,
Search for a new heavy gauge boson resonance decaying into a lepton and missing transverse momentum in 36 fb−1ofppcollisions at√
s=13TeV with the ATLAS experiment, (2017), arXiv:1706.04786 [hep-ex].
[7] ATLAS Collaboration,Search for High-Mass Resonances Decaying toτνinppCollisions at√ s
= 13 TeV with the ATLAS Detector,Phys. Rev. Lett.120(2018) 161802, arXiv:1801.06992 [hep-ex].
[8] CMS Collaboration,Search for high-mass resonances in final states with a lepton and missing transverse momentum at√
s =13TeV, (2018), arXiv:1803.11133 [hep-ex]. [9] ATLAS Collaboration,The ATLAS Experiment at the CERN Large Hadron Collider,
JINST3(2008) S08003.
[10] ATLAS Collaboration,ATLAS Insertable B-Layer Technical Design Report, CERN-LHCC-2010-013, ATLAS-TDR-19, 2010,
url:https://cds.cern.ch/record/1291633,
ATLAS Insertable B-Layer Technical Design Report Addendum, ATLAS-TDR-19-ADD-1, 2012,
URL:https://cds.cern.ch/record/1451888.
[11] ATLAS Collaboration,Performance of the ATLAS Trigger System in 2015, Eur. Phys. J. C77(2017) 317, arXiv:1611.09661 [hep-ex].
[12] S. Alioli, P. Nason, C. Oleari, and E. Re,A general framework for implementing NLO calculations in shower Monte Carlo programs: the POWHEG BOX,JHEP06(2010) 043,
arXiv:1002.2581 [hep-ph].
[13] T. Sjöstrand, S. Mrenna, and P. Z. Skands,A brief introduction to PYTHIA 8.1, Comput. Phys. Commun.178(2008) 852, arXiv:0710.3820 [hep-ph]. [14] H.-L. Lai et al.,
New parton distribution functions from a global analysis of quantum chromodynamics, Phys. Rev. D82(2010) 074024, arXiv:1007.2241 [hep-ph].
[15] P. Golonka and Z. Was,PHOTOS Monte Carlo: a precision tool for QED corrections inZ and W decays,Eur. Phys. J. C45(2006) 97, arXiv:hep-ph/0506026.
[16] C. Anastasiou, L. Dixon, K. Melnikov, and F. Petriello,High precision QCD at hadron colliders:
Electroweak gauge boson rapidity distributions at NNLO,Phys. Rev. D69(2004) 094008, arXiv:hep-ph/0312266.
[17] S. Dulat et al.,The CT14 Global Analysis of Quantum Chromodynamics, Phys. Rev. D93(2016) 033006, arXiv:1506.07443 [hep-ph].
[18] D. Bardin et al.,SANC integrator in the progress: QCD and EW contributions, JETP Lett.96(2012) 285, arXiv:1207.4400 [hep-ph].
[19] S. G. Bondarenko and A. A. Sapronov,NLO EW and QCD proton-proton cross section calculations with mcsanc-v1.01,Comput. Phys. Commun.184(2013) 2343,
arXiv:1301.3687 [hep-ph].
[20] T. Sjöstrand, S. Mrenna, and P. Z. Skands,PYTHIA 6.4 physics and manual,JHEP05(2006) 026, arXiv:hep-ph/0603175.
[21] R. D. Ball et al.,Parton distributions with LHC data,Nucl. Phys. B867(2013) 244, arXiv:1207.1303 [hep-ph].
[22] ATLAS Collaboration,ATLAS Pythia 8 tunes to 7 TeV data, ATL-PHYS-PUB-2014-021, 2014, url:https://cds.cern.ch/record/21966419.
[23] M. Czakon and A. Mitov,Top++: A Program for the Calculation of the Top-Pair Cross-Section at Hadron Colliders,Comput. Phys. Commun.185(2014) 2930, arXiv:1112.5675 [hep-ph]. [24] T. Gleisberg et al.,Event generation with SHERPA 1.1,JHEP02(2009) 007,
arXiv:0811.4622 [hep-ph].
[25] ATLAS Collaboration,ATLAS search for a heavy gauge boson decaying to a charged lepton and a neutrino inppcollisions at√
s =7TeV,Eur. Phys. J. C72(2012) 2241, arXiv:1209.4446 [hep-ex].
[26] ATLAS Collaboration,The ATLAS Simulation Infrastructure,Eur. Phys. J. C70(2010) 823, arXiv:1005.4568 [physics.ins-det].
[27] S. Agostinelli et al.,GEANT4: A simulation toolkit,Nucl. Instrum. Meth. A506(2003) 250.
[28] ATLAS Collaboration,Electron efficiency measurements with the ATLAS detector using the 2015 LHC proton-proton collision data, ATLAS-CONF-2016-024, 2016,
url:https://cds.cern.ch/record/2157687.
[29] ATLAS Collaboration,Muon reconstruction performance of the ATLAS detector in proton–proton collision data at√
s=13 TeV,Eur. Phys. J. C76(2016) 292, arXiv:1603.05598 [hep-ex]. [30] ATLAS Collaboration,Electron and photon energy calibration with the ATLAS detector using
data collected in 2015 at√
s=13TeV, ATL-PHYS-PUB-2016-015, 2016, url:https://cds.cern.ch/record/2203514.
[31] ATLAS Collaboration,Performance of missing transverse momentum reconstruction with the ATLAS detector using proton-proton collisions at√
s= 13 TeV, (2018), arXiv:1802.08168 [hep-ex].
[32] ATLAS Collaboration,
Topological cell clustering in the ATLAS calorimeters and its performance in LHC Run 1, Eur. Phys. J.C77(2017) 490, arXiv:1603.02934 [hep-ex].
[33] M. Cacciari, G. P. Salam, and G. Soyez,The anti-ktjet clustering algorithm,JHEP04(2008) 063, arXiv:0802.1189 [hep-ph].
[34] ATLAS Collaboration,Jet Calibration and Systematic Uncertainties for Jets Reconstructed in the ATLAS Detector at√
s=13TeV, ATL-PHYS-PUB-2015-015, 2015, url:https://cds.cern.ch/record/2028594.
[35] ATLAS Collaboration,Performance of the ATLAS muon trigger in pp collisions at√
s=8TeV, Eur. Phys. J. C75(2015) 120, arXiv:1408.3179 [hep-ex].
[36] J. Gao, and P. Nadolsky,A meta-analysis of parton distribution functions,JHEP07(2014) 035, arXiv:1401.0013 [hep-ph].
[37] J. Butterworth et al.,PDF4LHC recommendations for LHC Run II,J. Phys. G43(2016) 023001, arXiv:1510.03865 [hep-ph].
[38] L. A. Harland-Lang, A. D. Martin, P. Motylinski, and R. S. Thorne,
Parton distributions in the LHC era: MMHT 2014 PDFs,Eur. Phys. J. C75(2015) 204, arXiv:1412.3989 [hep-ph].
[39] R. D. Ball et al.,Parton distributions for the LHC Run II,JHEP04(2015) 040, arXiv:1410.8849 [hep-ph].
[40] M. Botje et al.,The PDF4LHC Working Group Interim Recommendations, (2011), arXiv:1101.0538 [hep-ph].
[41] A. D. Martin, W. J. Stirling, R. S. Thorne, and G. Watt,Uncertainties onαs in global PDF analyses and implications for predicted hadronic cross sections,Eur. Phys. J. C64(2009) 653, arXiv:0905.3531 [hep-ph].
[42] J. Gao et al.,CT10 next-to-next-to-leading order global analysis of QCD, Phys. Rev. D89(2014) 033009, arXiv:1302.6246 [hep-ph].
[43] ATLAS Collaboration,Measurement of the Inelastic Proton-Proton Cross Section at√
s=13TeV with the ATLAS Detector at the LHC,Phys. Rev. Lett.117(2016) 182002,
arXiv:1606.02625 [hep-ex]. [44] ATLAS Collaboration,
Luminosity determination in pp collisions at√
s=8TeV using the ATLAS detector at the LHC, Eur. Phys. J. C76(2016) 653, arXiv:1608.03953 [hep-ex].
[45] E. Gross, and O. Vitells,Trial factors or the look elsewhere effect in high energy physics, Eur. Phys. J. C.70(2010) 525, arXiv:1005.1891 [physics.data-an].
[46] A. Caldwell, D. Kollar, and K. Kroninger,BAT: The Bayesian analysis toolkit,
Comput. Phys. Commun.180(2009) 2197, arXiv:0808.2552 [physics.data-an].
Appendix
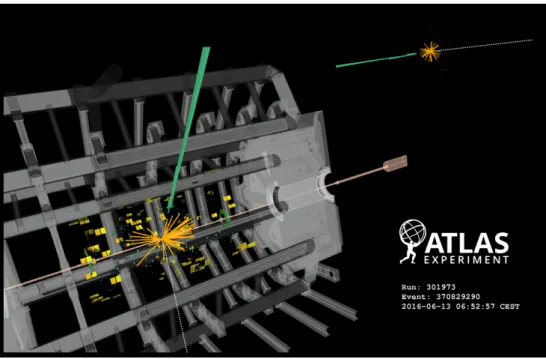
This appendix includes a collection of supplementary figures. Figure3is the same as Figure1but without the lower panel. Event displays of the events with the highest transverse mass in the electron and muon channels are shown in Figures4and5respectively.
Events
1
10−
1 10 102
103
104
105
106 -1
= 13 TeV, 79.8 fb s
Data W Top quark Multijet
* Z/γ Diboson W’ (3 TeV)
W’ (4 TeV) W’ (5 TeV) Preliminary
ATLAS selection eν W’ →
Transverse mass [GeV]
400 1000 2000 3000
Data / Bkg 0.6
0.8 1 1.2 1.4
(a)
Events
1
10−
1 10 102
103
104
105
106 -1
= 13 TeV, 79.8 fb s
Data W Top quark
* Z/γ Diboson Multijet W’ (3 TeV)
W’ (4 TeV) W’ (5 TeV) Preliminary
ATLAS selection ν µ W’ →
Transverse mass [GeV]
400 1000 2000 3000
Data / Bkg 0.6
0.8 1 1.2 1.4
(b)
Figure 3: Transverse mass distributions for events satisfying all selection criteria in the (a) electron and (b) muon channels. The distributions in data are compared to the stacked sum of all expected backgrounds. As examples, expected signal distributions for three different SSMW0boson masses are shown on top of the SM prediction. The bin width is constant in log(mT). The lower panels show the ratios of the data to the expected background, with vertical bars representing both data and MC statistical uncertainties. The bands in the ratio plots indicate the total systematic uncertainty from the sources discussed in Section6, including the integrated luminosity.
Figure 4: Event display of the event with the highest transverse mass in the electron channel. The transverse momentum of the electron candidate ispT= 1.1 TeV, the missing transverse momentum isEmiss
T = 1.1 TeV, and the transverse mass ismT= 2.2 TeV.
Figure 5: Event display of the event with the highest transverse mass in the muon channel. The transverse momentum of the muon candidate ispT= 2.4 TeV, the missing transverse momentum isEmiss
T = 2.7 TeV, and the transverse mass ismT= 5.0 TeV.