ATLAS-CONF-2017-016 27/04/2017
ATLAS NOTE
ATLAS-CONF-2017-016
20th March 2017
Search for a new heavy gauge boson resonance decaying into a lepton and missing transverse momentum in 36 fb−1 of ppcollisions
at √
s = 13 TeV with the ATLAS experiment
The ATLAS Collaboration
Abstract
The results of a search for new heavyW0 bosons decaying to an electron or muon and a neutrino using proton–proton collision data at a centre-of-mass energy of √
s = 13 TeV are presented. The dataset was collected in 2015 and 2016 by the ATLAS experiment at the Large Hadron Collider and corresponds to an integrated luminosity of 36.1 fb−1. As no excess of events above the expected level of Standard Model predictions is observed, the results are used to set upper limits on theW0boson cross-section times branching ratio to an electron or muon and a neutrino as a function of theW0mass. Assuming aW0boson with the same couplings as the Standard ModelWboson,W0masses below 5.11 TeV are excluded at the 95% confidence level.
c
2017 CERN for the benefit of the ATLAS Collaboration.
Reproduction of this article or parts of it is allowed as specified in the CC-BY-4.0 license.
1 Introduction
Extensions to the Standard Model (SM) may include heavy gauge bosons that could be discovered at the Large Hadron Collider (LHC) [1]. For example, they are predicted in left-right symmetric models [2,3], models with extra-dimensions [4], or the little Higgs model [5]. Conceptually, these particles are heavier versions of the SMWandZ bosons and are generically referred to asW0andZ0 bosons. The Sequential Standard Model (SSM) [6] posits aWSSM0 boson with couplings to fermions that are identical to those of the SMWboson, with theWSSM0 boson decaying into an electron or muon and a neutrino, or a quark pair.
The SSM is useful for comparing the sensitivity of different experiments and is a good benchmark as it allows to re-interpret the results in the context of other new physics models.
This paper presents a search for aW0 boson conducted in the W0 → `νchannel. In this note, lepton (`) is used to refer to an electron or muon unless otherwise stated. The analysis uses events with a high transverse momentum (pT) lepton1 and significant missing transverse momentumETmiss. It is based on 36.1 fb−1 of ppcollision data collected with the ATLAS detector in 2015 and 2016 at a centre-of-mass energy of √
s=13 TeV. The results are interpreted in the context of the SSM. The signal discriminant is the transverse mass, which is defined asmT = √
2pTEmissT (1−cosφ`ν), whereφ`ν is the angle between the lepton andETmissin the transverse plane
The most stringent limits on the mass of a WSSM0 boson in the W0 → eν and W0 → µν channels to date come from the ATLAS and CMS collaborations using data taken at √
s = 13 TeV in 2015. The ATLAS analysis was based on data corresponding to an integrated luminosity of 3.2 fb−1 and sets a 95% confidence level (CL) lower limit on theWSSM0 mass of 4.07 TeV [7]. The CMS collaboration used 2.4 fb−1 of data and excludesWSSM0 masses below 4.1 TeV at 95% CL [8]. The results presented in this paper supersede those mentioned above thanks to a dataset collected in 2016 that is an order of magnitude larger than the 2015 dataset.
2 ATLAS detector
The ATLAS experiment [9] at the LHC is a multi-purpose particle detector with a forward-backward symmetric cylindrical geometry and a near 4π coverage in solid angle. It consists of an inner track- ing detector (ID) surrounded by a thin superconducting solenoid providing a 2 T axial magnetic field, electromagnetic (EM) and hadronic calorimeters, and a muon spectrometer (MS). The inner tracking detector covers the pseudorapidity range|η| < 2.5. It consists of a silicon pixel detector including the newly-installed insertable B-layer [10], followed by silicon micro-strip, and transition radiation track- ing detectors. Lead/liquid-argon (LAr) sampling calorimeters provide EM energy measurements with high granularity. A hadronic (steel/scintillator-tile) calorimeter covers the central pseudorapidity range (|η| < 1.7). The end-cap and forward regions are instrumented with LAr calorimeters for both EM and hadronic energy measurements up to|η| < 4.9. The muon spectrometer surrounds the calorimeters and is based on three large air-core toroid superconducting magnets with eight coils each. The field integral experienced by tracks in the toroidal field ranges between 2.0 and 6.0 T m for most pseudorapidities. It
1ATLAS uses a right-handed coordinate system with its origin at the nominal interaction point (IP) in the centre of the detector and thez-axis along the beam pipe. The x-axis points from the IP to the centre of the LHC ring, and they-axis points upward. Cylindrical coordinates (r, φ) are used in the transverse plane,φbeing the azimuthal angle around the beam pipe.
The pseudorapidity is defined in terms of the polar angleθasη=−ln tan(θ/2). Transverse momentum (pT) is defined relative to the beam axis and is calculated aspT=psin(θ) wherepis the momentum.
includes a system of precision tracking chambers, over|η| < 2.7, and fast detectors for triggering, over
|η| < 2.4. A two-level trigger system is used to select events [11]. The first-level trigger is implemented in hardware and uses a subset of the detector information. This is followed by a software-based trigger system that reduces the accepted event rate to less than 1 kHz.
3 Analysis strategy and modelling of signal and background processes
AW0 signal would appear as an excess above the SM background at highmT. This background mainly arises from processes with at least one prompt final-state lepton, the largest source being from the charged- current Drell–Yan (DY) process (W), where theWboson decays into an electron or muon and a neutrino, with the next largest being from top quark pair (t¯t) and single top quark production, denoted in the following as “top quark background”. Other non-negligible contributions are from the neutral current DY (Z/γ∗) process, diboson production, as well as from events in which one final-state jet or photon passes the lepton selection criteria. The latter background component, referred to in the following as the multijet background, receives contributions from multijet, heavy-flavour quark andγ + jet production.
The multijet background is determined using a data-driven method, while the other backgrounds are modelled by Monte Carlo (MC) simulations.
The backgrounds fromW →`νandZ/γ∗→``with`=e, µ, τare simulated using Powheg-Boxv2 [12]
at next-to-leading order (NLO) in perturbative QCD (pQCD), interfaced to the Pythia8.186 [13] parton shower model and using the CT10 parton density function (PDF) set [14]. The final-state photon radiation (QED FSR) is modelled by Photos [15]. The samples are normalised as a function of the boson mass to a next-to-next-to-leading order (NNLO) pQCD calculation using VRAP [16] and the CT14NNLO PDF set [17]. Electroweak (EW) corrections in NLO beyond QED FSR are calculated as a function of mass with Mcsanc[18,19] at LO pQCD. These corrections are added to the NNLO QCD cross-section prediction in the so-called additive approach (see section6.2) because of a lack of calculations of mixed QCD and EW terms. TheW → `νandZ/γ∗ → `` events are simulated as multiple samples covering different ranges of the invariant mass of the lepton-neutrino or dilepton system. This allows to obtain large MC statistics in the high-mT tail.
The top quark process is generated using Powheg-Boxwith parton showering and hadronisation modelled by Pythia6.428 [20], using the CT10 PDF set. The cross-section is normalised toσtt¯=832 pb as calcu- lated with the Top++2.0 program and is accurate to NNLO in pQCD, including soft-gluon resummation to next-to-next-to-leading logarithmic accuracy (see Ref. [21] and references therein), and assuming a top-quark mass of 172.5 GeV. Diboson events are simulated with Sherpa2.1.1 [22] using the CT10 PDF set. As the simulated top quark and diboson samples are statistically limited at largemT, the expected number of events from each of these backgrounds is extrapolated into the high-mTregion. This is achieved by fitting the lowermT distributions to functions of the form F(x) = a xb+clogx andF(x) = d/(x+e)c, wherex=mT/√
s, and using the fitted function to predict the background at highermT. Various fit ranges are used, which typically start between 140 and 360 GeVand extend up to 500 to 1300 GeV. The fit with the bestχ2/d.o.f.is used for the extrapolation and the results of these fits are used in the high-mTtail.
The multijet background is estimated from data using the same data-driven “matrix” method as used in the previous analysis [7]. The first step of the matrix method is to calculate the factor f, the fraction of lepton candidates that pass the nominal lepton identification and isolation requirements (“tight"), with respect to a sample of “loose” lepton candidates in a background-enriched sample. These loosely-selected candidates satisfy only a subset of the nominal criteria, which are stricter than the trigger requirements
imposed. Potential contamination of prompt final-state leptons in the background-enriched sample is accounted for using MC simulation. In addition to the factor f, the fraction of real leptons r in the sample of loose objects satisfying the nominal requirements is used in evaluating this background. This probability is computed from MC simulation. The number of jets and photons misidentified as leptons (NTMultijet) in the total number of objects passing the signal selection (NT) is given as
NTMultijet= f NF = f r− f
r(NL+NT)−NT
, (1) whereNF is the number of fake leptons andNL corresponds to leptons that pass the loose requirements but fail the nominal requirements. As this background estimate is statistically limited at largemT, the expected number of events is extrapolated into the high-mT region using the same method as for the diboson and top quark backgrounds.
The SSM signalW0 → eνandW0 → µν samples are generated at leading order (LO) in QCD using Pythia8.183 and the NNPDF2.3 LO PDF set [23]. As required by the SSM, the couplings to fermions are equal to those of the SM W boson. The W0 boson is assumed to not couple to the SMW and Z bosons and interference effects between theW0and the SMWboson are neglected. The decayW0 →τν, where the τ subsequently decays leptonically, is not treated as part of the signal as this contribution has been quantified in the past and found to give negligible contribution to the sensitivity [24]. Mass- dependent correction factors are applied to normalise the samples to the same mass-dependent NNLO pQCD calculation as used for theW background. Further EW corrections beyond QED FSR are not considered for the signal. The resulting cross-sections times branching ratio forWSSM0 masses of 3, 4 and 5 TeV are 15.3, 2.25 and 0.51 fb, respectively, with a branching ratio to each lepton generation of 8.2%.
The MC samples are processed through a simulation of the detector geometry and response [25] using Geant4 [26,27]. The software used for the reconstruction is the same for both simulated and real data.
The average number of pile-up interactions (additionalppcollisions in the same or a nearby bunch cross- ing) observed in the data is around 23. This effect is emulated by overlaying simulated inelastic events as selected using very loose trigger requirements (“minimum bias”). All MC samples are reweighted so that the distribution of the number of collisions per bunch crossing matches the data. Correction factors to account for differences observed in the detector response between data and simulation are applied to the lepton trigger, reconstruction, identification [28,29], and isolation efficiencies as well as the lepton energy/momentum resolutions and scales [29,30].
4 Object reconstruction
The analysis makes use of muons, electrons and missing transverse momentum, the reconstruction and identification of which is explained in the following.
Electrons are reconstructed from ID tracks that are matched to energy clusters in the electromagnetic calorimeter obtained using a sliding-window algorithm in the range|η| < 2.47. Candidates in the trans- ition region between different electromagnetic calorimeter components, 1.37 < |η| < 1.52, are rejected.
Electrons must satisfy identification criteria based on measurements of calorimeter shower shapes and measurements of track properties from the ID combined in a likelihood discriminant. Depending on the background rejection, loose, medium and tight working points are defined. Full details of the electron reconstruction, identification and selection working points can be found in Ref. [28].
Muon candidates are identified from MS tracks that match tracks in the ID, with|η| < 2.5 [29]. These muons are required to pass a track quality selection based on the number of hits in the ID. They are rejected if the absolute value of the difference between the ratio of the charge and momentum of the muons measured in the ID and MS divided by the sum in quadrature of the corresponding uncertainties is large. To ensure optimal muon resolution at highpT, additional requirements are imposed on the quality of the MS track. The track is required to have at least three hits in each of the three separate layers of MS chambers. Furthermore, to avoidpTmismeasurements, muons which cross either poorly-aligned MS chambers, or regions in which the ID and the MS are not well aligned, are removed.
The ID tracks associated with electron and muon candidates are required to be consistent with coming from the primary interaction vertex, which is defined as the vertex whose constituent tracks have the highest sum of p2T. The significance of the transverse impact parameter with respect to the beam line, d0, is required to satisfy|d0|/σ(d0) < 5 (3) for electrons (muons). For muons, the longitudinal impact parameter, which is the distance between thez-position of the point of closest approach of the muon track in the ID to the beamline and thez-coordinate of the primary vertex, must fulfil|∆z0| ×sinθ < 0.5 mm.
Both electrons and muons are required to be isolated with respect to other objects in the event. The sum of the pT of tracks that fall inside an isolation cone around the lepton (excluding the track of the lepton itself) divided by the lepton pT has to be below a pT dependent threshold. The isolation cone size∆R = p
(∆η)2+(∆φ)2 is defined as 10 GeV divided by the lepton pT and the cone has a maximum size of∆R = 0.3 for muons and ∆R = 0.2 for electrons. For electrons, calorimeter-based isolation is also required. The sum of the calorimeter transverse energy deposits in the isolation cone of fixed size
∆R = 0.2 (excluding the energy deposits of the electron itself) divided by the electron pT is used as the discriminating variable. The calorimeter and track-based isolation criteria depend on pT andη and are optimised for an overall efficiency of 98% (99%) for electrons (muons).
The missing transverse momentum is reconstructed as the negative vectorial sum of the calibrated mo- menta of electrons, muons and jets, where the electrons and muons are required to satisfy the selection criteria described above [31]. The jets used in the calculation are reconstructed in the region|η|<4.9 from topological clusters [32] in the calorimeter using the anti-ktalgorithm [33] with a radius parameter of 0.4.
They are calibrated using the method described in Ref. [34] and are required to have pT > 20 GeV.
Tracks associated with the primary vertex are used for the computation ofEmissT from activity not associ- ated with electrons, muons or jets.
5 Event selection and background estimation
Events in the muon channel were recorded by a trigger requiring that at least one muon withpT>50 GeV is found. These muons must be reconstructed in both the MS and the ID. In the electron channel during the 2015 (2016) data taking period, events were recorded by a trigger requiring at least one electron with pT > 24 (60) GeV that satisfied the “medium” identification criteria, or at least one electron with pT >120 (140) GeV that satisfied the “loose” identification criteria. The identification criteria of electrons at trigger level is similar to those used in the offline reconstruction [28].
Events recorded by the trigger are further selected by requiring that they contain exactly one lepton. In the muon channel,EmissT must exceed 55 GeV and the muon is required to fulfil the tight requirements for high-pT muons detailed in Section4 and have pT > 55 GeV. In the electron channel, the electron must satisfy the tight identification criteria, and the electron pT and the ETmissmust both be in excess of 65 GeV. Events in both channels are vetoed if they contain additional leptons satisfying loosened selection
Transverse mass [GeV]
Events
−1
10 1 10 102
103
104
105
106
107
= 13 TeV, 36.1 fb-1
s
Data W Top quark Multijet
* Z/γ Diboson W’ (3 TeV)
W’ (4 TeV) W’ (5 TeV) Preliminary
ATLAS
selection eν W’ →
Data / Bkg 0.60.811.21.4
Transverse mass [GeV]
200 300 1000 2000
(post-fit)Data / Bkg 0.60.811.21.4
(a)
Transverse mass [GeV]
Events
−1
10 1 10 102
103
104
105
106
107
108
= 13 TeV, 36.1 fb-1
s
Data W Top quark
* Z/γ Diboson Multijet W’ (3 TeV)
W’ (4 TeV) W’ (5 TeV) Preliminary
ATLAS
selection ν µ W’ →
Data / Bkg 0.60.811.21.4
Transverse mass [GeV]
200 300 1000 2000
(post-fit)Data / Bkg 0.60.811.21.4
(b)
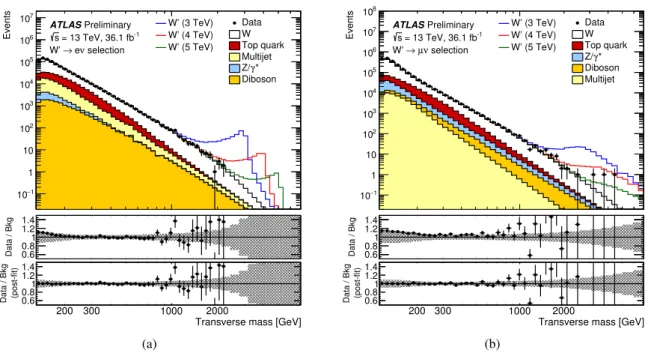
Figure 1: Transverse mass distributions for events satisfying all selection criteria in the electron (a) and muon (b) channels. The distributions in data are compared to the stacked sum of all expected backgrounds. As examples, expected signal distributions for three differentWSSM0 boson masses are added to the SM prediction. The bin width is constant in log(mT). The middle panels show the ratios of the data to the expected background, with error bars representing both data and MC statistical uncertainty. The lower panels show the ratios of the data to the adjusted expected background (“post-fit”) that results from the statistical analysis. The bands in the ratio plots indicate the sum in quadrature of the systematic uncertainties discussed in Section6, including the uncertainty on the integrated luminosity.
criteria, namely electrons with pT > 20 GeV passing the medium identification criteria or muons with pT > 20 GeV passing the muon selection without the stringent requirements on the MS track quality. In addition, the transverse mass is required to exceed 130 (110) GeV in the electron (muon) channel. The acceptance times efficiency, defined as the fraction of simulated signal events that pass the event selection described above, amounts to 81% (77%) for the electron channel and 50% (46%) for the muon channel for aW0 mass of 2 TeV (4 TeV). Compared to the electron channel, the efficiency in the muon channel is smaller. This results from a lower muon trigger efficiency and, due to the very strict muon selection criteria applied, a lower muon identification efficiency.
The number of expected background events is calculated as the sum of the data-driven and simulated background estimates described in Section3. Figure1displays themT distribution in the electron and muon channels. The values of the number of expected and observed events for some widermT ranges are shown also in Table1. It can be seen, that the background is dominated byW →`νproduction for all values ofmT, which constitutes around 90% of the total background atmT > 1 TeV. As examples, Figure1 also shows the expected signal distributions for a few WSSM0 boson masses added to the SM prediction. The effect of the momentum resolution is clearly visible when comparing the shapes of the three reconstructed WSSM0 signals in the electron and muon channels. The middle panels of Figure 1 show the ratio of the data over the SM predictions. The data are systematically above the predicted background at lowmT, but still within the total systematic uncertainty, which is dominated by theETmiss related systematic uncertainties in this region. The lower panels of Figure1show the ratio of the data
Table 1: The number of expected and observed events in the electron (top) and muon (bottom) channels in bins ofmT. The errors quoted are the combined statistical and systematic uncertainties. The systematic uncertainty includes all systematic uncertainties except the one on the integrated luminosity (3.2%).
Electron Channel
mT[GeV] 130–200 200–400 400–600 600–1000 1000–2000 2000–3000 3000–7000 Total SM 620000±70000 168000±10000 9700±500 1960±140 224±23 5.7±1.4 0.4±0.4 SM+W0(2 TeV) 620000±70000 168000±10000 9900±500 2660±160 3930±80 380±80 1.4±0.4 SM+W0(3 TeV) 620000±70000 168000±10000 9700±500 2000±140 363±25 265±6 28±6 SM+W0(4 TeV) 620000±70000 168000±10000 9700±500 1970±140 238±23 20.9±1.6 26.8±0.6 SM+W0(5 TeV) 620000±70000 168000±10000 9700±500 1960±140 227±23 7.4±1.4 4.6±0.4
Data 671128 169338 9551 1931 246 4 0
Muon Channel
mT[GeV] 110–200 200–400 400–600 600–1000 1000–2000 2000–3000 3000–7000 Total SM 1640000±200000 122000±8000 6460±330 1320±90 150±13 4.7±0.6 0.63±0.13 SM+W0(2 TeV) 1640000±200000 122000±8000 6610±340 1740±100 1870±90 374±28 18±4 SM+W0(3 TeV) 1640000±200000 122000±8000 6480±330 1350±90 235±16 103±6 39.9±3.4 SM+W0(4 TeV) 1640000±200000 122000±8000 6470±330 1330±90 158±13 13.5±1.0 11.7±0.9 SM+W0(5 TeV) 1640000±200000 122000±8000 6470±330 1320±90 152±13 5.7±0.7 2.36±0.22
Data 1862326 128155 6772 1392 177 3 3
to the adjusted background that results from a common fit to the electron and muon channels within the statistical analysis described in Section7. A good agreement is found for this ratio.
6 Systematic uncertainties
The systematic uncertainties arise from experimental and theoretical effects. They are summarised in Table2and described in the following subsections.
6.1 Uncertainties from the reconstruction of electrons, muons, andEmiss
T
Experimental systematic uncertainties arise from the knowledge of the trigger, reconstruction, identi- fication and isolation efficiencies for leptons [28,29], and the calculation of the missing transverse mo- mentum [31]. They include also the effects of the energy and momentum scale and resolution uncertainties [29,30,34].
The electron and muon offline reconstruction, identification and isolation efficiencies, and their respective uncertainties, are assessed up topT≈100 GeV using leptonic decays ofZboson candidates found in data.
The ratio of the efficiency measured in data to that of the MC simulation is then used to correct the MC prediction [28,29]. For higher-pT electrons, an additional uncertainty of 1.5% is estimated for the tight identification working point. This accounts for the differences observed between data and simulation.
For the isolation efficiencies, an uncertainty of±2% and±5% is estimated for 150< pT <500 GeV and above 500 GeV respectively usingZ/γ∗ candidates in data. For the identification of high-pT muons, an upper limit on the uncertainty of 2-3% per TeV is extracted from simulation. For the isolation criterion, the uncertainty associated with extrapolation to high pT is estimated to be 1%. Systematic uncertainties
Table 2: Systematic uncertainties in the expected number of events as evaluated for the total background and for signal with aWSSM0 mass of 2 (4) TeV. The uncertainty is evaluated with the binning shown in Figure1atmT=2 (4) TeV for the background and in a three-bin window aroundmT=2 (4) TeV for the signal. Uncertainties that are not applicable are denoted “n/a”, and “negl.” means that the uncertainty is not included in the statistical analysis.
Sources of uncertainties not included in the table are neglected in the statistical analysis.
Source Electron channel Muon channel
Background Signal Background Signal
Trigger negl. (negl.) negl. (negl.) 2% (2%) 2% (2%)
Lepton reconstruction
negl. (negl.) negl. (negl.) 5% (6%) 5% (7%)
and identification Lepton momentum
4% (5%) 4% (3%) 3% (9%) 1% (1%)
scale and resolution
ETmissresolution and scale <0.5% (<0.5%) <0.5% (<0.5%) <0.5% (1%) 1% (1%) Jet energy resolution <0.5% (<0.5%) <0.5% (<0.5%) <0.5% (<0.5%) <0.5% (<0.5%)
Pile-up 1% (<0.5%) 1% (<0.5%) <0.5% (1%) 1% (<0.5%)
Multijet background 12% (109%) n/a(n/a) 1% (1%) n/a(n/a)
Diboson & top extrapolation 5% (21%) n/a(n/a) 5% (13%) n/a(n/a)
PDF choice for DY 1% (19%) n/a(n/a) <0.5% (1%) n/a(n/a)
PDF variation for DY 8% (20%) n/a(n/a) 7% (11%) n/a(n/a)
EW corrections for DY 4% (9%) n/a(n/a) 4% (5%) n/a(n/a)
Luminosity 3% (3%) 3% (3%) 3% (3%) 3% (3%)
Total 17% (115%) 5% (5%) 12% (21%) 6% (8%)
related to the electron trigger are negligible. For the muon trigger the systematic uncertainty was estim- ated using the same methodology as in Ref. [35], which results in an overall uncertainty of around 2% in the muon channel.
The main sources of systematic uncertainties related toEmissT arise from the jet energy resolution uncer- tainties [34] and the contribution of tracks associated with the primary vertex, which are used to compute the value ofEmissT from activity not associated with electrons, muons or jets [31]. The uncertainties due to the jet energy andETmissresolutions are small at largemT, while they are non-negligible at smallmT. The jet energy scale uncertainties are found to be negligible.
6.2 Theoretical uncertainties
Theoretical uncertainties are related to the production cross-sections estimated from MC simulation. The effects as propagated to the total background estimate are significant for W andZ/γ∗ production, but negligible for the top quark and diboson samples. No theoretical uncertainties are considered for theW0 boson signals in the statistical analysis.
Theoretical uncertainties in the W and Z/γ∗ background prediction arise from the PDF uncertainties, the value of the strong coupling constantαS, and higher-order corrections. The dominant effect comes from the PDF uncertainty, which is obtained from the 90% CL CT14NNLO PDF error set using VRAP to calculate the NNLO cross-section as a function of mass. Rather than using the original 28 CT14
uncertainty eigenvectors, a re-diagonalised set of seven PDF eigenvectors, as provided by the authors of the CT14 PDF using MP4LHC [36,37], is used. The cross-section variation associated with each of these eigenvectors has a characteristic mass dependence and the sum in quadrature of these eigenvector variations matches the original CT14NNLO error envelope well. This sum is shown as “PDF variation” in Table2. An additional uncertainty is derived due to the choice of the nominal PDF set used. The central values of the CT14NNLO PDF set are compared to the MMHT2014 [38] and NNPDF3.0 [39] PDF sets.
A comparison between these PDF sets shows that the central values for NNPDF3.0 fall outside the “PDF variation” uncertainty at largemT. Thus, an envelope of the “PDF variation” and the NNPDF3.0 central value is formed, where the former is subtracted in quadrature from this envelope, and the remaining part, which is only non-zero when the NNPDF3.0 central value is outside the “PDF variation” uncertainty, is quoted as “PDF choice”. The PDF uncertainties are the same at the generator level for the electron and muon channels, but result in different uncertainties at reconstruction level. The uncertainty is larger in the electron channel due to the better energy resolution: there is less migration of events with low generator level invariant mass, where the PDF uncertainty is smaller, into the high-mTregion in this channel.
Uncertainties in the electroweak corrections are determined as the difference between the additive ap- proach (1+δEW+δQCD) and a factorised approach ((1+δEW)×(1+δQCD)) of the EW corrections in the combination of higher-order EW and QCD effects. Uncertainties due to higher-order QCD corrections on theZ/γ∗process are estimated by varying the renormalisation and factorisation scales simultaneously up and down by a factor of two. The uncertainty due toαsis assessed by changing the value ofαsby as much as 0.003 from the nominal valueαs(mZ) =0.118 used by the CT14NNLO PDF set. Both the scale and theαsuncertainties are found to be negligible.
Theoretical uncertainties are also considered for the top quark and diboson backgrounds. An uncertainty on thet¯tcross-section of+−2920pb arises from the independent variation of the factorisation and renormal- isation scales, while an uncertainty of±35 pb is associated to variations in the PDF andαs, following the PDF4LHC prescription (see Ref. [40] and references therein) with the MSTW2008 68% CL NNLO [41], CT10 NNLO [42] and NNPDF2.3 NNLO [23] PDF sets. As this background constitutes only a small fraction of the overall background, these normalisation uncertainties are negligible. Furthermore, the modelling of the top quark background is found to be adequate in a data control region defined by requir- ing the presence of an additional muon (electron) in events passing the electron (muon) selection. The uncertainty on the diboson background is assessed in a similar way and is also found to be negligible in terms of the effect on the total background.
6.3 Background modelling uncertainties
The dominant systematic uncertainties on the multijet, top quark and diboson backgrounds at highmTare due to the extrapolations. These uncertainties are evaluated by varying both the functional form of the fit functions and the fit range as detailed in Section3. The envelope of all variations is assigned for the uncertainty. This results in the largest source of background-related systematic uncertainties at largemT values in this analysis.
The multijet background uncertainty in the electron (muon) channel includes a 15% (100%) normalisation uncertainty. This uncertainty is dominated by the effects from the data-driven estimates arising from the dependence of the factor f(see Section3) on the specific selection used to derive the background-enriched sample.
For themTregion below 700 – 800 GeV, for which the MC statistics is not much larger than the amount of data, the MC statistical uncertainty is accounted for in the analysis.
The modelling of the pile-up affects in particular the calculation ofEmissT . The uncertainty on the ratio between the predicted and measured inelastic cross-section in the fiducial volume, which is defined by a mass of the hadronic system exceeding 13 GeV [43], is assigned as the pile-up modelling uncertainty.
It is emulated by varying the distribution of pile-up events in the reweighting of the MC events, which ensures that the distribution of the number of collisions per bunch crossing matches the one describing the data.
6.4 Luminosity
The uncertainty on the combined 2015 and 2016 integrated luminosity is 3.2%. Following a methodology similar to that detailed in Ref. [44], it is derived from a preliminary calibration of the luminosity scale usingx-ybeam-separation scans performed in August 2015 and May 2016.
7 Results
For the statistical analysis of the results presented in this section, the same methodology is applied as in the previous ATLASW0search [7] and is described briefly here. The compatibility between the data and the background expectation is evaluated with a profile likelihood ratio test quantifying the probability that the background fluctuates to give a signal-like excess equal to or larger than what is observed. The likelihood functions in the ratio are defined as the product of Poisson probabilities over all bins in the transverse mass distribution (as shown in Figure1) and log-normal constraints for the variations in signal and background yields associated with systematic uncertainties. In the denominator of the likelihood ratio, the likelihood function is maximised assuming the presence of a signal above the expected background, and in the numerator assuming the background-only hypothesis. To model the signal, WSSM0 templates binned in mT are used for a series ofWSSM0 masses in the search range 150 GeV <mW0 < 6000 GeV. Figure1 displays a few examples of these templates. No significant excesses are observed in the data. The most significant excess is atmW0 = 1.1 TeV in the electron channel, with a local significance of 2.3σ. In the muon channel, the most significant excess is at high mass, with a maximum local significance of 1.8σat mW0 ≈ 5 TeV. These excesses correspond to global significances of 0.6σand 0.1σfor the electron and muon channels respectively when the look-elsewhere effect [45] is taken into account.
Based on the above findings, upper limits on the cross-section for producing aWSSM0 boson times its branching ratio to only one lepton generation (σ× BR) are computed at the 95% CL as a function of the WSSM0 boson mass. The limits are calculated in a Bayesian analysis [46] with a uniform positive prior probability distribution forσ× BR. The observed upper limits are extracted by comparing data to the expected background and signal using WSSM0 templates for the same range of signal masses as for the profile likelihood ratio test. The expected limits are derived from pseudo-experiments obtained from the estimated background distributions. The median of the distribution of the limits from the pseudo- experiments is taken as the expected limit, and 1σand 2σbands are defined as the ranges containing respectively 68% and 95% of the limits obtained with the pseudo-experiments.
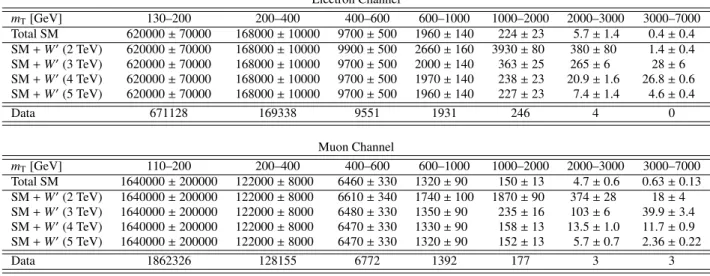
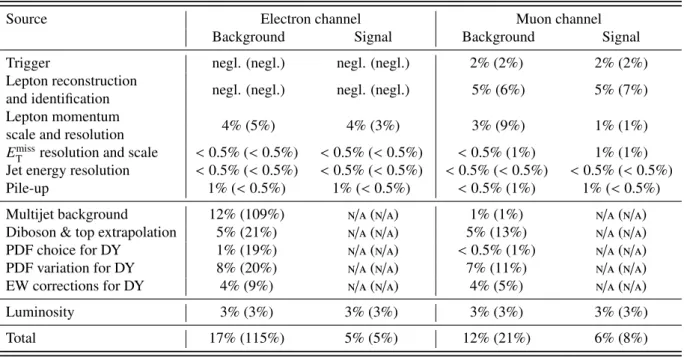
The 95% CL upper limits on theσ×BRas a function of theWSSM0 mass are shown in Figure2separ- ately for the electron and muon channels and for the combination of the two channels. The theoretical
[TeV]
mW’
1 2 3 4 5 6
) [pb]νe→ BR(W’×W’) →(ppσ
4
10− 3
10− 2
10− 1
10−
1 10
Expected limit 1σ Expected ±
2σ Expected ± Observed limit W’SSM
Preliminary ATLAS
eν W’ →
= 13 TeV, 36.1 fb-1
s 95% CL
(a)
[TeV]
mW’
1 2 3 4 5 6
) [pb]νµ→ BR(W’×W’) →(ppσ
4
10− 3
10− 2
10− 1
10−
1 10
Expected limit 1σ Expected ±
2σ Expected ± Observed limit W’SSM
Preliminary ATLAS
ν µ W’ →
= 13 TeV, 36.1 fb-1
s 95% CL
(b)
[TeV]
mW’
1 2 3 4 5 6
) [pb]νl→ BR(W’×W’) →(ppσ
4
10− 3
10− 2
10− 1
10−
1 10
Expected limit 1σ Expected ±
2σ Expected ± Observed limit W’SSM
Preliminary ATLAS
lν W’ →
= 13 TeV, 36.1 fb-1
s 95% CL
(c)
Figure 2: Observed (solid black line) and expected (dashed black line) upper limits on cross-section times branch- ing ratio (σ×BR) in the electron (a), muon (b) and combined electron and muon channels (c). The 1σ(green) and 2σ(yellow) expected limit bands are also shown. The predictedσ×BRforWSSM0 production is shown as a red solid line. For illustration also the uncertainties onσ×BRfrom the PDF,αsand the renormalisation and factorisation scales are shown as a red-dashed line.
uncertainties and the uncertainties onEmissT , jet energy resolution and luminosity are treated as correlated between the channels. As can be seen, the expected upper limit onσ× BRis stronger in the electron channel. This results from the larger acceptance times efficiency and the better momentum resolution (see Section5). Figure2also shows the predictedσ×BRfor theWSSM0 boson as a function of its mass as well as the uncertainties from the PDF,αsand the factorisation and renormalisations scales derived using the same prescription as used for theW boson production. The observed (expected) lower mass limit for aWSSM0 boson, as summarised in Table3, is 5.11 (5.22) TeV for the combination of the electron and muon channels. This corresponds to a significant improvement in mass reach by approximately 1 TeV with respect to the previous ATLAS analysis [7], which was based on a subset of the data used in this analysis.
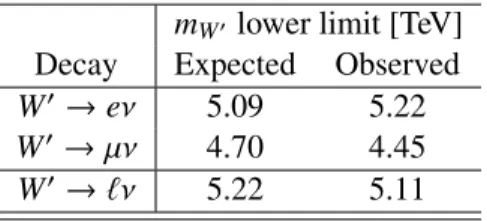
Table 3: Expected and observed 95% CL lower limit on theWSSM0 mass in the electron and muon channels and their combination.
mW0 lower limit [TeV]
Decay Expected Observed
W0→eν 5.09 5.22
W0→µν 4.70 4.45
W0→`ν 5.22 5.11
8 Conclusion
The results of a search for a new heavy gauge boson decaying to final states with a high-pT electron or muon and large missing transverse momentum are reported. The analysis uses 36.1 fb−1 of √
s = 13 TeV pp collision data recorded by the ATLAS detector at the Large Hadron Collider in 2015 and 2016. Examining the transverse-mass spectrum, no significant excess above the expected Standard Model background is observed. Exclusion limits at 95% CL are placed on the mass of benchmark Sequential Standard ModelW0bosons. Masses forWSSM0 bosons up to 5.11 TeV are excluded by the combination of the electron and muon channels. This exceeds the previous limit, derived from a similar ATLAS analysis based on 3.2 fb−1of √
s=13 TeV data, by 1 TeV.
References
[1] L. Evans and P. Bryant,LHC Machine,JINST3(2008) S08001.
[2] R. N. Mohapatra, and J. C. Pati,
Left-Right Gauge Symmetry and an Isoconjugate Model of CP Violation, Phys. Rev. D11(1975) 566.
[3] G. Senjanovic, and R. N. Mohapatra,
Exact Left-Right Symmetry and Spontaneous Violation of Parity,Phys. Rev. D12(1975) 1502.
[4] H. C. Cheng, C. T. Hill, S. Pokorski, and J. Wang,The Standard model in the latticized bulk, Phys. Rev. D64(2001) 065007, arXiv:hep-th/0104179 [hep-th].
[5] N. Arkani-Hamed, A. G. Cohen, E. Katz, and A. E. Nelson,The Littlest Higgs, JHEP07(2002) 034, arXiv:hep-ph/0206021 [hep-ph].
[6] G. Altarelli, B. Mele, and M. Ruiz-Altaba,Searching for new heavy vector bosons in pp colliders,¯ Z. Phys. C45(1989) 109.
[7] ATLAS Collaboration,Search for new resonances in events with one lepton and missing transverse momentum in pp collisions at √
s=13TeV with the ATLAS detector, Phys. Lett. B762(2016) 334, arXiv:1606.03977 [hep-ex].
[8] CMS Collaboration,Search for heavy gauge W’ boson in events with an energetic lepton and large missing transverse momentum at √
s=13TeV, (2016), arXiv:1612.09274 [hep-ex].
[9] ATLAS Collaboration,The ATLAS Experiment at the CERN Large Hadron Collider, JINST3(2008) S08003.
[10] ATLAS Collaboration,ATLAS Insertable B-Layer Technical Design Report, CERN-LHCC-2010-013, ATLAS-TDR-19, 2010,
url:http://cds.cern.ch/record/1291633.
[11] ATLAS Collaboration,Performance of the ATLAS Trigger System in 2015, (2015), arXiv:1611.09661 [hep-ex].
[12] S. Alioli, P. Nason, C. Oleari, and E. Re,A general framework for implementing NLO calculations in shower Monte Carlo programs: the POWHEG BOX,JHEP06(2010) 043, arXiv:1002.2581 [hep-ph].
[13] T. Sjöstrand, S. Mrenna, and P. Z. Skands,A Brief Introduction to PYTHIA 8.1, Comput. Phys. Commun.178(2008) 852, arXiv:0710.3820 [hep-ph].
[14] H.-L. Lai et al.,New parton distributions for collider physics,Phys. Rev. D82(2010) 074024, arXiv:1007.2241 [hep-ph].
[15] P. Golonka and Z. Was,PHOTOS Monte Carlo: a precision tool for QED corrections in Z and W decays,Eur. Phys. J. C45(2006) 97, arXiv:hep-ph/0506026.
[16] C. Anastasiou, L. Dixon, K. Melnikov, and F. Petriello,High precision QCD at hadron colliders:
Electroweak gauge boson rapidity distributions at NNLO,Phys. Rev. D69(2004) 094008, arXiv:hep-ph/0312266 [hep-ph].
[17] S. Dulat et al.,The CT14 Global Analysis of Quantum Chromodynamics, Phys. Rev. D93(2016) 033006, arXiv:1506.07443 [hep-ph].
[18] D. Bardin et al.,SANC integrator in the progress: QCD and EW contributions, JETP Lett.96(2012) 285, arXiv:1207.4400 [hep-ph].
[19] S. G. Bondarenko and A. A. Sapronov,NLO EW and QCD proton-proton cross section calculations with mcsanc-v1.01,Comput. Phys. Commun.184(2013) 2343,
arXiv:1301.3687 [hep-ph].
[20] T. Sjöstrand, S. Mrenna and P. Z. Skands,PYTHIA 6.4 Physics and Manual, JHEP05(2006) 026, arXiv:hep-ph/0603175 [hep-ph].
[21] M. Czakon and A. Mitov,Top++: A Program for the Calculation of the Top-Pair Cross-Section at Hadron Colliders,Comput. Phys. Commun.185(2014) 2930, arXiv:1112.5675 [hep-ph].
[22] T. Gleisberg et al.,Event generation with SHERPA 1.1,JHEP02(2009) 007, arXiv:0811.4622 [hep-ph].
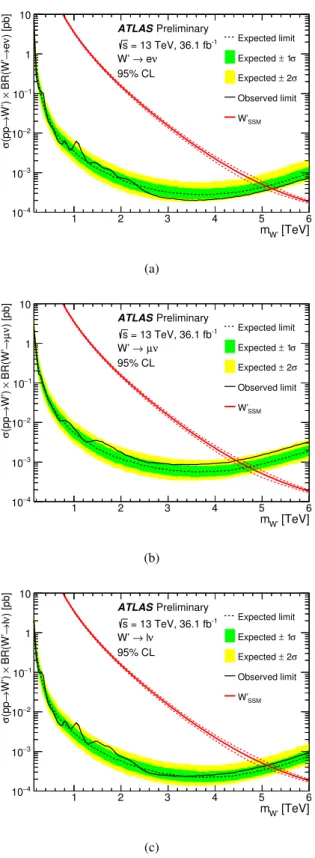
![Figure 5: Normalised cross-section limits (σ limit /σ SSM ) for SSM W SSM 0 boson production as a function of boson mass for this analysis and from previous ATLAS searches [7, 24, 47, 48]](https://thumb-eu.123doks.com/thumbv2/1library_info/4005906.1540844/18.892.239.694.406.759/figure-normalised-section-production-function-analysis-previous-searches.webp)
