ATLAS-CONF-2012-113 14August2012
ATLAS NOTE
ATLAS-CONF-2012-113
August 12, 2012
Search for long-lived, heavy particles in final states with a muon and multi-track displaced vertex in proton-proton collisions at √
s = 7TeV with the ATLAS detector
The ATLAS Collaboration
Abstract
Many extensions of the Standard Model posit the existence of heavy particles with long lifetimes. In this note, results are presented of a search for such particles, which decay at a significant distance from their production point, using a final state containing charged hadrons and an associated muon. This analysis uses a data sample of proton-proton colli- sions at
√s=
7TeV corresponding to an integrated luminosity of 4.4 fb
−1collected in 2011 by the ATLAS detector operating at the Large Hadron Collider. Results are interpreted in the context of
R-parity violating supersymmetric scenarios. No events in the signal regionare observed and limits are set on the supersymmetry production cross section, multiplied by the branching ratio for neutralino decays to charged muons and tracks, as a function of the neutralino lifetime. To allow these limits to be used in a variety of models, they are presented for a range of squark and neutralino masses.
c
Copyright 2012 CERN for the benefit of the ATLAS Collaboration.
Reproduction of this article or parts of it is allowed as specified in the CC-BY-3.0 license.
1 Introduction
Several extensions to the Standard Model predict the production at the Large Hadron Collider (LHC) of heavy particles, with lifetimes that may be of order picoseconds, or up to about a nanosecond [1]. One such scenario is gravity-mediated supersymmetry ( [2] SUGRA) with
R-parity violation [3, 4] (RPV). Ifthe results of
R-parity conserving supersymmetry searches at the LHC (see, for example, Refs. [5, 6])continue to disfavour light superpartners, then scenarios in which
R-parity is violated may be requiredif supersymmetry is the solution to the hierarchy problem [7]. The present (largely indirect) constraints on RPV couplings [3, 4] would allow the decay of the lightest supersymmetric particle as it traverses a particle detector at the LHC. Signatures of heavy, long-lived particles also feature in models of gauge- mediated supersymmetry breaking [8], split-supersymmetry [9], hidden-valley [10], dark-sector gauge bosons [11] and stealth supersymmetry [12].
This note presents the results of a search for the decay of a heavy particle, producing a multi-track vertex that contains a high transverse momentum (
pT) muon, at a distance between millimeters and tens of centimeters from the
ppinteraction point. As in our earlier work [13], the results are interpreted in the context of an R-parity violating supersymmetric scenario. In this model, the signature corresponds to the decay of the lightest supersymmetric particle, resulting in a muon and many high-p
Tcharged tracks originating from a single displaced vertex (DV). This can arise from a diagram such as that shown in Fig. 1, where the decay occurs due to the non-zero RPV coupling
λ02i j.
Searches for related signatures have also been made at the Tevatron with
√s =
1.96 TeV
pp¯ col- lisions. The DØ collaboration has searched for a long-lived neutral particle decaying into a final state containing two muons [14] or a
bb¯ pair [15]. Similar searches have also been made at LEP [16]. The result reported here improves on the previous ATLAS search for this signature [13] in several ways. The dataset is
∼100 times greater than used in the previous work and corresponds to an integrated luminosityof 4.4 fb
−1[17]. Furthermore, the signal e
fficiency is increased by improving the e
fficiency to recon- struct tracks that do not originate from the primary vertex. The dependence on simulation to estimate background levels is also reduced.
µ *
µ
~
0χ λ'2ij
q
jq
iFigure 1: Diagram of the massive lightest neutralino ˜
χ0decaying into a muon and two jets via a virtual smuon, with lepton-number and
R-parity violating couplingλ02i j.
2 The ATLAS detector
The ATLAS detector [18] is a multipurpose apparatus at the LHC. The detector consists of several layers
of subdetectors. From the interaction point (IP) outwards there is an inner detector (ID), measuring the
tracks of charged particles, electromagnetic and hadronic calorimeters, and an outer muon spectrometer
(MS).
The ID is immersed in a 2 Tesla axial magnetic field, and extends from a radius
1of about 45 mm to 1100 mm and to
|z|of about 3100 mm. It provides tracking and vertex information for charged particles within the pseudorapidity region
|η|<2.5. At small radii, silicon pixel layers and stereo pairs of silicon microstrip detector provide high resolution pattern recognition. The pixel system consists of three barrel layers, and three forward disks on either side of the interaction point. The barrel pixel layers, which are positioned at radii of 50.5 mm, 88.5 mm, and 122.5 mm are of particular relevance to this work. The silicon microstrip tracker (SCT) comprises four double layers in the barrel, and nine forward disks on either side. A further tracking system, a transition-radition tracker (TRT), is positioned at larger radii.
This device is made of straw-tube elements interleaved with transition-radiation material and provides coverage within
|η|<2.0.
The calorimeter provides coverage over the pseudorapidity range
|η| <4.9. This system con- sists of a lead/liquid-argon electromagnetic calorimeter, a hadronic calorimeter comprising a steel and scintillating-tile system in the barrel region and a liquid-argon system with copper and tungsten absorbers in the end-caps.
Muon identification and momentum measurement is provided by the MS. This device has a coverage in pseudorapidity of
|η| <2.7 and is a 3-layer system of gas-filled precision-tracking chambers. The pseudorapidity region
|η|<2.4 is additionally covered by separate trigger chambers, used by the level-1 hardware trigger. The MS is immersed in a magnetic field which is produced by a barrel toroid and two end-cap toroids.
Online event selection is made with a three-level trigger system. This system comprises a hardware- based level-1 trigger, which uses information from the MS trigger chambers and the calorimeters, fol- lowed by two software-based trigger levels.
3 Data and simulation
The data used in this analysis were collected between March and October 2011. After the application of beam, detector, and data-quality requirements, the total luminosity considered corresponds to 4.4 fb
−1, with an uncertainty of
±1.8% [17]. It is further required that the trigger identifies a muon candidate withtransverse momentum
pT >40 GeV and
|η| <1.05. The latter selection is necessary because of the higher fake muon rate in the (higher
|η|) end-cap region since no ID track requirement is imposed.Signal events are generated with P
6 [19], using the MRST LO** [20] set of parton distribution functions (PDFs). Simulations are made of processes in which a ˜
qq, ˜˜
qq, or ˜˜
qq˜ are produced in the
ppcollision, with each squark (antisquark) decaying into a long-lived lightest neutralino and a quark (antiquark). Degeneracy of the first and second generations and for the left-handed and right-handed squarks are assumed. The masses of the gluino, sleptons and third generation squarks are set to a high value and are thus not directly produced in the supersymmetry scenario considered here.
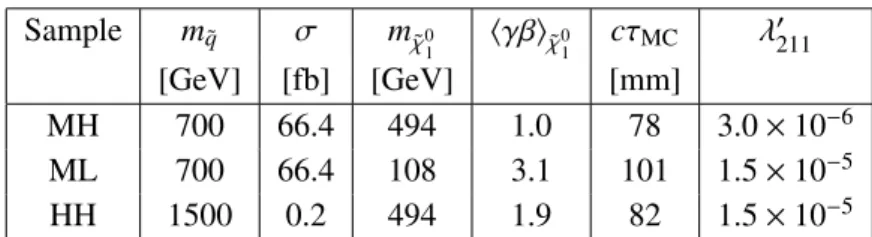
The parameter settings for the samples of signal Monte Carlo (MC) files are summarised in Ta- ble 1. The chosen values of squark and neutralino masses correspond to a wide range in the quantities to which the signal efficiency is most sensitive: neutralino speed and final state multiplicities (see Sec- tion 5). The Higgsino-gaugino mixing determines the neutralino mass values. The signal MC samples are labeled in Table 1 according to the squark mass and neutralino mass, respectively: MH (medium- mass squark, heavy neutralino), ML (medium-mass squark, light neutralino), and HH (heavy squark and heavy neutralino). It is assumed that all RPV couplings other than
λ0211are zero. This leads to each
1ATLAS uses a right-handed coordinate system with its origin at the nominal IP in the centre of the detector and thez-axis along the beam pipe. Thex-axis points from the IP to the centre of the LHC ring, and they-axis points upward. Cylindrical coordinates (R, φ) are used in the transverse plane,φbeing the azimuthal angle around the beam pipe. The pseudorapidity is defined in terms of the polar angleθasη=−ln tan(θ/2).
Sample
mq˜ σ mχ˜01 hγβiχ˜0
1 cτMC λ0211
[GeV] [fb] [GeV] [mm]
MH 700 66.4 494 1.0 78 3.0
×10
−6ML 700 66.4 108 3.1 101 1.5
×10
−5HH 1500 0.2 494 1.9 82 1.5
×10
−5Table 1: The parameter values for the three signal MC samples used in this work: the assumed squark mass, production cross section (calculated with PROSPINO), neutralino mass, average value of the Lorentz boost factor (from P), average proper decay length, and value of
λ0211coupling used in the generation of the signal MC samples.
neutralino decaying to
µ−ud¯ (or the charge-conjugate state)
2. The values of the
λ0211coupling in the various samples are selected such that a significant fraction of neutralino decays occur in the detector volume considered in this analysis. The average neutralino proper flight distances (cτ
MC, where
τMCis the generated neutralino lifetime) are provided in Table 1.
The PROSPINO [21] program is used to calculate the signal cross section (hereafter referred to as the supersymmetry production cross section) at next-to-leading order; cross section values are listed in Table 1. The CTEQ6.6 [22] set of PDFs is used. Owing to differences in the predicted cross sections for the ˜
qq˜ and ˜
qq¯˜ processes from P
and PROSPINO, and the possible sensitivity of the neutralino- speed distribution to the assumed process, signal samples are generated for each process separately with P and reweighted according to the relative cross sections of the two processes as estimated with PROSPINO. The reweighting procedure, however, has a minimal e
ffect on the distributions of physical quantities used in this work and typically leads to changes of much less than 1%.
MC simulated event samples are also used to study possible background sources, evaluate accep- tance and signal e
fficiency, and to estimate various systematic uncertainties. The non-signal simulated processes used in this work are minimum-bias, QCD-multijet,
W+jets, and
Z+jets which are produced with the P MC generator. The
t¯tproduction process is also considered; this is generated with MC@NLO [23] interfaced to HERWIG [24] with the underlying event modelled by JIMMY [25].
Each generated event in the signal or background samples is processed with the Geant4-based [26]
ATLAS detector simulation [27] and treated in the same way as the collision data. The samples include a realistic modelling of the pile-up conditions observed in the data.
4 Vertex reconstruction and event selection
Events are required to pass a trigger that selects high-p
Tmuon candidates in the barrel region of the muon spectrometer, with no requirement on ID tracks. Owing to the higher instantaneous luminosity in the LHC in 2011 compared to that in 2010, most events contain more than one primary vertex (PV). The PV with the highest sum of the
p2Tof the tracks associated to it, is required to have at least five tracks and a
zposition (z
PV) in the range
|zPV|<200 mm. In order to reduce cosmic ray background, events are rejected if they contain two muons which appear back-to-back. The selection
p(φ
1−φ2)
2−(η
1+η2)
2)
>0.1 is applied where
φ1,
φ2,
η1and
η2are the azimuthal angles and pseudorapidities of the two reconstructed muons (labelled with subscripts 1 and 2).
A muon candidate is required to have been reconstructed in both the MS and the ID with transverse momentum
pT >50 GeV (which is well into the efficiency plateau of the trigger),
|η| <1.07, and an
2In the SUSY scenario assumed here, a non-zeroλ0211can also lead to the decay of a neutralino to a neutrino and jets final state with the same branching fraction as for the muonic decay. This process is not considered in this work.
impact parameter transverse to the beam
>1.5 mm. To ensure that the muon candidate is associated with the muon that satisfied the trigger requirement, the selection
p∆φ2+ ∆η2 <
0.15 is imposed, where
∆φ(∆
η) is the difference between the azimuthal angle (pseudorapidity) of the reconstructed muon candidateand that of the muon identified by the trigger. The ID track associated with the muon candidate is required to have at least six SCT hits, with at most one SCT hit that is expected but not found i.e. in an active detector element with no known read-out problems. Furthermore, the track must satisfy an
|η|-dependent requirement on the number of TRT hits. No pixel-hit requirements are applied to the muon track. The combination of requirements described above is referred to as the muon-selection criteria.
In order to reconstruct a DV it is first necessary to select high quality tracks. Candidate tracks from a DV must have two or more associated SCT hits and a value of
|d0|greater than 2 mm, where
d0is the impact parameter of the track with respect to the transverse position of the PV, (x
PV, yPV). Studies made with the MC simulation show that 98% of all tracks originating from the primary
ppinteraction are rejected by the selection on
|d0|. Standard ATLAS tracking [18] is based on three passes in whichthe initial track candidates are formed in di
fferent ways: initially found in the silicon detectors, initially found in the TRT detector, and only found in the TRT detector. These algorithms all assume that tracks originate from close to the PV, and hence will have reduced reconstruction efficiency for signal tracks which originate at a DV. To counter this problem and recover some of these lost tracks, the silicon- seeded tracking algorithm is re-run with looser requirements on the radial and
zimpact parameters, and on the number of detector hits that can be shared among more than one seed track. To reduce the rate of false track seeds, it is required that these additional tracks have
pT >1 GeV, which is greater than the standard-tracking requirement of
pT >400 MeV. This procedure is termed “re-tracking”. Fig. 2 shows the efficiency for vertex reconstruction as a function of the radial position of the vertex
rDVwhen using standard tracking and re-tracking for sample MH. As can be seen, there is a substantial improvement due to re-tracking at values of
rDVgreater than around 10 mm. The dips in the plots correspond to losses in efficiency for decays immediately before a pixel layer, where many tracks from the vertex have shared pixel hits and therefore fail the selection.
[mm]
rDV
0 20 40 60 80 100 120 140 160 180
Vertex reconsctuction efficiency
0 0.05 0.1 0.15 0.2 0.25 0.3 0.35 0.4 0.45
Re-tracking No re-tracking ATLAS
simulation
preliminary s = 7 TeV
Figure 2: The vertex reconstruction efficiency as a function of
rDVafter all cuts for the MH sample, with and without re-tracking.
Using an algorithm based on the incompatibility-graph approach [28], DVs are sought with the se- lected tracks. The method adopted is similar to that used in Ref. [29]. The algorithm starts by finding two-track seed vertices from all pairs of tracks; those that have a vertex-fit
χ2of less than 5 are retained.
A seed vertex is rejected if at least one of its tracks has hits between the vertex and the PV. Multi-track
vertices are formed from combinations of seed vertices in an iterative process. The following method is
used to do this. If a track is assigned to two different vertices, the action taken depends on the distance
Dbetween the vertices. If
D<3σ
D, where
σDis the estimated uncertainty on
D, a single vertex is formedfrom the tracks of the two vertices. Otherwise, a track is associated with that vertex for which the track has the smaller
χ2value. In the event of the
χ2of a track relative to the resulting vertex exeeding 6, the track is removed from the vertex, and the vertex is refitted. This process continues until no track is associated with more than one vertex. Finally, vertices are combined and refitted if they are separated by less than 1 mm.
To ensure a good quality DV fit, the
χ2per degree of freedom of the fit must be less than 5. Further- more, the DV position is required to be in the fiducial region, defined as:
|zDV| <300 mm and
rDV <180 mm, where
rDVand
zDVare the radial and longitudinal vertex positions with respect to the origin.
To minimise background coming from the PV, the transverse distance
p(
xDV−xPV)
2+(y
DV−yPV)
2between any of the PVs and the DV must be at least 4 mm. It is required that the number of tracks
NDVtrkin the DV to be at least five. This reduces background from random combinations of tracks and from material interactions. An additional suppression of background due to particle interactions with material is obtained by requiring
mDV >10 GeV. Here,
mDVis the invariant mass of the set of tracks associated with the DV, using the charged pion mass hypothesis for each track. Candidate vertices which pass (fail) the
mDV>10 GeV requirement are hereafter referred to as being high-m
DV(low-m
DV) vertices.
The typical position resolution of the DV in the signal MC samples is tens of microns for
rDVand about 200
µm forzDVnear the interaction point. For vertices beyond the outermost pixel layer, which is located at a radius of 122.5 mm, the typical resolution is several hundred microns for both coordinates.
Low-m
DVvertices from particle-material interactions are abundant in regions in which the detector material is dense. High-m
DVbackground may arise from the random spatial coincidence of a material- interaction vertex with a high-p
Ttrack, especially when this track and the particle that initiated the material-interaction vertex originate from di
fferent primary interactions, resulting in a large angle be- tween their momentum vectors.
To reduce this source of background, vertices that are reconstructed in regions of high-density mate- rial are removed. The high-density material was mapped using low-m
DVmaterial-interaction candidate vertices in data and true material-interaction vertices in minimum-bias MC events. The
zDVand
rDVpo- sitions of these vertices are used to make a two-dimensional material-density distribution with a bin size of 4 mm in
zDVand 1 mm in
rDV. It has been demonstrated [29] that the detector simulation describes well the positions of pixel layers and associated material, while the simulated position of the beampipe is shifted with respect to the actual position. The use of data events to construct the material map there- fore ensures that the beampipe material is correctly mapped, while the use of the simulation provides a high granularity of the map at the outer pixel layers, where material-interaction vertices in the data are comparatively rare. Material-map bins with vertex density greater than an
rDV- and
zDV-dependent den- sity criterion are characterised as high-density-material regions. This corresponds to 34% of the volume
|zDV|<
300 mm,
rDV<180 mm.
To ensure that the muon candidate is associated with the reconstructed DV, the distance of closest approach of the muon with respect to the DV is required to be less than 0.5 mm. The aforementioned selections are collectively referred to as the vertex-selection criteria.
5 Signal e ffi ciency
The signal efficiency depends strongly on the efficiencies for track reconstruction and track selection, which are affected by several factors. (1) The number of tracks originating from the DV and their total invariant mass increase with the neutralino mass. (2) More tracks fail the
|d0| >2 mm requirement for small
rDVor if the neutralino is highly boosted leaving its daughters pointing back closer to the PV.
(3) The efficiency for reconstructing tracks decreases with increasing values of
|d0|. Because the MHand HH samples have the same neutralino mass, but different boosts, a cross check of the efficiency estimation procedure can be made. The HH sample is reweighted vertex-by-vertex such that the
βγversus
ηdistributions match the MH sample. It was then checked that they have the same efficiency as a function of decay position.
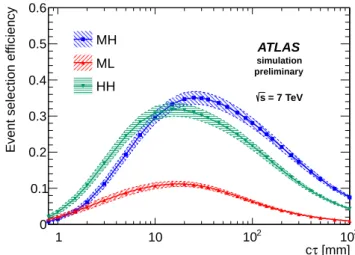
The total e
fficiency for each of the signal MC samples is shown in Fig. 3 as a function of
cτ. Thisefficiency as a function of
cτis calculated from the samples generated with a single-cτ value (see Table 1) using a 2-D map in (|z
DV|,rDV) (Fig. 4) and distributions of decay positions for different values of
cτ.Events are reweighted according to their probability of being found at di
fferent positions in the map, where probability depends on
cτ. Fig. 3 includes systematic corrections and uncertainties that will bediscussed in Section 7.
[mm]
τ c
1 10 102 103
Event selection efficiency
0 0.1 0.2 0.3 0.4 0.5 0.6
MH ML HH
ATLAS
simulation preliminary = 7 TeV s
Figure 3: The event selection efficiency as a function of
cτfor the three signal samples. The uncertainties on the e
fficiency are shown as bands.
| [mm]
|zDV
0 50 100 150 200 250 300
[mm]DVr
0 20 40 60 80 100 120 140 160 180
0 0.1 0.2 0.3 0.4 0.5 0.6
ATLAS simulation preliminary s = 7 TeV
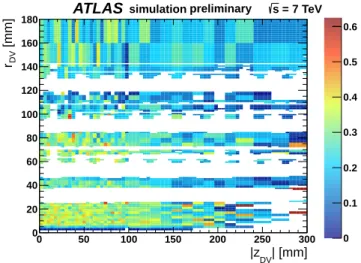
Figure 4: The efficiency as a function of
rDVand
zDVfor vertices in the signal MC sample MH. The
blank areas represent regions of dense material which are not considered when looking for DVs. Bin-to-
bin fluctuations due to limited MC statistics are compensated for by recalculating this map many times,
varying each bin content within its statistical uncertainty.
6 Background estimation
Spurious high-m
DV, high-multiplicity vertices in non-material regions could come from one of two sources: (1) Purely random combinations of tracks (real or fake). This type of background is expected to form the largest contribution at small radii where the track density is highest. (2) Vertices from real hadronic interactions with gas molecules. Although most of these events will have masses below the 10 GeV requirement, the high mass tail of the distribution indicates a potential background, in particular if the vertex is crossed by a random track (real or fake) at large crossing angle.
The background inside the beampipe (where there are no real hadronic interactions due to the vac- uum, but where random combinations are expected to dominate) is evaluated using two independent control samples. One control sample uses jet-triggered events (rather than muon-triggered events), and the other uses vertices with 4 GeV
< mDV <10 GeV, which is below the standard vertex selection requirement. This procedure gives an estimate of 0.00
+−00.06vertices for this source of background.
To estimate the background from real hadronic interactions, including those crossed by tracks from di
fferent PVs, two
mDV-distributions are constructed. One distribution is formed from vertices which do not include a so-called large angle track i.e. the average angle between a constituent track and the rest of the tracks in the vertex must be less than one radian. The four-momentum of a randomly-selected track in the event is added to the vertex to build the second distribution. Both of these distributions are taken from a large control sample of jet-triggered events. The relative normalizations of these distributions are determined using an estimate of the “crossing probability”. This is obtained by fitting a function representing a
Ksmass peak to the invariant mass distribution of all two-track combinations within three-track vertices, and comparing the integral of this function (which is a measure of how many real
Kswere crossed by a random track to form a three-track vertex), to the number of two-track
Ksmesons observed.
With the shape of the
mDV-distribution determined in this manner, the absolute normalization for the muon-triggered sample can be found. This is extracted from a maximum likelihood fit, which takes as input the numbers of vertices in each material layer (i.e., the beam pipe and three pixel detector layers
3), and the numbers of low-track-multiplicity vertices in each air gap. It has been empirically observed that in each material layer or air gap, the relation between the numbers of
n-track, (n+1)-track, (n
+2)-track vertices etc., is well modelled by an exponential function, and also that the ratio of the number of
n-trackvertices in a material layer to the number in the air gap immediately outside it, is consistent between several different control samples. These relations can therefore be used in the fit to predict the number of
≥5-track vertices in the air gaps. The
mDVdistribution, scaled by this number, is then integrated to obtain an estimate of the number of vertices with
mDV >10 GeV, and a final scale factor is applied, based on the fraction of events in our muon-triggered sample that pass the offine muon requirements.
The final background estimate from this procedure, is 3.7
+−3.74.4×10
−3vertices.
The total background estimate, summing both sources, is therefore taken to be 4
+−460×10
−3vertices.
7 Systematic corrections and uncertainties
Several categories of uncertainties and corrections are considered. Uncertainty on signal reconstruction e
fficiency results from the limited size of the signal MC datasets as well as uncertainties on trigger efficiency, tracking efficiency, and muon reconstruction efficiency. Uncertainties are also included on the simulation of event pileup and on the integrated luminosity.
To estimate the uncertainty on the e
fficiency as a function of
cτ(Fig. 3) from finite MC statistics, the efficiency in each bin of the 2D efficiency maps (Fig. 4) is varied randomly within its statistical uncer-
3A detailed study of the material distribution within the ID is provided in Ref. [29]
tainty and the total efficiency was repeatedly re-measured. The spread in those results is the contribution to the systematic uncertainty on the e
fficiency at each
cτvalue.
To compensate for the different
z-distributions of the primary vertices in data and MC simulation, aweight is applied to each simulated event such that the reweighted
zPVdistribution matches that in data.
This weight is applied to both the numerator and denominator in the e
fficiency calculation.
Similarly, a weight is applied to each simulated event such that the distribution of
hµi, the average number of interactions per bunch-crossing, matches that in data. An uncertainty associated with this procedure is estimated by scaling the
hµivalues used as input to this correction calculation by a factor 0.9 (motivated by taking the difference between scaling the MC by
hµicalculated from luminosity mea- surements and by using the number of reconstructed PVs in data and MC), and evaluating the differences on the e
fficiency as a function of
cτ. This difference is applied as a symmetric systematic uncertainty.
A trigger efficiency correction and associated systematic uncertainty are derived from a study of
Z →µ+µ−events in which at least one of the muons was selected with a single-muon trigger. The trigger e
fficiency for selecting one of the signal events is about 90%. The ratio of the trigger e
fficiency in data and simulation is applied as a correction factor, and the statistical uncertainty from this method is added in quadrature to the differences between the
Z→µ+µ−sample and the signal samples to get a systematic uncertainty.
The systematic uncertainty on the track reconstruction e
fficiency is estimated by comparing the track finding performance between data and MC simulation. The uncertainty is estimated from a study where the number of
Ksvertices in data and simulation are compared over a range of radii and
η-values. Basedon the outcome of this study, some fraction of tracks in the signal MC are randomly removed from the input to the vertexing algorithm, and the same procedure to obtain efficiency-vs-cτ is performed. The di
fference between this and the nominal e
fficiency at each
cτpoint is taken as a systematic uncertainty.
Since the distribution of the true values of
d0for cosmic-ray muons is flat over the limited
d0range considered here, as confirmed by cosmic-ray simulation, the shapes of the measured (simulated)
d0- spectra of cosmic muons (simulated muons) can be used to determine the accuracy to which the simula- tion reproduces the muon-finding e
fficiency as a function of
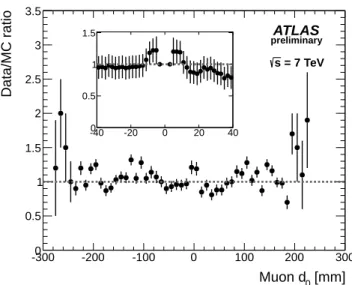
d0. In Fig. 5 the ratio between the number of observed cosmic muons (recorded during 2011) and the simulated muon-finding efficiency (for sam- ple MH) is shown as a function of
d0. Applying an arbitrary normalisation, the ratio is set to unity in the range 2
< |d0| <4 mm. For a perfect simulation with negligible statistical uncertainties this distri- bution should be flat. However, variations are observed which can be attributed to an imperfect detector simulation and statistical uncertainties related to the finite size of the simulated samples. Furthermore, although Fig. 5 uses only simulated data from sample MH, similar distributions are obtained when using the other signal MC samples. All deviations from unity for the various samples are taken into account in the calculation of the signal efficiency in each
d0bin, and are reflected in Figs. 3 and 4. The statistical uncertainties shown in Fig. 5 are propagated to uncertainties of between
±3.5% and±8% on the signalreconstruction efficiency, depending on the signal sample.
8 Results
Fig. 6 shows the distribution of
mDVvs.
NDVtrkfor vertices in the selected data events, including vertices that are rejected by the selection on
mDVand
NDVtrk. The signal distribution for the MH sample is also shown. The signal region, corresponding to a minimum number of tracks in a vertex of five and a minimum vertex mass of 10 GeV, is also shown. No events are observed in the signal region.
Given the lack of any candidate events in data, upper limits are evaluted on the supersymmetry pro-
duction cross section (σ) times the branching ratio (BR) for produced squarks to decay via a long-lived
neutralinos to muons and quarks. The limits are presented for di
fferent assumed values of squark and
neutralino mass and
cτ, whereτis the neutralino lifetime. Based on the efficiency, background estimate,
[mm]
Muon d0
-300 -200 -100 0 100 200 300
Data/MC ratio
0 0.5 1 1.5 2 2.5 3 3.5
ATLAS
preliminary = 7 TeV s
-400 -20 0 20 40
0.5 1 1.5
Figure 5: Main plot: the ratio between the number of observed cosmic-ray muons (recorded during 2011) and the simulated muon-finding e
fficiency (for sample MH of Table 1) as a function of
d0. The ratio is normalized to unity (shown as a dotted line) in the range 2
< |d0| <4 mm. Inset: the same distribution over a shorter range in
d0.
Number of tracks in vertex 3 4 5 6 7 8 10 20 30 40
V e rt e x m a s s [ G e V ]
1 10 10
20 0.02 0.04 0.06 0.08 0.1 0.12 0.14 0.16 0.18 0.2
ATLAS
Ldt = 4.4 fb-1
∫
preliminary
Signal region
s = 7 TeVData 2011 Signal MC
0 0.02 0.04 0.06 0.08 0.1 0.12 0.14 0.16 0.18 0.2
Figure 6: Vertex mass (m
DV) vs. vertex track multiplicity (N
DVtrk) for DVs in events that pass relaxed
muon requirements and the selection requirements except the
mDVand
NDVtrkrequirements, which are
not applied. Shaded bins show the distribution for the signal MC MH sample (see Table 1), and data
are shown as filled ellipses, with the area of the ellipse proportional to the number of vertices in the
corresponding bin.
and luminosity of 4.4 fb
−1(with the uncertainties on each of these treated as nuisance parameters), the
CLsmethod [30] is used to set limits on the plane of
σ·BR versus
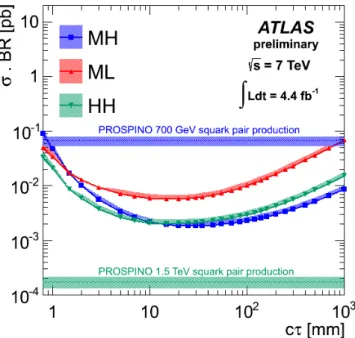
cτ. The resulting limits are shownin Fig. 7, with the PROSPINO-calculated cross sections for squark masses of 700 and 1500 GeV. The PROSPINO predictions are shown as a band which represents the variation in predicted cross section when using two di
fferent sets of PDFs (CTEQ6.6 and MSTW [31]) and varying the factorisation and renormalisation scales each up and down by a factor of two. Since essentially no background is expected and no events are observed, the expected and observed limits are indistinguishable. In addition, based on the observation of no signal events in a data sample of 4.4 fb
−1, a 95% confidence-level upper limit of 0.68 fb is set on
σ·BR multiplied by the detector acceptance and the reconstruction efficiency for any signal vertex.
Figure 7: Upper limits at 95% CL on
σ·BR vs. the neutralino lifetime for different combinations of squark and neutralino masses, based on the observation of zero events satisfying all criteria in a 4.4 fb
−1data sample. The shaded areas around these curves represent the
±1σ uncertainty bands on the expected limits. The horizontal lines show the cross sections calculated from PROSPINO for squark masses of 700 GeVand 1500 GeV, and the shaded regions around these lines represent the uncertainties on the cross sections obtained from the procedure described in the text.
9 Summary and conclusions
An improved search is presented for new, heavy particles that decay at radial distances between 4 mm and 180 mm from the
ppinteraction point, in association with a high-transverse-momentum muon. Fewer than 0.06 background events are expected in the data sample of 4.4 fb
−1, and no events are observed.
Limits are presented on the product of di-squark production cross section and decay-chain branching
fraction in a SUGRA scenario where the lightest neutralino produced in the primary-squark decay un-
dergoes an
R-parity-violating decay into a muon and two quarks. The limits are reported as a functionof the neutralino lifetime and for a range of neutralino masses and velocities, which are the factors with
greatest impact on the limit. Limits for a variety of other models can thus be approximated from these results, based on the neutralino mass and velocity distribution in a given model.
References
[1] M. Fairbairn, A. C. Kraan, D. A. Milstead, T. Sjostrand, P. Z. Skands and T. Sloan, “Stable massive particles at colliders”, Phys. Rept.
438, 1 (2007) [hep-ph/0611040].
[2] A. H. Chamseddine, R. L. Arnowitt and P. Nath, “Locally Supersymmetric Grand Unification”, Phys. Rev. Lett.
49(1982) 970; R. Barbieri, S. Ferrara and C. A. Savoy, “Gauge Models with Spontaneously Broken Local Supersymmetry”, Phys. Lett. B
119(1982) 343; L. E. Ibanez,
“Locally Supersymmetric SU(5) Grand Unification”, Phys. Lett. B
118(1982) 73; L. J. Hall, J. D. Lykken and S. Weinberg, “Supergravity as the Messenger of Supersymmetry Breaking”, Phys. Rev. D
27(1983) 2359; N. Ohta, “Grand Unified Theories Based On Local
Supersymmetry”, Prog. Theor. Phys.
70(1983) 542.
[3] R. Barbier, C. Berat, M. Besancon, M. Chemtob, A. Deandrea, E. Dudas, P. Fayet and S. Lavignac
et al., “R-parity violating supersymmetry”, Phys. Rept.420(2005) 1 [hep-ph
/0406039].
[4] B. C. Allanach, M. A. Bernhardt, H. K. Dreiner, C. H. Kom and P. Richardson, “Mass Spectrum in R-Parity Violating mSUGRA and Benchmark Points”, Phys. Rev. D
75(2007) 035002
[hep-ph/0609263].
[5] The ATLAS Collaboration, “Search for top and bottom squarks from gluino pair production in final states with missing transverse energy and at least three b-jets with the ATLAS detector”, arXiv:1207.4686 [hep-ex].
[6] The ATLAS Collaboration, “Hunt for new phenomena using large jet multiplicities and missing transverse momentum with ATLAS in 4.7 fb-1 of sqrt(s)
=7 TeV proton-proton collisions”, JHEP
1207(2012) 167 [arXiv:1206.1760 [hep-ex]].
[7] P. W. Graham, D. E. Kaplan, S. Rajendran and P. Saraswat, “Displaced Supersymmetry,” JHEP
1207(2012) 149 [arXiv:1204.6038 [hep-ph]].
[8] S. Dimopoulos, M. Dine, S. Raby and S. D. Thomas, “Experimental signatures of low-energy gauge mediated supersymmetry breaking”, Phys. Rev. Lett.
76(1996) 3494 [hep-ph/9601367].
[9] J. L. Hewett, B. Lillie, M. Masip and T. G. Rizzo, “Signatures of long-lived gluinos in split supersymmetry”, JHEP
0409(2004) 070 [hep-ph/0408248].
[10] M. J. Strassler and K. M. Zurek, “Echoes of a hidden valley at hadron colliders”, Phys. Lett. B
651(2007) 374 [hep-ph/0604261].
[11] P. Schuster, N. Toro and I. Yavin, “Terrestrial and Solar Limits on Long-Lived Particles in a Dark Sector”, Phys. Rev. D
81(2010) 016002 [arXiv:0910.1602 [hep-ph]].
[12] J. Fan, M. Reece, J. T. Ruderman, “Stealth Supersymmetry,” [arXiv:1105.5135 [hep-ph]].
[13] The ATLAS Collaboration, “Search for displaced vertices arising from decays of new heavy
particles in 7 TeV pp collisions at ATLAS”, Phys. Lett. B
707(2012) 478 [arXiv:1109.2242
[hep-ex]].
[14] V. M. Abazov
et al.[D0 Collaboration], “Search for neutral, long-lived particles decaying into two muons in
pp¯ collisions at
√s=
1.96-TeV”, Phys. Rev. Lett.
97(2006) 161802 [hep-ex
/0607028].
[15] V. M. Abazov
et al.[D0 Collaboration], “Search for Resonant Pair Production of long-lived particles decaying to b anti-b in p anti-p collisions at s**(1
/2)
=1.96-TeV”, Phys. Rev. Lett.
103(2009) 071801 [arXiv:0906.1787 [hep-ex]].
[16] A. Heister
et al.[ALEPH Collaboration], “Search for gauge mediated SUSY breaking topologies in
e+e−collisions at center-of-mass energies up to 209-GeV,” Eur. Phys. J. C
25(2002) 339 [hep-ex
/0203024].
[17] ATLAS Collaboration, “Improved Luminosity Determination in pp Collisions at sqrt(s)
=7 TeV using the ATLAS Detector at the LHC”, ATLAS-CONF-2012-080 (2012)
[18] The ATLAS Collaboration, “The ATLAS Experiment at the CERN Large Hadron Collider”, JINST
3(2008) S08003.
[19] T. Sjostrand, S. Mrenna and P. Z. Skands, “PYTHIA 6.4 Physics and Manual,” JHEP
0605(2006) 026 [hep-ph
/0603175].
[20] A. Sherstnev and R. S. Thorne, “Parton distributions for the LHC”, Eur. Phys. J
C55(2009).
[21] W. Beenakker, R. Hopker and M. Spira, “PROSPINO: A Program for the production of supersymmetric particles in next-to-leading order QCD”, hep-ph
/9611232.
[22] P. M. Nadolsky, H. -L. Lai, Q. -H. Cao, J. Huston, J. Pumplin, D. Stump, W. -K. Tung and C. -P. Yuan, “Implications of CTEQ global analysis for collider observables”, Phys. Rev. D
78(2008) 013004 [arXiv:0802.0007 [hep-ph]].
[23] S. Frixione and B. R. Webber, “The MC@NLO 3.2 event generator”, hep-ph
/0601192.
[24] M. Bahr, S. Gieseke, M. A. Gigg, D. Grellscheid, K. Hamilton, O. Latunde-Dada, S. Platzer and P. Richardson
et al., “Herwig++Physics and Manual”, Eur. Phys. J. C
58(2008) 639
[arXiv:0803.0883 [hep-ph]].
[25] J. M. Butterworth, J. R. Forshaw and M. H. Seymour, “Multiparton interactions in photoproduction at HERA”, Z. Phys. C
72(1996) 637 [hep-ph/9601371].
[26] S. Agostinelli
et al.[GEANT4 Collaboration], “GEANT4: A Simulation toolkit”, Nucl. Instrum.
Meth. A
506(2003) 250.
[27] The ATLAS Collaboration, “The ATLAS Simulation Infrastructure”, Eur. Phys. J. C
70(2010) 823 [arXiv:1005.4568 [physics.ins-det]].
[28] S. R. Das, “On a new approach for finding all the modified cut-sets in an incompatibility graph”, IEEE Transactions on Computers v22(2) (1973) 187.
[29] The ATLAS Collaboration, “A study of the material in the ATLAS inner detector using secondary hadronic interactions”, JINST
7(2012) P01013 [arXiv:1110.6191 [hep-ex]].
[30] A. L. Read, “Presentation of search results: The CL(s) technique”, J. Phys. G G
28(2002) 2693.
[31] A. D. Martin, W. J. Stirling, R. S. Thorne and G. Watt, “Parton distributions for the LHC”, Eur.
Phys. J. C
63(2009) 189 [arXiv:0901.0002 [hep-ph]].
10 Supplemental material that will not go into paper
[mm]
τ c
1 10 10
210
32 0 1 0 l im it / 2 0 1 1 l im it
0 100 200 300 400
ATLAS
preliminary
MH ML HH
= 7 TeV s
Ratio of integrated luminosities
Figure 8: Plot showing improvement in limit as a function of
cτexpected from luminosity increase alone compared to the achieved improvements. Points above the line indicate improvement beyond additional luminosity. At small values of
cτthe performance is less than would naively be expected by the luminosity increase. This is due to the tightening of trigger, vertexing and muon reconstruction selections to deal with the 2011 running environment.
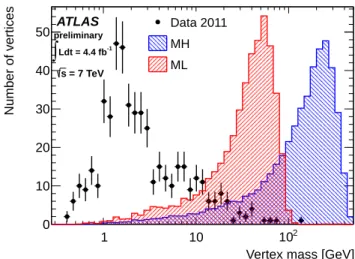
Vertex mass [GeV]
1 10 102
Number of vertices
0 10 20 30 40 50 ATLAS
preliminary Ldt = 4.4 fb-1
∫
= 7 TeV s
Data 2011 MH ML
Figure 9: Distribution of
mDVin data compared with two signal MC samples.
[mm]
τ c
1 10 102 103
Event selection efficiency
0 0.1 0.2 0.3 0.4 0.5 0.6
MH ML HH
ATLAS
simulation preliminary = 7 TeV s Re-tracking
No re-tracking
Figure 10: The event selection efficiency as a function of
cτfor the three signal samples with (solid lines, closed points) and without (dashed lines, open points) re-tracking. All systematic corrections and uncertainties are applied to the distributions corresponding to re-tracking, which are therefore shown as bands.
Figure 11: Distribution of radial position and azimuthal angle of DVs with at least three tracks associated
to them.
| [mm]
|zDV
0 50 100 150 200 250 300
[mm]DVr
0 20 40 60 80 100 120 140 160 180
0 0.1 0.2 0.3 0.4 0.5 0.6
ATLAS simulation preliminary s = 7 TeV