ATLAS-CONF-2014-060 13October2014
ATLAS-CONF-2014-060
October 12, 2014
Observation and measurement of Higgs boson decays to WW
⇤with ATLAS at the LHC
The ATLAS Collaboration
Abstract
We report the observation of the production of the Higgs boson in its decay toWW⇤based on an excess over background in the dilepton final state of 6.1 standard deviations, where the Standard Model expectation is 5.8 standard deviations. Evidence for the vector-boson fusion (VBF) production process is obtained with a significance of 3.2 standard deviations.
The results are obtained from a data sample corresponding to an integrated luminosity of 25 fb 1 from ps=7 and 8 TeV ppcollisions recorded by the ATLAS detector at the LHC.
For a Higgs boson mass of 125.36 GeV, the ratio of the observed to expected values of the total production cross section times branching fraction is 1.08+0.160.15(stat.)+0.160.13(syst.). The corresponding ratios for the gluon-gluon fusion and vector-boson fusion production mech- anisms are 1.01±0.19 (stat.)+0.200.17(syst.) and 1.28+0.440.40(stat.)+0.290.21(syst.), respectively. At ps=8 TeV, the total production cross sections are measured to be (gg!H!WW⇤) = 4.6±0.9 (stat.)+0.80.7(syst.) pb and (VBF H!WW⇤)=0.51+0.170.15(stat.)+0.130.08(syst.) pb. The fiducial cross section is determined for the gluon-gluon fusion process in exclusive final states with zero or one associated jet.
c Copyright 2014 CERN for the benefit of the ATLAS Collaboration.
Reproduction of this article or parts of it is allowed as specified in the CC-BY-3.0 license.
I. INTRODUCTION
In the Standard Model of particle physics (SM), the Higgs boson results from the Brout-Englert-Higgs mechanism [1]
that breaks the electroweak symmetry [2] and gives mass to the W andZ gauge bosons. It has a spin-parity of 0+, with couplings to massive gauge bosons that are precisely determined by their measured masses [3]. A new particle with spin and gauge-boson couplings compatible with those of the SM Higgs boson has been discovered by the ATLAS and CMS experiments at the LHC using the ZZ⇤, , and W W⇤ final states [4–8]. Measurements of the particle’s mass [8, 9] yield a value of approximately 125 GeV, consistent with the mass of the SM Higgs boson provided by a global fit to electroweak measurements [10]. The observed evidence of the production of the boson at the Tevatron [11]
and of the decay of the boson to fermions at the LHC [12], is also consistent with the properties of the SM Higgs boson.
The direct observation of the Higgs boson in individual decay channels provides an essential confirmation of the SM predictions. For a Higgs boson with a mass of 125 GeV, theH!W W⇤ decay has the second largest branching ratio (22%) and is a good candidate for observation. The sequential decayH!W W⇤!`⌫`⌫, where`is an electron or muon, is a sensitive experimental signature. Searches for this decay produced the first direct limits on the mass of the Higgs boson at a hadron collider [13, 14], and subsequent measurements [5–7] are among the most precise in determining the couplings and spin of the discovered particle.
The dominant Higgs boson production mode in high-energy hadron collisions is gluon-gluon fusion (ggF), where the interacting gluons produce a resonant Higgs boson predominantly through a top-quark loop. The next most abundant production mechanism, with a factor of twelve reduction in rate, is the fusion of vector bosons radiated by the interacting quarks into a Higgs boson (vector-boson fusion or VBF). At a further reduced rate, a Higgs boson can be produced in association with aW or Z boson (VH production). The leading-order production processes are depicted in Fig. 1.
This note describes the observation and measurement of the Higgs boson in its decay toW-boson pairs, with the Higgs boson produced by the ggF and VBF processes at center of mass energies of 7 and 8 TeV. The ggF production process probes Higgs boson couplings to heavy quarks, while the VBF and VH processes probe its couplings toW and Z bosons. The branching ratioBH!W W⇤ is sensitive to Higgs boson couplings to both fermions and bosons through the total width. To constrain these couplings, the production rate of the ggF and VBF mechanisms are measured—
individually and combined—and normalized by the SM predictions for a Higgs boson with mass 125.36 GeV [9] to obtain the corresponding “signal strength” parametersµ. The total production cross section for each process is also measured, along with fiducial cross sections for the ggF process.
A prior measurement of these processes with the same data set yielded a combined result of µ= 1.0±0.3 [5].
The results presented here supersede this measurement and contain improvements in signal acceptance, background determination and rejection, and the signal yield extraction. Together, these improvements increase the expected significance of an excess from Higgs boson decays toW W⇤ from 3.7 to 5.8 standard deviations, and they reduce the expected relative uncertainty on the correspondingµ measurement by 30%.
H
ggF production W⇤ W
W⇤ W q0
q0 VBF production
H
W
W⇤ VH production
¯ q q
V V
q q
V V g H
g
FIG. 1. Feynman diagrams for the leading production modes (ggF, VBF, and VH), where theV VHandqqHcoupling vertices are marked by•and , respectively. TheV represents aW orZ vector boson.
TABLE I. Backgrounds to theH!W W⇤measurement in the final state with two charged leptons (`=eorµ) and neutrinos, and no jet that contains abquark. Irreducible backgrounds have the same final state; other backgrounds are shown with the features that lead to this final state. First or second generation quarks are denoted asq, andjrepresents a jet of any flavor.
Name Process Feature(s)
W W W W Irreducible
Top quarks
t¯t t¯t!W b W¯b Unidentifiedbquarks t
⇢ tW Unidentifiedbquark
t¯b,tq¯b q orbmisidentified as`;
unidentifiedbquarks Misidentified leptons (Misid.)
Wj W+ jet(s) jmisidentified as ` jj Multijet production jj misidentified as``;
misidentified neutrinos Other dibosons8
><
>:
W misidentified ase
V V W ⇤,WZ,ZZ!`` `` Unidentified lepton(s)
ZZ!`` ⌫⌫ Irreducible
Z misidentified ase;
unidentified lepton Drell-Yan (DY)
ee/µµ Z/ ⇤!ee, µµ Misidentified neutrinos
⌧ ⌧ Z/ ⇤!⌧ ⌧!`⌫⌫ `⌫⌫ Irreducible
The note is organized as follows. Section II provides an overview of the signal and backgrounds, and of the data analysis strategy. Section III describes the ATLAS detector and data, and the event reconstruction. The selection of events in the di↵erent final states is given in Sec. IV. Sections V and VI discuss the modeling of the signal and the background processes, respectively. The signal yield extraction and the various sources of systematic uncertainties are described in Sec. VII. Section VIII provides the event yields and the distributions of the final discriminating variables.
The results are presented in Sec. IX, and the conclusions given in Sec. X.
II. ANALYSIS OVERVIEW
The H!W W⇤ final state with the highest purity at the LHC occurs when each W boson decays leptonically, W!`⌫, where`is an electron or muon. The analysis therefore selects events consistent with a final state containing neutrinos and a pair of opposite-charge leptons. The pair can be an electron and a muon, two electrons, or two muons. The relevant backgrounds to these final states are shown in Table I and are categorized asW W, top quarks, misidentified leptons, other dibosons, and Drell-Yan. The distinguishing features of these backgrounds, discussed in detail below, motivate the definition of event categories based on lepton flavor and jet multiplicity, as illustrated in Fig. 2. In the final step of the analysis, a profile likelihood fit is simultaneously performed on all categories in order to extract the signal from the backgrounds and measure its yield.
The Drell-Yan (DY) process is the dominant source of events with two identified leptons, and contributes to the signal final state when there is a mismeasurement of the net particle momentum in the direction transverse to the beam (individual particle momentum in this direction is denoted pt). The DY background is strongly reduced in events with di↵erent-flavor leptons (eµ), as these arise through fully leptonic decays of ⌧-lepton pairs with a small branching ratio and reduced lepton momenta. The analysis thus separates eµ events from those with same-flavor leptons (ee/µµ) in the event selection and the likelihood fit.
Pairs of top quarks are also a prolific source of lepton pairs, which are typically accompanied by high-momentum jets. Events are removed if they have a jet containing ab-hadron decay (bjet), but thet¯t background remains large due to inefficiencies in theb-jet identification algorithm. Events are therefore categorized by the number of jets, and the top-quark background provides a small contribution to the zero-jet category but represents a significant fraction of the total background in categories with one or more jets.
In events with two or more jets, the sample is separated by signal production process (“VBF-enriched” and “ggF-
nj= 0 nj= 1 nj 2
enriched VBF- ggF-
enriched ee/µµ
ee/µµ eµ
VBF-enriched selection
Pre-
eµ
eµ(8 TeV) eµ ee/µµ ggF-enriched
FIG. 2. Analysis divisions in categories based on jet multiplicity (nj) and lepton-flavor samples (eµandee/µµ). The most sensitive signal region for ggF production isnj= 0 ineµ, while for VBF production it isnj 2 ineµ. These two samples are underlined. Theeµsamples withnj1 are further subdivided as described in the text.
W+ H W
⌫ ⌫¯
`+ `
FIG. 3. Illustration of theH!W W decay. The small arrows indicate the particles’ directions of motion and the large double arrows indicate their spin projections. The spin-0 Higgs boson decays to W bosons with opposite spins, and the spin-1W bosons decay into leptons with aligned spins. The H and W boson decays are shown in the decaying particle’s rest frame.
Because of theV Adecay of the W bosons, the charged leptons have a small opening angle in the laboratory frame. This feature is also present when oneW boson is o↵its mass shell.
enriched”). The VBF process is characterized by two quarks scattered at a small angle, leading to two well-separated jets with a large invariant mass. These and other event properties are input to a boosted decision tree (BDT) algorithm [15] that yields a single-valued discriminant to isolate the VBF process. A separate analysis based on a sequence of individual selection criteria provides a cross-check to the BDT analysis. The ggF-enriched sample contains all events with two or more jets that do not pass either of the VBF selections.
Due to the large Drell-Yan and top-quark backgrounds in events with same-flavor leptons or with jets, the most sensitive signal region is in theeµ 0-jet final state. The dominant background to this category isW W production, which is e↵ectively suppressed by exploiting the properties of W-boson decays and the spin-0 nature of the Higgs boson (Fig. 3). This property generally leads to a lepton pair with a small opening angle and a correspondingly low invariant mass (m``), broadly distributed in the range below mH/2. The dilepton invariant mass is used to select signal events, and the signal likelihood fit is performed in two ranges ofm`` ineµfinal states withnj 1.
Other background components are distinguished bypt`2, the magnitude of the transverse momentum of the lower- pt lepton in the event (the “subleading” lepton). In the signal process one of theW bosons from the Higgs boson decay is o↵its mass shell, resulting in relatively low subleading leptonpt (peaking near 22 GeV, half the di↵erence between the Higgs-boson and W-boson masses). In background from W bosons produced in association with a jet or photon (misreconstructed as a lepton) or an o↵-shell photon producing a low-mass lepton pair (where one lepton
is not reconstructed), the pt`2 distribution falls rapidly with increasing pt. The eµ sample is therefore subdivided into three regions of subleading lepton momentum fornj 1. The jet and photon misidentification rates di↵er for electrons and muons, so this sample is further split by subleading lepton flavor.
Because of the neutrinos produced in the signal process, it is not possible to fully reconstruct the invariant mass of the final state. However, a “transverse mass” mt [16] can be calculated without the unknown longitudinal neutrino momenta:
mt= q
Et``+pt⌫⌫ 2 pt``+pt⌫⌫ 2, (1) where Et``=p
(pt``)2+ (m``)2, pt⌫⌫ (pt``) is the vector sum of the neutrino (lepton) transverse momenta, andpt⌫⌫
(pt``) is its modulus. The distribution has a kinematic upper bound at the Higgs boson mass, e↵ectively separating Higgs boson production from the dominant non-resonant W W and top-quark backgrounds. For the VBF analysis, the transverse mass is one of the inputs to the BDT distribution used to fit for the signal yield. In the ggF and cross-check VBF analyses, the signal yield is obtained from a direct fit to themtdistribution for each category.
Most of the backgrounds are modeled using Monte Carlo samples with a data-based normalization, and include theoretical uncertainties on the extrapolation from the normalization region to the signal region, and on the shape of the distribution used in the likelihood fit. For the W+jet(s) and multijet backgrounds, the high rates and the uncertainties in modeling misidentified leptons motivate a data-based model of the kinematic distributions. For a few minor backgrounds, the process cross sections are taken from theoretical calculations. Details of the background modeling strategy are given in Sec. VI.
The analyses of the 7 and 8 TeV data sets are separate, but use common methods where possible; di↵erences arise primarily because of the lower instantaneous and integrated luminosities in the 7 TeV data set. As an example, the categorization of 7 TeV data does not include a ggF-enriched category for events with at least two jets, since the expected significance of such a category is very low. Other di↵erences are described in the text or in dedicated subsections.
III. DATA SAMPLES AND RECONSTRUCTION
This section begins with a description of the ATLAS detector, the criteria used to select events during data-taking (triggers) and the data sample used for this analysis. A description of the event reconstruction follows. The Monte Carlo simulation samples used in this analysis are described next, and then di↵erences between the 2012 and 2011 analyses are summarized.
A. Detector and data samples
The ATLAS detector [17] is a multipurpose particle detector with approximately forward-backward symmetric cylindrical geometry. The experiment uses a right-handed coordinate system with the origin at the nominal pp interaction point at the center of the detector. The positivex-axis is defined by the direction from the origin to the center of the LHC ring, the positive y-axis points upwards, and thez-axis is along the beam direction. Cylindrical coordinates (r, ) are used in the plane transverse to the beam, with the azimuthal angle around the beam axis.
Transverse components of vectors are indicated by the subscript T. The pseudorapidity is defined in terms of the polar angle✓as⌘= ln tan(✓/2).
The inner tracking detector (ID) consists of a silicon-pixel detector, which is closest to the interaction point, a silicon-strip detector surrounding the pixel detector—both covering up to|⌘|= 2.5—and an outer transition-radiation straw-tube tracker (TRT) covering|⌘|<2. The TRT also provides substantial discriminating power between electrons and pions over a wide energy range. The ID is surrounded by a thin superconducting solenoid providing a 2 T axial magnetic field.
A highly segmented lead/liquid-argon (LAr) sampling electromagnetic calorimeter measures the energy and the position of electromagnetic showers with |⌘|<3.2. The LAr calorimeter includes a presampler (for |⌘|<1.8) and three sampling layers, longitudinal in shower depth, up to |⌘|<2.5. The LAr sampling calorimeters are also used to measure hadronic showers in the endcap (1.5<|⌘|<3.2) and both electromagnetic and hadronic showers in the forward (3.1<|⌘|<4.9) regions, while an iron/scintillator tile calorimeter measures hadronic showers in the central region (|⌘|<1.7).
The muon spectrometer (MS) surrounds the calorimeters and is designed to detect muons in the pseudorapidity range|⌘|<2.7. The MS consists of one barrel (|⌘|<1.05) and two endcap regions. A system of three large super- conducting aircore toroid magnets, each with eight coils, provides a magnetic field with a bending integral of about
TABLE II. Trigger summary of minimum lepton pt requirements (in GeV) during the 8 TeV data taking. For single-lepton triggers, the hardware and software thresholds are 18 and 24i or 30 and 60, respectively. The “i” denotes an isolation requirement that is less restrictive than the isolation requirement imposed in the o✏ine selection. For dilepton triggers, the pair of thresholds corresponds to the leading and subleading lepton, respectively; the “µ, µ” dilepton trigger requires only a single muon at Level-1.
The “and” and “or” are logical.
Name Level-1 trigger High-level trigger Single lepton
e 18 or 30 24i or 60
µ 15 24i or 36
Dilepton
e,e 10 and 10 12 and 12
µ,µ 15 and 0 18 and 8
e,µ 10 and 6 12 and 8
2.5 T·m in the barrel and up to 6 T·m in the endcaps. Monitored drift tube chambers in both the barrel and endcap regions and cathode strip chambers covering 2.0<|⌘|<2.7 are used as precision-measurement chambers, whereas resistive plate chambers in the barrel and thin gap chambers in the endcaps are used as trigger chambers, covering up to|⌘|= 2.4. The chambers are arranged in three layers, so high-pt particles traverse at least three stations with a lever arm of several meters.
A three-level trigger system selects events to be recorded for o✏ine analysis. The first level (Level-1 trigger) is hardware-based, and the second two levels (High-level trigger) are software-based. This analysis uses events selected with triggers that required either a single lepton or two leptons (dilepton). The single-lepton triggers had more restrictive lepton identification requirements and higherptthresholds than the dilepton triggers. The specific triggers used for the 8 TeV data with the corresponding thresholds at the hardware and software levels are listed in Table II.
O✏ine, two leptons—either ee,µµ or eµ—with opposite charge are required. The leading lepton (`1) is required to havept 22 GeV and the subleading lepton (`2) is required to havept 10 GeV.
The efficiency of the trigger requirements is measured using a tag-and-probe method with a data sample of Z/ ⇤!ee, µµ candidates. For muons, the single-lepton trigger efficiency varies with ⌘ and is approximately 70%
for |⌘|<1.05 and 90% for |⌘|>1.05. For electrons, the single-lepton trigger efficiency increases with pt, and its average is approximately 90%. These trigger efficiencies are for leptons that satisfy the analysis selection criteria described below. Dilepton triggers increase the signal acceptance by allowing lower leading-leptonpt thresholds to be applied o✏ine while still remaining in the fully-efficient kinematic range of the trigger.
The data are subjected to quality requirements: events recorded when the relevant detector components were not operating correctly are rejected. The resulting integrated luminosity is 20.3 fb 1 taken at ps= 8 TeV in 2012 and 4.5 fb 1 at 7 TeV in 2011. In the 2011 and 2012 data-taking conditions, multiple inelastic pp interactions occured in each bunch crossing. The mean number of inelastic collisions per bunch crossing had an average value of 20 in 2012 and 8.8 in 2011. Overlapping signals in the detector due to these multiple interactions, as well as signals due to interactions occuring in other nearby bunch crossings are referred to as “pile-up.”
B. Event reconstruction
The primary vertex of each event must have at least three tracks with pt 400 MeV and is selected as the vertex with the largest value of⌃(pt)2, where the sum is over all the tracks associated to that particular vertex.
Muon candidates are identified by matching a reconstructed ID track with a reconstructed MS track [18]. The MS track is required to have a track segment in all three layers of the MS. The ID tracks are required to have a minimum number of associated hits in each of the ID subdetectors to ensure good track reconstruction. This analysis uses muon candidates referred to as “combined muons” in Ref. [18], in which the track parameters of the MS track and the ID track are combined statistically. Muon candidates are required to have|⌘|<2.50.
Electron candidates are clusters of energy deposited in the electromagnetic calorimeter associated with ID tracks [19].
All candidate electron tracks are fitted using a Gaussian-sum filter [20] (GSF) to account for bremsstrahlung energy losses. The GSF fit reduces the di↵erence between the energy measured in the calorimeter and the momentum measured in the ID and improves the measured electron direction and impact parameter resolutions. The impact parameter is the distance of closest approach in the transverse plane of the lepton track trajectory to the reconstructed position of the primary vertex. The electron transverse energy is computed from the cluster energy and the track
direction at the interaction point.
Electron identification is restricted to the range|⌘|<2.47, excluding the transition region between the barrel and end-cap EM calorimeters, 1.37<|⌘|<1.52. The identification is based on criteria that require the longitudinal and transverse shower profiles to be consistent with those expected for electromagnetic showers, the track and cluster positions to match in⌘ and , and the presence of high-threshold TRT hits. The electron identification has been im- proved relative to that described in Ref. [5] by adding a likelihood-based method in addition to the cut-based method.
The likelihood allows the inclusion of discriminating variables which are difficult to use with explicit requirements without incurring significant efficiency losses. Detailed discussions of the likelihood identification and cut-based iden- tification and the corresponding efficiency measurements can be found in Ref. [21]. Electrons with 10< Et<25 GeV are required to satisfy the “very tight” likelihood requirement, which reduces backgrounds from light-flavor jets and photon conversions by 35% with respect to the cut-based selection with the same signal efficiency. ForEt>25 GeV, where misidentification backgrounds are less important, electrons are required to satisfy the “medium” cut-based requirement. The single-lepton trigger applies the medium cut-based selection requirements. Using a likelihood-based selection criterion in addition to this cut-based requirement would result in a loss of signal efficiency without sufficient compensation in background rejection. Finally, additional requirements reduce the contribution of electrons from photon conversions by rejecting electron candidates that have an ID track that is part of a conversion vertex or that do not have a hit in the innermost layer of the pixel detector.
To further reduce backgrounds from non-prompt leptons, additional requirements are imposed on the lepton impact parameter and isolation. The significance of the transverse impact parameter, defined as the measured transverse impact parameter d0 divided by its estimated uncertainty, d0, is required to satisfy |d0|/ d0<3.0; the longitudinal impact parameterz0 must satisfy the requirement|z0sin✓|<0.4 mm for electrons and 1.0 mm for muons.
Lepton isolation is defined using both track-based and calorimeter-based quantities. More details about the def- inition of electron isolation can be found in Ref. [21]. The track isolation is based on the scalar sum, ⌃pt, of all tracks with pt>400 MeV for electrons andpt>1 GeV for muons that are found in a cone in⌘- space with respect to the lepton, excluding the lepton track. Tracks used in this scalar sum are required to be consistent with coming from the primary vertex. The cone size is R= 0.4 forpt<15 GeV, where R=p
( )2+ ( ⌘)2, and R= 0.3 for pt>15 GeV. The track isolation requires that⌃pt divided by the electron Et (muon pt) be less than 0.06 at the lowestEt (pt) and less than 0.10 (0.12) at the highestEt (pt).
The calorimeter isolation selection criterion—like the track isolation—is based on a ratio. The relative calorimetric isolation for electrons is computed as the sum of the cluster transverse energies,⌃Et, of surrounding energy deposits in the electromagnetic and hadronic calorimeters inside a cone of R= 0.3 around the candidate electron cluster, divided by the electronEt. The cells within 0.125⇥0.175 in⌘⇥ around the electron cluster barycenter are excluded.
The pile-up and underlying event contribution to the calorimeter isolation is estimated and subtracted event-by-event.
The electron relative calorimetric isolation requirement varies monotonically with electron Et: its upper bound is 0.20 for 10< Et<15 GeV, increasing to 0.28 forEt>25 GeV. In the case of muons, the relative calorimetric isolation discriminant is defined as the⌃Etcalculated from calorimeter cells within R= 0.3 of the muon candidate, and with energy above some noise threshold, divided by the muon pt. All calorimeter cells within the range R <0.05 of the muon candidate are excluded from⌃Et. A correction based on the number of reconstructed primary vertices in the event is made to⌃Et that compensates for extra energy due to pile-up. The muon relative calorimetric isolation also varies monotonically with muonpt; its upper bound is 0.06 for 10< pt<15 GeV, increasing to 0.28 forpt>25 GeV.
The efficiencies of the impact parameter and isolation requirements are measured using a tag-and-probe method with a data sample ofZ/ ⇤!ee, µµcandidates.
Jets are reconstructed using the anti-ktsequential recombination clustering algorithm [23] with a radius parameter R= 0.4. The inputs to the reconstruction are three-dimensional clusters of energy [24, 25] in the calorimeter. The algorithm for this clustering suppresses noise by keeping only cells with a significant energy deposit and their neigh- boring cells. To take into account the di↵erences in calorimeter response between electrons and photons and hadrons, each cluster is classified, prior to the jet reconstruction, as coming from an electromagnetic or hadronic shower using information from its shape. Based on this classification, the local-cell-signal-weighting (LCW) calibration method [26]
applies dedicated corrections for the e↵ects of calorimeter non-compensation, signal losses due to noise threshold e↵ects and energy lost in non-instrumented regions. Jets are corrected for contributions from in-time and out-of-time pile-up [27], and the position of the primary interaction vertex. Subsequently, the jets are calibrated to the hadronic energy scale usingpt- and⌘-dependent correction factors determined in a first pass from simulation and then refined in a second pass from data [25, 26]. The systematic uncertainty on these correction factors is determined from the same control samples in data.
To reduce the number of jet candidates originating from pile-up vertices, a requirement is imposed on the jet vertex fraction, denotedjvf: jets withpt<50 GeV and|⌘|<2.4 are required to have more than 50% of the summed scalar pt of their tracks within R= 0.4 around the jet axis associated with the primary vertex (jvf>0.50) [28]. jvfis assigned a value of 1 if there are no tracks associated to the jet.
For the purposes of classifying an event in terms of jet multiplicity, nj, a jet is required to haveptj>25 GeV for
|⌘j|<2.4, andptj>30 GeV if 2.4|⌘j|<4.5. The increased threshold in the higher-|⌘|region suppresses jets from pile-up. The two highest-pt jets (j1, j2, ordered in pt) are the “VBF jets” used to compute dijet variables in the VBF-enhancednj 2 category.
Additional jets not counted innj have lower thresholds in three scenarios. First, those used to reject events because they lie in the ⌘ range spanned by the two leading jets in the VBF-enriched selection (see Sec. IV C) are required to have ptj>20 GeV. Second, the jets for b-jet identification—described below—are required to have ptj>20 GeV.
Lastly, the jets used for the calculation of soft hadronic recoil (see Sec. IV A and the frecoil definition therein) are required to haveptj>10 GeV without thejvfrequirement. The calibration procedure described above is applied only to jets withptj>20 GeV. Jets with 10 GeV< ptj<20 GeV are used only in thefrecoil definition, and the efficiency for the requirements on this quantity are measured directly from the data, so the analysis is not sensitive to the modeling of the energy scale of these soft jets in the Monte Carlo simulation.
The identification ofb-quark jets (bjets) is limited to the acceptance of the ID (|⌘|<2.5). Thebjets are identified with a multivariate technique—the MV1 algorithm [29]—which is based on quantities that separatebandcjets from
“light jets” with light-flavor quarks and gluons. The inputs [30] to this algorithm use quantities such as the presence of secondary vertices, the impact parameters of tracks, and the topologies of weak heavy quark decays. The efficiency for identifying b jets is measured [31] in a high-statistics data sample of dilepton t¯t pair candidates. An operating point that is 85% efficient for identifying bjets is adopted. At this operating point, the probability of misidentifying a light jet as containing ab jet is 10.3%.
Two leptons or a lepton and a jet may be close in⌘- space. The following procedure has been adopted in the case of overlapping objects. Electron candidates that have tracks that extend to the MS are removed. If a muon candidate and an electron candidate are separated by R <0.1, then the muon is retained, and the electron is removed. These cases usually indicate a muon that has undergone bremsstrahlung in the ID material or calorimeter. A high-ptelectron is always reconstructed as a jet, so if an electron and the nearest jet are separated by less than R= 0.3, the jet is removed. In contrast, if a muon and a jet are separated by less than R= 0.3, the muon candidate is removed, as it is more likely to be a non-prompt muon from heavy flavor decay. Finally, due to early bremsstrahlung, a prompt electron may produce more than one electron candidate in its vicinity. In the case of two electrons separated by less than R= 0.1, the electron candidate with largerEt is retained.
The signature of a high-momentum neutrino is a momentum imbalance in the transverse plane. The reconstruction of this “missing” transverse momentum [32] is calculated as the negative vector sum of the momentum of objects selected according to ATLAS identification algorithms, such as leptons, photons, and jets, and of the remaining “soft”
objects that typically have low values ofpt. The calculation can thus be summarized as Emisst = ✓ X
selected
pt+X
soft
pt◆
, (2)
where the soft object reconstruction and the choice of selected objects di↵er between di↵erent methods of evaluating the missing transverse momentum. Three methods of reconstructing the missing transverse momentum are used in this analysis;Emisst is used to represent one particular method, as described below.
The large coverage in rapidity (y) of the calorimeter and its sensitivity to neutral particles motivate a calorimeter- based reconstruction of the missing transverse momentum. Selected objects are defined as the leptons selected by the analysis, and photons and jets withEt>20 GeV. The transverse momenta of these objects are added vectorially using object-specific calibrations. For the remaining soft objects, calibrated calorimeter cluster energy measurements are used to determine their net transverse momentum. The resulting missing transverse momentum is denotedEmisst . The significant pileup present in the data degrades the resolution of the calorimeter-based measurement of missing transverse momentum. AnO(20%) improvement in resolution is obtained using a track-based measurement of the soft objects, where the tracks are required to havept>0.5 GeV and originate from the primary vertex. Tracks associated with identified leptons or jets are not included, as these selected objects are added separately to the calculation of the missing transverse momentum. This reconstruction of missing transverse momentum, denoted pmisst , is used in the final fit to the mt distribution and improves the signal resolution relative to the Emisst used for the previous measurement [5]. Figure 4 shows the expected resolution for the magnitude of Emisst and pmisst (Emisst and pmisst respectively), and for mt in the nj= 0 category, all evaluated by subtracting the reconstructed quantity from the corresponding quantity obtained using generated leptons and neutrinos in ggFH!W W⇤ events. The r.m.s. of the mt di↵erence reduces from 19 GeV to 14 GeV when usingpmisst instead ofEmisst in the reconstruction. The improved resolution significantly increases the discrimination between signal and certain background processes (such asW+ ).
A simplified version of pmisst is used to suppress the Drell-Yan background in events with same-flavor leptons.
This definition, denotedpmiss (trk)t , di↵ers frompmisst in that the tracks associated to jets are also used, replacing the calorimeter-based jet measurement. This tends to align pmiss (trk)t with the jet(s) in Drell-Yan events, while in signal
Unit normalized
0 0.01 0.02 0.03
-100 -50 0 50 100
Unit normalized
0 0.02 0.04 0.06
miss
pT
RMS=12.4
miss
ET
RMS=15.9
miss
pT
Using RMS=14.1
miss
ET
Using RMS=18.8 (b)
[GeV]
mT
Reco. - Gen. for (a)
[GeV]
miss
ET miss or pT
Reco. - Gen. for
ATLAS Simulation Prelim.
WW*
MC sample for ggF H→
FIG. 4. Resolutions of (a) missing transverse momentum and (b) mt for the ggF signal MC in the nj= 0 category. The comparisons are made between the calorimeter-based reconstruction (Etmiss) and the track-based reconstruction (pmisst ) of the soft objects (see Eqn. 2). The resolution is measured as the di↵erence of the reconstructed (Reco) and generated (Gen) quantities; the r.m.s. values of the distributions are given with the legends in units of GeV.
eventspmiss (trk)t generally remains in the direction of the neutrinos. Incorporating the relative direction ofpmiss (trk)t with respect to jets in the event selection thus improves Drell-Yan rejection.
The relative direction of Emisst with respect to leptons and jets also improves Drell-Yan rejection, particularly in the case of⌧ ⌧ production whereEmisst tends to align with a final-state lepton. A relative quantityEmisst,rel is defined as follows:
Etmiss,rel =
⇢Emisst sin near if near<⇡/2
Emisst otherwise, (3)
where near is the azimuthal separation of the Emisst and the nearest high-pt lepton or jet. A similar calculation definespmisst,rel andpmiss (trk)t,rel .
C. Monte Carlo samples
Given the large number of background contributions to the signal region and the broadly peaking signal mt
distribution, Monte Carlo modeling is an important aspect of the analysis. Dedicated samples are generated to evaluate all but theW+jets and multijet backgrounds, which are estimated using data (see Sec. VI C). Most samples
use the powheg [33] generator to include corrections at next-to-leading order in ↵S (NLO). In cases where higher parton multiplicities are important, alpgen [34] orsherpa [35] provide merged calculations at leading order in↵S
(LO) for up to five additional partons. In a few cases, only LO generators (such asacermc[36] orgg2vv[37]) are available. Table III shows the generator and cross section used for each process.
The matrix-element-level Monte Carlo calculations are matched to a model of the parton shower, underlying event and hadronization, using either pythia6 [38], pythia8 [39], herwig [40] (with underlying event modeled byjimmy[41]), orsherpa. Input parton distribution functions (PDF) are taken fromct10 [42] for thepowhegand sherpa samples andcteq6L1 [43] foralpgen+herwig andacermc samples. The Z/ ⇤ sample is reweighted to themrstmcal PDF set [44].
Pileup interactions are modeled with pythia8, and the ATLAS detector response is simulated [45] using either geant4 [46] orgeant4 combined with a parametrizedgeant4-based calorimeter simulation [47]. Events are filtered during generation where necessary, allowing up to 2 ab 1 of equivalent luminosity for high cross section processes like Z/ ⇤ in the VBF category.
The ggF and VBF production modes for theH!W W⇤ signal are modeled withpowheg+pythia8, as shown in Table III. A detailed description of these processes and their modeling uncertainties is given in Sec. V. The smaller contribution from the VH process, with subsequent H!W W⇤ decay, is also shown in Table III. Not shown are the H ! ⌧ ⌧ MC samples, which have an even smaller contribution but are included in the signal modeling for completeness using the same generators as for theH!W W⇤ decay.
Cross sections are calculated for the dominant diboson and top-quark processes as follows: the inclusive W W cross section is calculated to NLO with mcfm [48]; non-resonant gluon fusion is calculated and modeled to LO with gg2vv, including both W W and ZZ production and their interference; t¯t production is normalized to the calculation at next-to-next-to-leading order in↵S (NNLO) with resummation of higher order terms to next-to-next- to-leading log (NNLL), evaluated withtop++2.0 [49]; and single-top processes are normalized to NNLL following the calculation from Refs. 50, 51 and 52 for thes-channel,t-channel, andW tprocesses, respectively. TheW W kinematics are modeled using thepowheg+pythia8 sample for the nj1 categories and the merged multi-legsherpasample for thenj 2 categories, as described in Sec. VI A. The section also describes the normalization of the double parton interaction process (q¯q!W) + (q¯q!W), which is modeled using the pythia8 generator. For W W, WZ, and ZZ production via non-resonant vector-boson scattering, thesherpagenerator provides the LO cross section and is used for event modeling. The negligible VBSZZ process is not shown in the table, though it is included in the background modeling for completeness.
The process W ⇤ is defined as associated W +Z/ ⇤ production, where there is an opposite-charge same-flavor lepton pair with invariant massm`` less than 7 GeV. This process is modeled usingsherpawith up to one additional parton. The rangem``>7 GeV is simulated withpowheg+pythia8 and normalized to thepowheg cross section.
The use of sherpa for W ⇤ is due to the inability of powheg+pythia8 to model invariant masses down to the dielectron production threshold. The sherpa sample requires two leptons with pt>5 GeV and |⌘|<3. The jet multiplicity is corrected using a sherpasample generated with 0.5< m``<7 GeV and up to two additional partons, while the total cross section is corrected using the ratio of the mcfm NLO to sherpaLO calculations in the same restricted mass range. A similar procedure is used to modelZ ⇤, defined asZ/ ⇤pair-production with one same-flavor opposite-charge lepton pair havingm``4 GeV and the other having m``>4 GeV.
TheW and Drell-Yan processes are modeled usingalpgen+herwig with merged LO calculations of up to five jets. The merged samples are normalized to the NLO calculation of mcfm (for W ) or the NNLO calculation of DYNNLO [53] (for Z/ ⇤). TheW sample is generated with the requirementspt>8 GeV and R( ,`)>0.25. An NNLO W calculation [54] finds a correction of less than 8% in the modeled phase space, within the uncertainty of the NLO calculation.
Asherpasample is used to accurately model theZ(!``) background. The photon is required to havept>8 GeV and R( ,`)>0.1; the lepton pair must satisfym``>10 GeV. The cross section is normalized to NLO usingmcfm.
Events are removed from the Drell-Yanalpgen+herwig samples if they overlap with the kinematics defining the sherpaZ(!``) sample.
The uncertainties are discussed for each specific background in Sec. VI, and their treatment in the likelihood fit is summarized in Sec. VII.
D. Modifications for 7 TeV data
The 7 TeV data are selected using single lepton triggers with a muon pt threshold of 18 GeV and with varying electronpt thresholds (20 or 22 GeV depending on the data taking period). The identification of the electrons uses the “tight” cut-based selection described in Ref. 55 over the entire Et range, and the GSF fit is not used. Muons are identified with the same selection used for the analysis of the 8 TeV data. The lepton isolation requirements are
TABLE III. Monte Carlo samples used to model the signal and background processes. The corresponding cross section times branching fraction, · B, is quoted at ps= 8 TeV. The branching fraction includes the decayst!W b, W!`⌫, andZ!``
(except for ZZ!`` ⌫⌫, which uses this branching ratio). Here ` refers to e, µ, or ⌧ for signal and background processes.
The neutral currentZ/ ⇤is denoted asZ or ⇤, depending on the mass of the produced lepton pair. Vector-boson scattering (VBS) and vector-boson fusion (VBF) background processes include all leading-order diagrams with no QCD vertices, except for diagrams with Higgs bosons, which only appear in the signal processes.
Process MC generator · B
(pb) Signal
ggF H!W W⇤ powheg+pythia8 0.435 VBF H!W W⇤ powheg+pythia8 0.0356
VH H!W W⇤ pythia8 0.0253
W W
q¯q!W W andqg!W W powheg+pythia6 5.68
gg!W W gg2vv+herwig 0.196
(qq¯!W) + (qq¯!W) pythia8 0.480
q¯q!W W sherpa 5.68
VBSW W+ 2 jets sherpa 0.0397
Top quarks
t¯t powheg+pythia6 26.6
W t powheg+pythia6 2.35
tq¯b acermc+pythia6 28.4
t¯b powheg+pythia6 1.82
Other dibosons (V V)
W (pt>8 GeV) alpgen+herwig 369
W ⇤ (m``7 GeV) sherpa 12.2
WZ (m``>7 GeV) powheg+pythia8 12.7
VBSWZ+ 2 jets sherpa 0.0126
(m``>7 GeV)
Z (pt>8 GeV) sherpa 163
Z ⇤ (min.m``4 GeV) sherpa 7.31 ZZ (m``>4 GeV) powheg+pythia8 0.733 ZZ!`` ⌫⌫ (m``>4 GeV) powheg+pythia8 0.504 Drell-Yan
Z (m``>10 GeV) alpgen+herwig 16500
VBFZ+ 2 jets sherpa 5.36
(m``>7 GeV)
tighter than in the 8 TeV analysis due to a statistically and systematically less precise estimation of the backgrounds with misidentified leptons. The jet-ptthresholds are the same as in the 8 TeV analysis, but due to less severe pile-up conditions, the requirement on the jet vertex fractionjvf>0.75 can be stricter without a compromising loss in signal efficiency.
IV. EVENT SELECTION
Lepton and jet reconstruction and identification criteria have been discussed in Sec. III. After the initial requirements based on the data quality, trigger and leptonpt threshold, a sample of events with two identified leptons is selected.
Events with more than two identified leptons withpt>10 GeV are rejected.
After the leptons have been required to have opposite charge and pass theptthreshold requirements, theeµsample of approximately 1.33⇥105 events is composed primarily of contributions fromZ/ ⇤!⌧ ⌧ andt¯t, and approximately 800 expected signal events. Theee/µµsample of 1.6⇥107events is dominated byZ/ ⇤!ee, µµproduction, which is significantly reduced (by approximately 90%) by removing theZ-boson resonance by requiring|m`` mZ|>15 GeV.
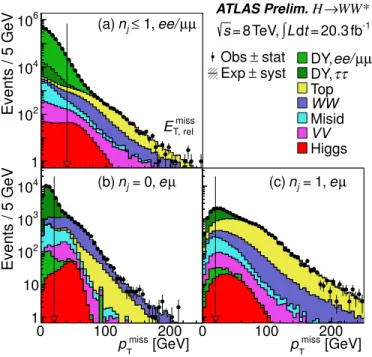
Low mass Drell-Yan and meson resonances are removed with the requirementm``>10 GeV (12 GeV) for theeµ(ee/µµ) samples. Further reduction of the Drell-Yan, W+jets and multijets (Misid.) processes is achieved through the re- quirements on the missing transverse momentum distribution. Figure 5a shows the Emisst,rel distrbution in the nj1
Events / 5 GeV
1 102
104
106
0 100 200
Events / 5 GeV
1 10 102
103
104
00 100 200
stat Obs ±
syst Exp ±
µ µ ee/
DY,ττ DY, Top WW Misid VV Higgs µ
ee/µ ,
≤1 nj
(a)
miss T, rel
E
µ e , 0
j= n (b)
[GeV]
miss
pT
µ e , 1
j= n (c)
[GeV]
miss
pT
ATLAS Prelim.H→WW*
fb-1
20.3
= t d
∫L TeV, 8
= s
FIG. 5. Missing transverse momentum distributions. The plots for Etmiss and pmisst (see Eqn. 2) are made after applying the pre-selection criteria common to allnj categories (see Table IV). The observed data points (Obs,•) with their statistical uncertainty (stat) are compared with the histograms representing the cumulative expected contributions (Exp, –), for which the systematic uncertainty (syst) is represented by the shaded band. The band accounts for experimental and theoretical uncertainties on the acceptance for background and signal and is only visible in the tails of the distributions. Of the listed contributions (see Table I), the dominant Drell-Yan (DY) backgrounds peak at low values. The legend order follows the histogram stacking order of the plot in (a) or as noted in later figures; the others follow a di↵erent order to best display the shapes of the contributions. The arrows mark the selections.
ee/µµsample, where the dominant Z/ ⇤!ee, µµcontribution is suppressed with aEtmiss,rel>40 GeV requirement. In the eµ sample, in the nj1 and nj 2 ggF-enriched categories, a pmisst >20 GeV requirement is applied to signifi- cantly reduce theZ/ ⇤!⌧ ⌧ background component and backgrounds with a misidentified lepton (see Fig. 5b and 5c for the nj1 categories). The eµ nj 2 VBF-enriched sample has no missing transverse momentum requirement, recovering signal acceptance for the statistically-limited VBF measurement. In theee/µµsampleEtmiss>45 GeV and pmisst >40 GeV requirements are applied. Table IV summarizes these pre-selection criteria.
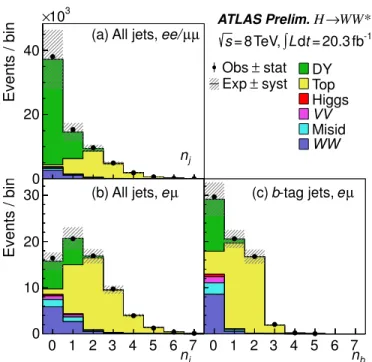
The di↵erent background compositions in each jet multiplicity category motivate the division of the data sample based on the number of jets present in the event,nj. Figures 6a and 6b show the jet multiplicities distributions in the ee/µµ andeµ samples, respectively. Even after the missing transverse momentum requirements, theZ/ ⇤!ee, µµ background dominates theee/µµ nj1 samples. The top background becomes more significant at higher jet multi- plicties and its suppression is primarily based on the multiplicity ofb-tag jets in the events, shown in Fig. 6c for the eµsample.
In each of these lepton-flavor samples andnj-bin categories, further criteria are chosen to optimize the precision of the signal measurement (also shown in Table IV). They are described in Sec. IV A to IV D, where the discriminating distributions and event yields are also shown. Section IV E details the selection modifications for the 7 TeV data analysis, and Sec. IV F concludes with the distributions after all the selection requirements have been applied. In the following event yield tables and plots, the normalization of the background processes follows the methods described in Sec. VI. The distributions in the figures and the signal rates in the tables for the Higgs boson correspond to the expectations for a Standard Model Higgs boson with a mass of mH= 125 GeV. The VBF contribution includes the VH production unless stated otherwise.
A. nj= 0 jet category
The mismeasurement of the missing transverse momentum is suppressed by requiring pmisst to point away from the dilepton transverse momentum ( ``,met>⇡/2). Without a reconstructed jet to balance the dilepton system,
Events / bin
0 20 40
103
×
0 1 2 3 4 5 6 7
Events / bin
0 10 20 30
×10
0 1 2 3 4 5 6 7 0
stat Obs ±
syst Exp ±
DY Top Higgs VV Misid WW µ
ee/µ (a) All jets,
nj
µ e (b) All jets,
nj
µ e -tag jets, b
(c)
nb
ATLAS Prelim.H→WW*
fb-1
20.3
= t d
∫L TeV, 8
= s
FIG. 6. Jet multiplicity distributions for all jets (nj) andb-tag jets (nb). The plots are made after applying the pre-selection criteria common to allnj categories (see Table IV). See Fig. 5 for plotting details.
the magnitude of the dilepton momentumpt`` is expected to be small in DY events. A requirement of pt``>30 GeV reduces the DY contribution while retaining the majority of the signal events, as shown for theeµsample in Fig. 7a.
After these criteria the DY background is sufficiently reduced in theeµsample, but still dominates in theee/µµone.
In the latter sample, a requirement ofpmiss (trk)t,rel >40 GeV provides further DY rejection.
Discriminating between the continuumW W production and the resonant Higgs boson production processes exploits the spin-0 property of the Higgs boson, which when combined with the V-A nature of the W-boson decay leads to a small opening angle between the charged leptons (Sec. II). A requirement of ``<1.8 reduces both W W and DY background, while retaining 90% of the signal. A related requirement ofm``<55 GeV combines the small lepton opening angle with the kinematics of a low-mass Higgs boson (atmH= 125 GeV). The m`` and `` distributions are shown in Fig. 7b and Fig. 7c.
An additional discriminant,frecoil, based on soft jets is defined to reduce the remaining DY contribution in theee/µµ sample. The DY background passes the event selection primarily when the measurement of the energy associated with partons from initial state radiation is underestimated, resulting in an apparent imbalance of transverse momentum in the event. To further reduce such mis-measured DY events, jets withptj>10 GeV, within a ⇡/2 wedge in (^) centered on pt``, are used to define a fractional jet recoil relative to the dilepton transverse momentum:
frecoil= X
jetsjin^
jvfj·ptj pt``. (4)
To suppress the contribution from jets originating from pileup interactions, the jet transverse momenta are weighted by their associatedjvfvalue. Thefrecoil distribution is shown in Fig. 7d; a requirement offrecoil<0.1 in theee/µµ sample reduces the DY background in this final state by a factor of seven.
The signal and background yields at each stage of selection are shown in Table V. The yields in the range
3
4mH< mt< mH are also shown. This region contains the majority of the signal but a reduced background con- tribution.
B. nj= 1 jet category
Allowing for the presence of a jet significantly increases the background from top-quark production. Since top quarks decay toW b, jets with jets withpt>20 GeV are rejected if they are identified as containing ab-quark (nb= 0, see Fig. 6c). With this requirement theW W and DY processes once again dominate, as shown in Table VI.
TABLE IV. Event selection summary. Selection requirements specific to theeµand ee/µµ lepton-flavor samples are noted as such; otherwise, they apply to both; a dash (-) indicates no selection. Fornj 2 VBF,Cj3 (C`) denotes the centralities of the extra jet (lepton) as defined in the text;metdenotes all types of missing transverse momentum. Values are given for the analysis of 8 TeV data for mH= 125 GeV; the modifications for 7 TeV are given in Sec. IV E. All energy-related values are in
GeV.
Objective ggF-enriched VBF-enriched
nj= 0 nj= 1 nj 2 ggF nj 2 VBF
Pre-selection Allnj
8>
>>
><
>>
>>
:
pt`1>22 for the leading lepton`1
pt`2>10 for the subleading lepton`2
Opposite charge leptons m``>10 for theeµsample m``>12 for theee/µµsample
|m`` mZ|>15 for theee/µµsample
pmisst >20 foreµ pmisst >20 foreµ pmisst >20 foreµ Nometrequirement foreµ Etmiss,rel>40 foree/µµ Etmiss,rel>40 foree/µµ - -
Reject backgrounds DY
8>
<
>:
pmiss (trk)t,rel >40 foree/µµ pmiss (trk)t,rel >35 foree/µµ - pmisst >40 foree/µµ frecoil<0.1 foree/µµ frecoil<0.1 foree/µµ - Emisst >45 foree/µµ pt``>30 m⌧ ⌧< mZ 25 m⌧ ⌧< mZ 25 m⌧ ⌧< mZ 25
``,met>⇡/2 - - -
Misid. - m`t>50 foreµ - -
Top (n
j= 0 nb= 0 nb= 0 nb= 0
- - - ptsum inputs to BDT
- - - ⌃m`jinputs to BDT
VBF topology
- -
See Sec. IV D for rejection of VBF &
VH (W, Z!jj), whereH!W W⇤
mjj inputs to BDT yjj inputs to BDT
⌃C` inputs to BDT C`1<1 andC`2<1 Cj3>1 forj3 withptj3>20 OBDT 0.48
H!W W⇤!`⌫`⌫ m``<55 m``<55 m``<55 m`` inputs to BDT
decay topology ``<1.8 ``<1.8 ``<1.8 `` inputs to BDT
Nomt requirement Nomtrequirement Nomtrequirement mt inputs to BDT
The close proximity of the missing transverse momentum to the charged leptons inZ/ ⇤!⌧ ⌧ and multijet events motivates a requirement on the transverse mass constructed for each lepton:
m`t= q
2pt`·pmisst · 1 cos , (5)
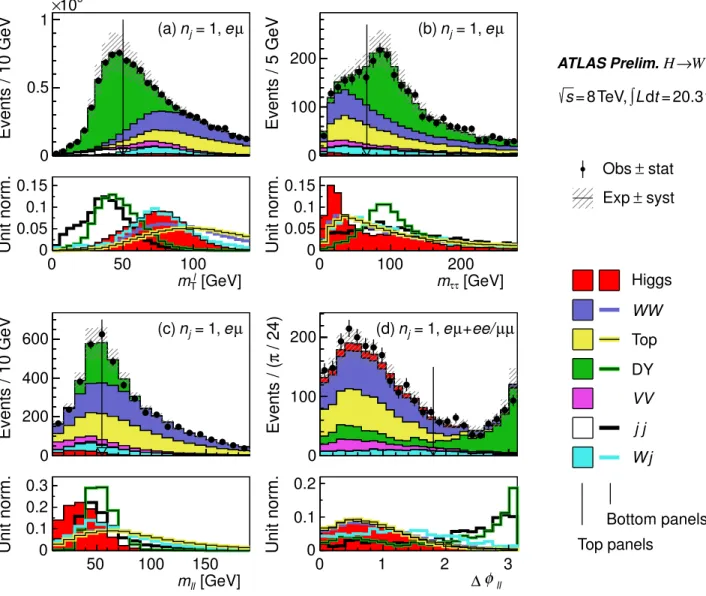
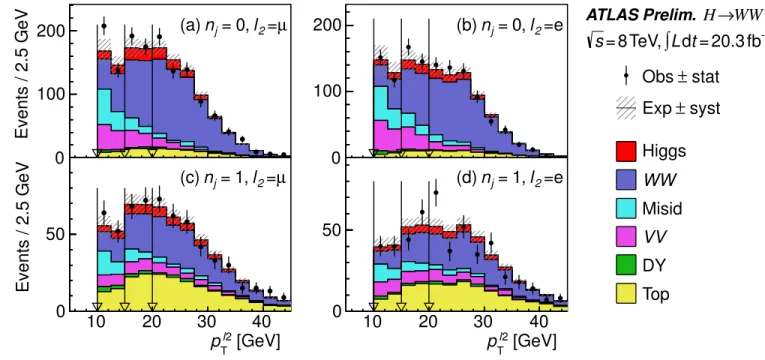
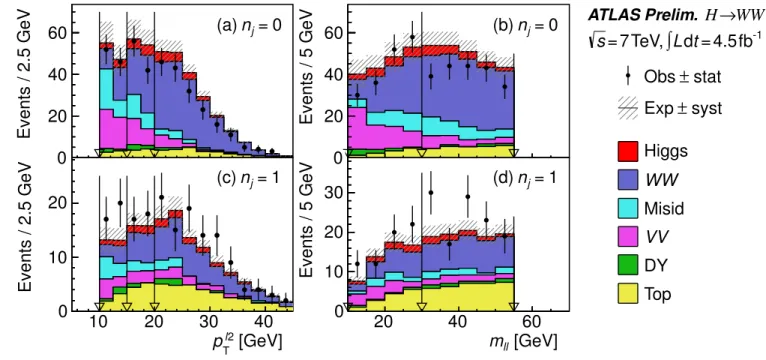
where is the angle between the lepton transverse momentum andpmisst . This quantity tends to have small values for DY production and large values for the signal process. It also has small values for multijet production, where misidentified leptons are frequently measured with a lower energy than their originating jets. Thus, both DY and multijet production are substantially reduced with a requirement ofm`1t orm`2t >50 GeV in theeµsample. Them`t distribution, chosen to be the larger ofm`1t orm`2t, is presented in Fig. 8a showing a clear di↵erence in shape between the multijet andW+jets processes, and small values forZ/ ⇤!⌧ ⌧.
The requirement of a jet allows for improved rejection of the Z/ ⇤!⌧ ⌧ background. Using the direction of the measured missing transverse momentum, the fractional momentum of the charged lepton from a given tau-lepton decay, x=p`/p⌧, can be calculated [56]. With this relationship, the mass of the tau-lepton pair is evaluated as m⌧ ⌧=m``/px1 x2, requiringx1>0 and x2>0. This technique of reconstructing the mass of the⌧ ⌧ system is called the collinear approximation. A requirement of m⌧ ⌧<(mZ 25 GeV) significantly reduces the contribution from Z bosons decaying to⌧-lepton pairs, as can be seen in Fig. 8b.
The remaining selection criteria (pmiss (trk)t,rel ,frecoil,m``, ``) are the same as in thenj= 0 category, exceptpt`` is replaced with a magnitude of pt``j=pt``+ptj in the calculation of frecoil, and the pmiss (trk)t,rel threshold is reduced to 35 GeV. Them``and `` distributions are shown in Fig. 8c and Fig. 8d, respectively. The `` distribution shows the sample ofeµ+ee/µµ events to best represent the di↵erences in the shapes between the signal or W W processes
Events / 5 GeV 0 1 2
103
×
0 50 100
Unit norm. 0
0.1 0.2 0.3
/ 24) πEvents / (
0 100 200
0 1 2 3
Unit norm. 0
0.1 0.2 0.3
Events / 10 GeV
0 0.5 1
103
×
100 200
Unit norm. 0
0.1 0.2 0.3
Events / 0.05
10 102
103
0 0.5 1
Unit norm.
10-1
1
stat
± Obs
syst
± Exp
Higgs WW VV Top DY Misid
Bottom panels Top panels
µ , e 0
j= (a) n
[GeV]
ll
pT
µ , e 0
j= (b) n
[GeV]
mll
µ µ ee/
, 0
j= n (d)
recoil
f µ
e , 0
j= n (c)
φll
∆
ATLAS Prelim.H→WW*
fb-1
20.3
= t d
∫
L TeV, 8= s
FIG. 7. nj= 0 distributions for (a)pt``, (b)m``, (c) ``, and (d)frecoil. The plot in (a) is made after requiring all selections up to thept``one, (b) up tom``, (c) up to ``and (d) up tofrecoil(see Table V). For each variable the top panel compares the observed and the cumulative expected distributions; the bottom panel shows the overlay of the distributions of the individual expected contributions normalized to unit area to emphasize shape di↵erences. The legend order follows (c); see Fig. 5 for plotting details.
andZ/ ⇤background processes.
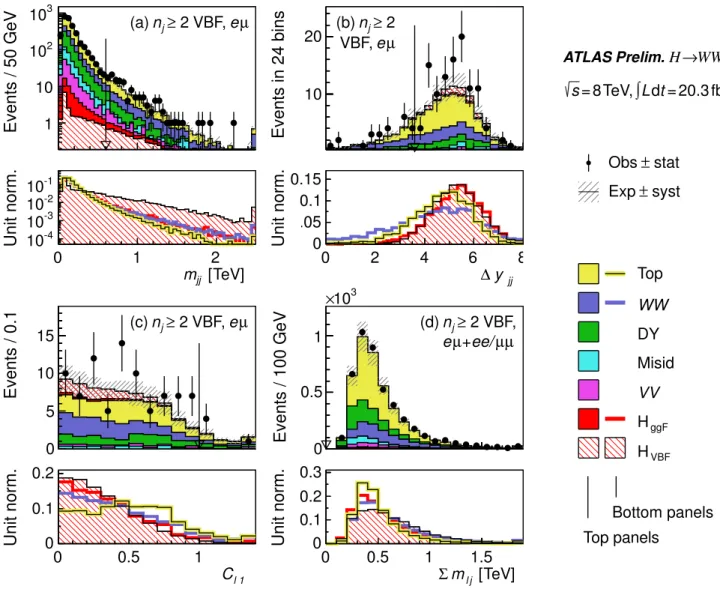
C. VBF-enriched nj 2
The nj 2 sample contains signal events produced by both VBF and ggF production mechanisms. This section focuses on the former; the next section focuses on the latter.
The sample is analyzed using a boosted decision tree (BDT) multivariate method [15] that considers VBF Higgs boson production as signal and the rest of the processes as background, including ggF Higgs boson production. A cross-check analysis is performed including some of the variables which are used as inputs to the BDT. Table VII reports the sample composition after each of the selection requirements in the cross-check analysis.
The VBF process is characterized by the kinematics of the pair of tag jets (j1j2) and the activity in the rapidity gap between them, yjj=|yj1 yj2|. In general, this process results in two highly energetic forward jets with a value of
yjj>3. The invariant mass of the tag-jet pair combines yjj withptj information sincemjj⇡e yjj/2p
ptj1·ptj2 for large values of yjj. Both yjj andmjj are input variables to the BDT; for the cross-check analysis yjj>3.6 and